Develop Django Under the Debugger

PyCharm Professional has long had great support for developing Django applications, including a run configuration tailored to the Django server. This winds up being a wonderful workflow, with a tool window showing the server output.
https://youtu.be/zFuaU3Sl4-c
Sometimes, though, you hit a problem and want to debug your code. You stop the server, run it under the debugger, and do your debugging. Which also works really well: PyCharm’s visual debugger is a key selling point and integrates nicely into Django (e.g. template debugging.) And recently, PyCharm’s debugger has undergone dramatic speedups, especially when using Python 3.6. In fact, running under the debugger is approaching the speed of normal run configurations.
But still, it’s irritating to stop you server, restart under the debugger, stop the server, and restart under the regular runner. It messes up your flow, and you’ll be tempted to blasphemy of debugging with print().
So let’s break with the past with a crazy idea: always run under the debugger when developing Django.
Note: If you’ve taken Kenneth Love’s fantastic Django Basics course at Treehouse, you might recognize the code in this blog post. Enjoyed watching their approach to teaching.
Regular Running
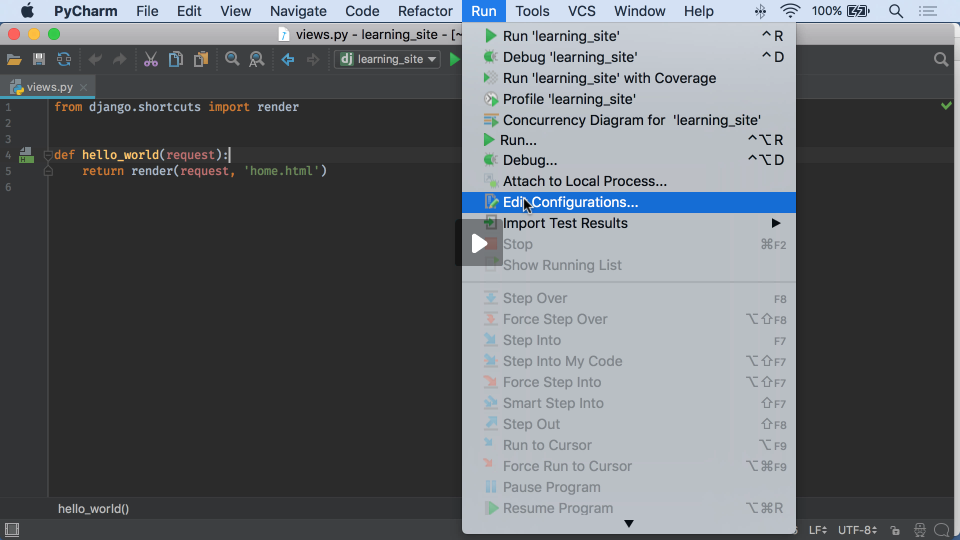
Let’s start with the “normal” path. PyCharm usually makes a Django run configuration automatically, but if not, here’s how to do so: Run -> Edit Configurations -> + -> Django Server:
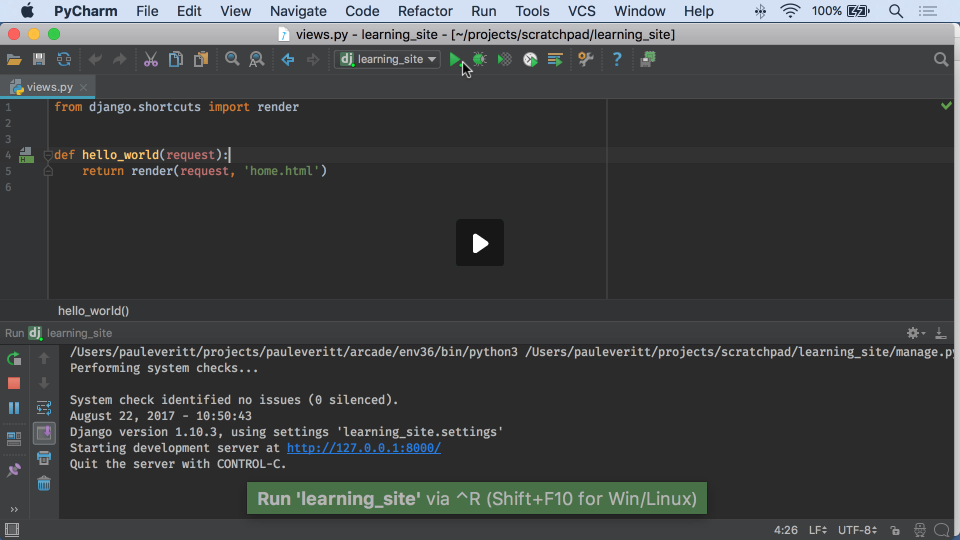
With this run configuration selected, click the green play button to start the Django server:
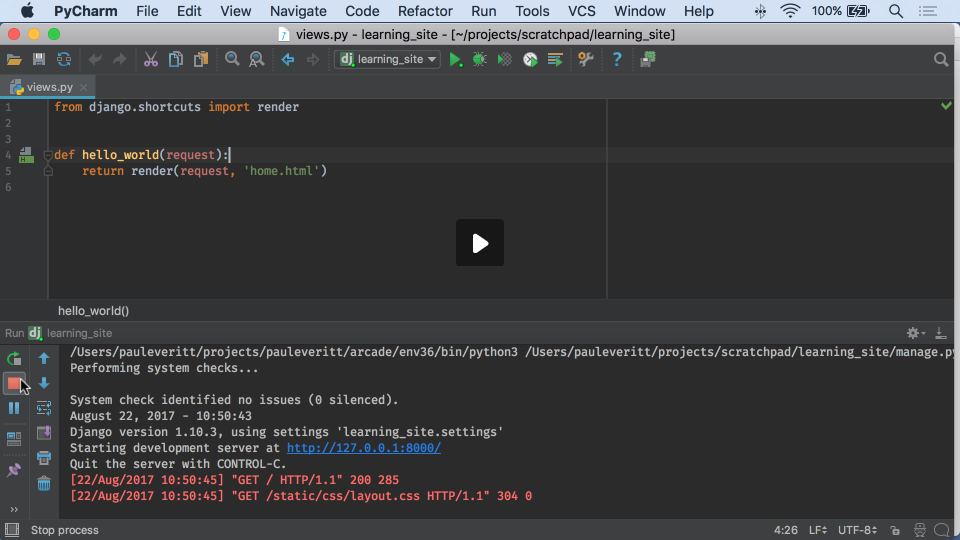
When done, click the red button to stop the server:
You can also restart the server, use keystrokes instead of the mouse, let Django restart automatically on code changes, get linked tracebacks to jump directly to errors, etc.
Debugging
You’re likely familiar with all that. Let’s now do the same thing, but running under the debugger. Click the green button with the bug on it to start that Run/Debug configuration, but running under the debugger instead of the normal runner:
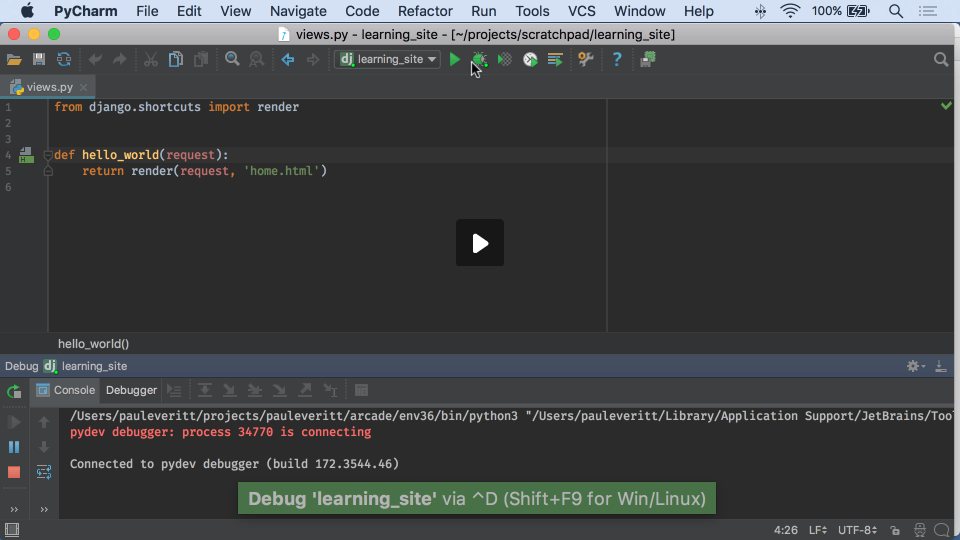
Note: If you get a link saying you can compile the debugger speedups under Cython (on Windows, we ship it by default), click the link, the speedups are worth it.
Let’s compare the restart-on-edit times side-by-side:
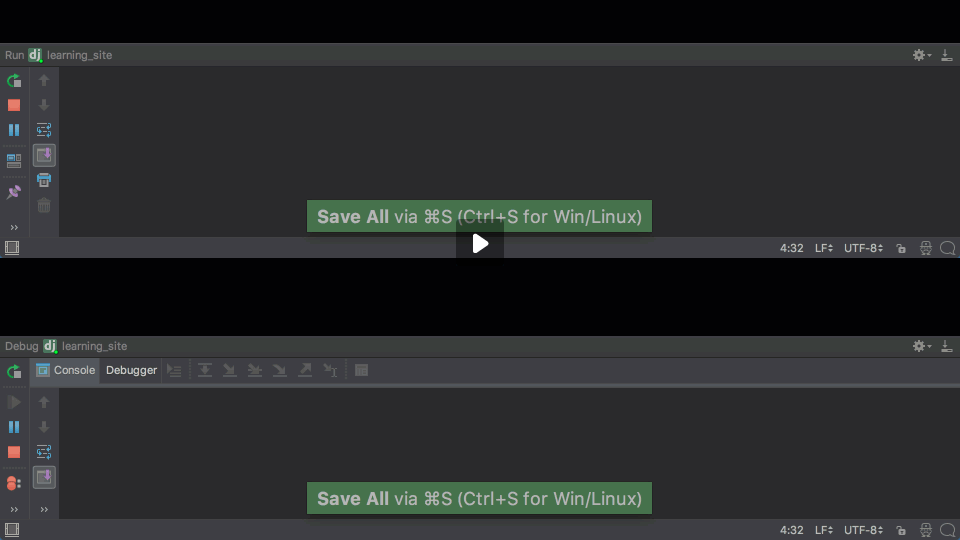
As you can see, the debugger’s restart hit isn’t that big, certainly compared to the savings versus other parts of your development workflow (e.g. moving print statements and reload versus moving breakpoints without restarting.)
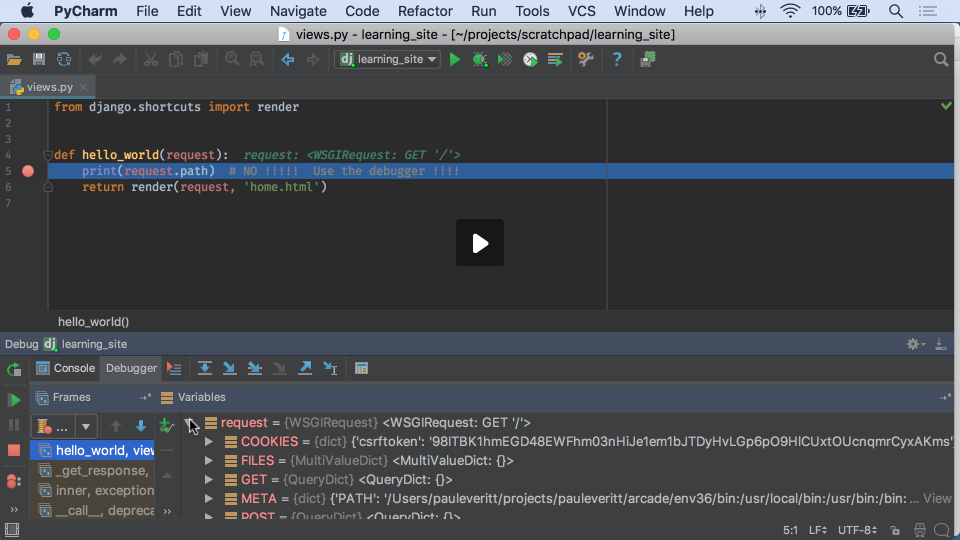
I can proceed as normal, writing new views and trying them in the browser or the built-in REST client. But when I hit a problem, I don’t reach for print() — no, I set a breakpoint!
In fact, I can set a breakpoint in a template and then poke around at that line of template execution:
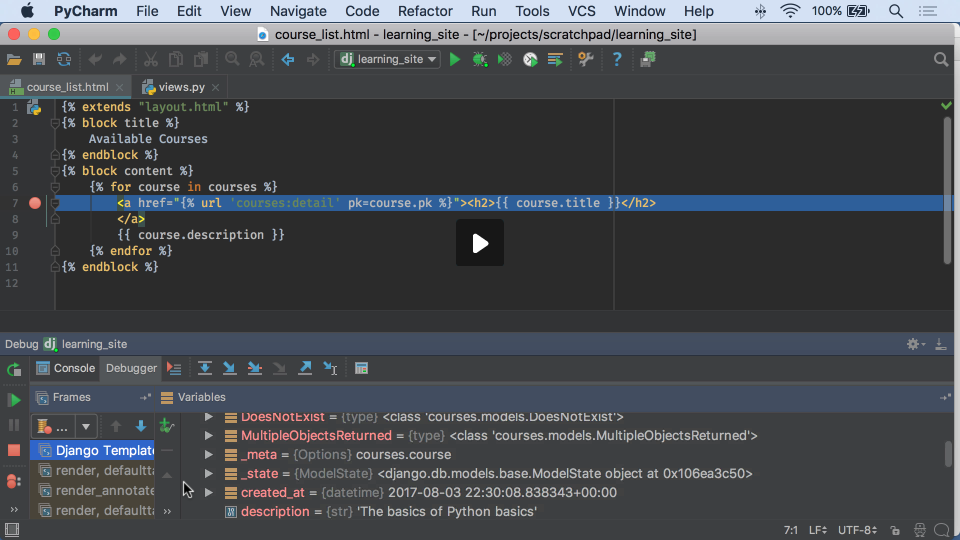
Much better than random print statements, which require a restart each time I want to inspect something.
Testing…Under the Debugger
Always develop under the debugger? Sounds weird…the debugger is for debugging. Let’s make it weirder: always do testing under the debugger.
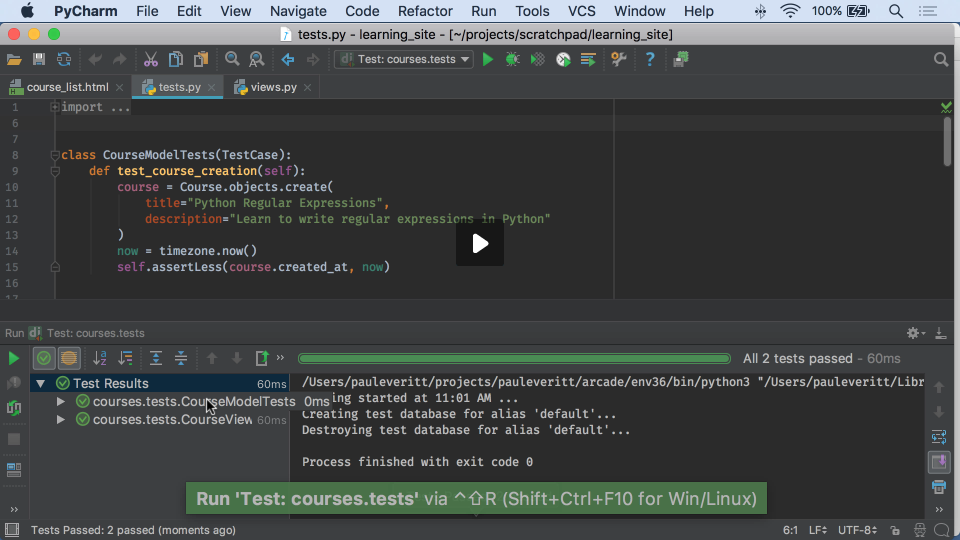
For example, you might run Django tests under PyCharm’s handy Django Test run configuration:
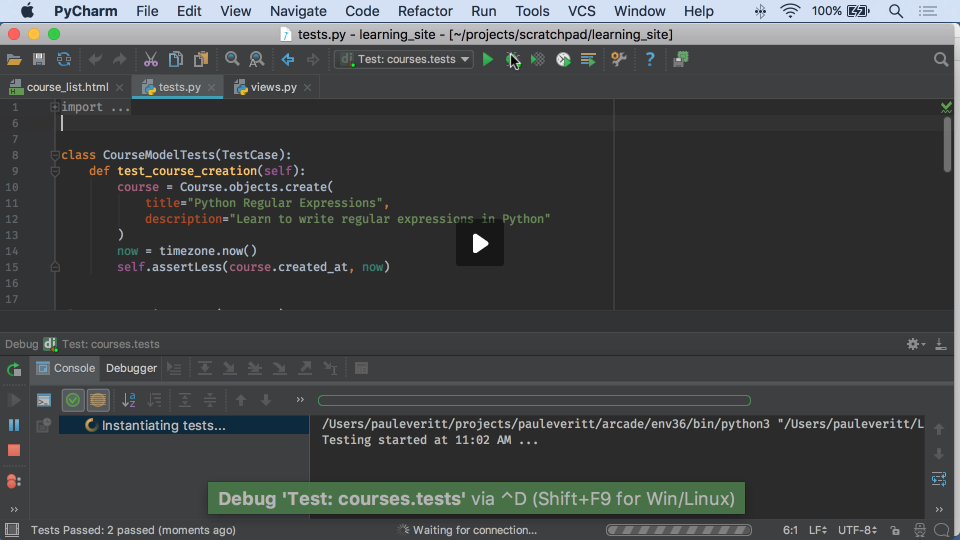
But you can also launch your test runner under the debugger:
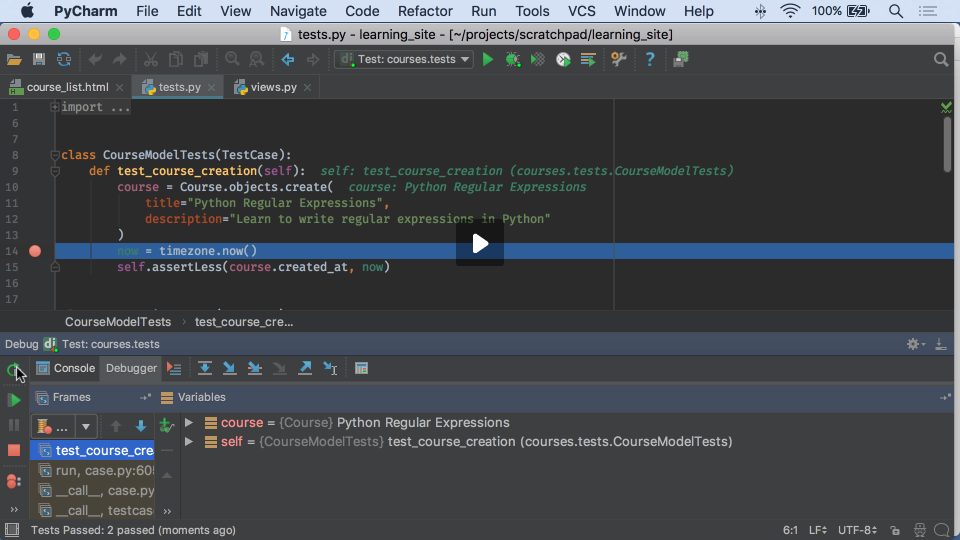
Test running under the debugger is an interesting case. Often with testing you are exploring, and sometimes, you are actually intending to produce bugs when writing a test case. Having the debugger close at hand can fit well with TDD:
Downsides
No free lunch, of course. Even if we have increased performance, dramatically for Python 3.6, there is still a speed hit. Not just on startup, but on execution.
You may run into quirks in obscure usages. For example, when running pytest tests under the debugger, you can’t get to the console (known issue slated to be fixed in 2017.3.) Also, tracebacks might be longer since the code is running under pydevd.
Conclusion
At two recent conferences I mentioned this — do your Django development under the debugger — to people who visited the booth. The reactions were fascinating, as a look of horror turned to confusion then curiosity ending with interest.
For some, it might never fit your brain. For others, it might make all the sense in the world. Want to tell me I’m crazy? It’s possible. Leave me a comment below with any feedback.