How to Debug a Jupyter Notebook in PyCharm

Making mistakes in your code is a pain, and debugging in Jupyter notebooks can get messy. While Jupyter helpfully displays the full Python traceback, which highlights the lines that have failed, working out exactly what caused the issue in your code can be tricky. I usually end up pulling my code apart in new cells in the same notebook, which creates a huge mess to clean up after discovering the problem. In this blog post, we’ll go over how you can instead use PyCharm’s debugger to track down problems with your code much more efficiently and cleanly.

Our example problem
We’ll work with a simple example: creating a decision tree classifier to predict the species of an iris by using the classic iris dataset.
To start, we’ll import our dependencies, scikit-learn and NumPy.
from sklearn import datasets, tree
import numpy as np
We’ll then create functions to read in the iris dataset and train our decision tree classifier.
def import_data() -> tuple:
   iris = datasets.load_iris()
   X = iris.data
   y = iris.target
   return X, y
def fit_dt_model() -> tree.DecisionTreeClassifier:
   X, y = import_data()
   return tree.DecisionTreeClassifier().fit(X, y)
Next, we’ll create a function which predicts the iris species for new examples. This function takes a NumPy array containing a value for each of the four model features – sepal length, sepal width, petal length and petal width – and passes those to the model. It then retrieves the predicted iris species and the probability that this prediction is correct.
def make_iris_prediction(X_values: np.array) -> tuple:
   model = fit_dt_model()
   class_pred = model.predict(X_values)
   predict_proba = model.predict_proba(X_values)
   return class_pred, predict_proba
Let’s imagine that the values we’ll be using to make these predictions are stored as comma-delimited strings. We’ll need to first split these values and then convert them to a numeric format. We’ll create a function to do this.
def convert_to_int_list(number_strings: list) -> list:
   list_of_int_lists = []
   for number_string in number_strings:
       int_list = []
       for number in number_string.split(","):
           int_list.append(float(number))
       list_of_int_lists.append(int_list)
   return list_of_int_lists
We’re now ready to test our model with some fresh predictions! Let’s pass a new string of values to our model.
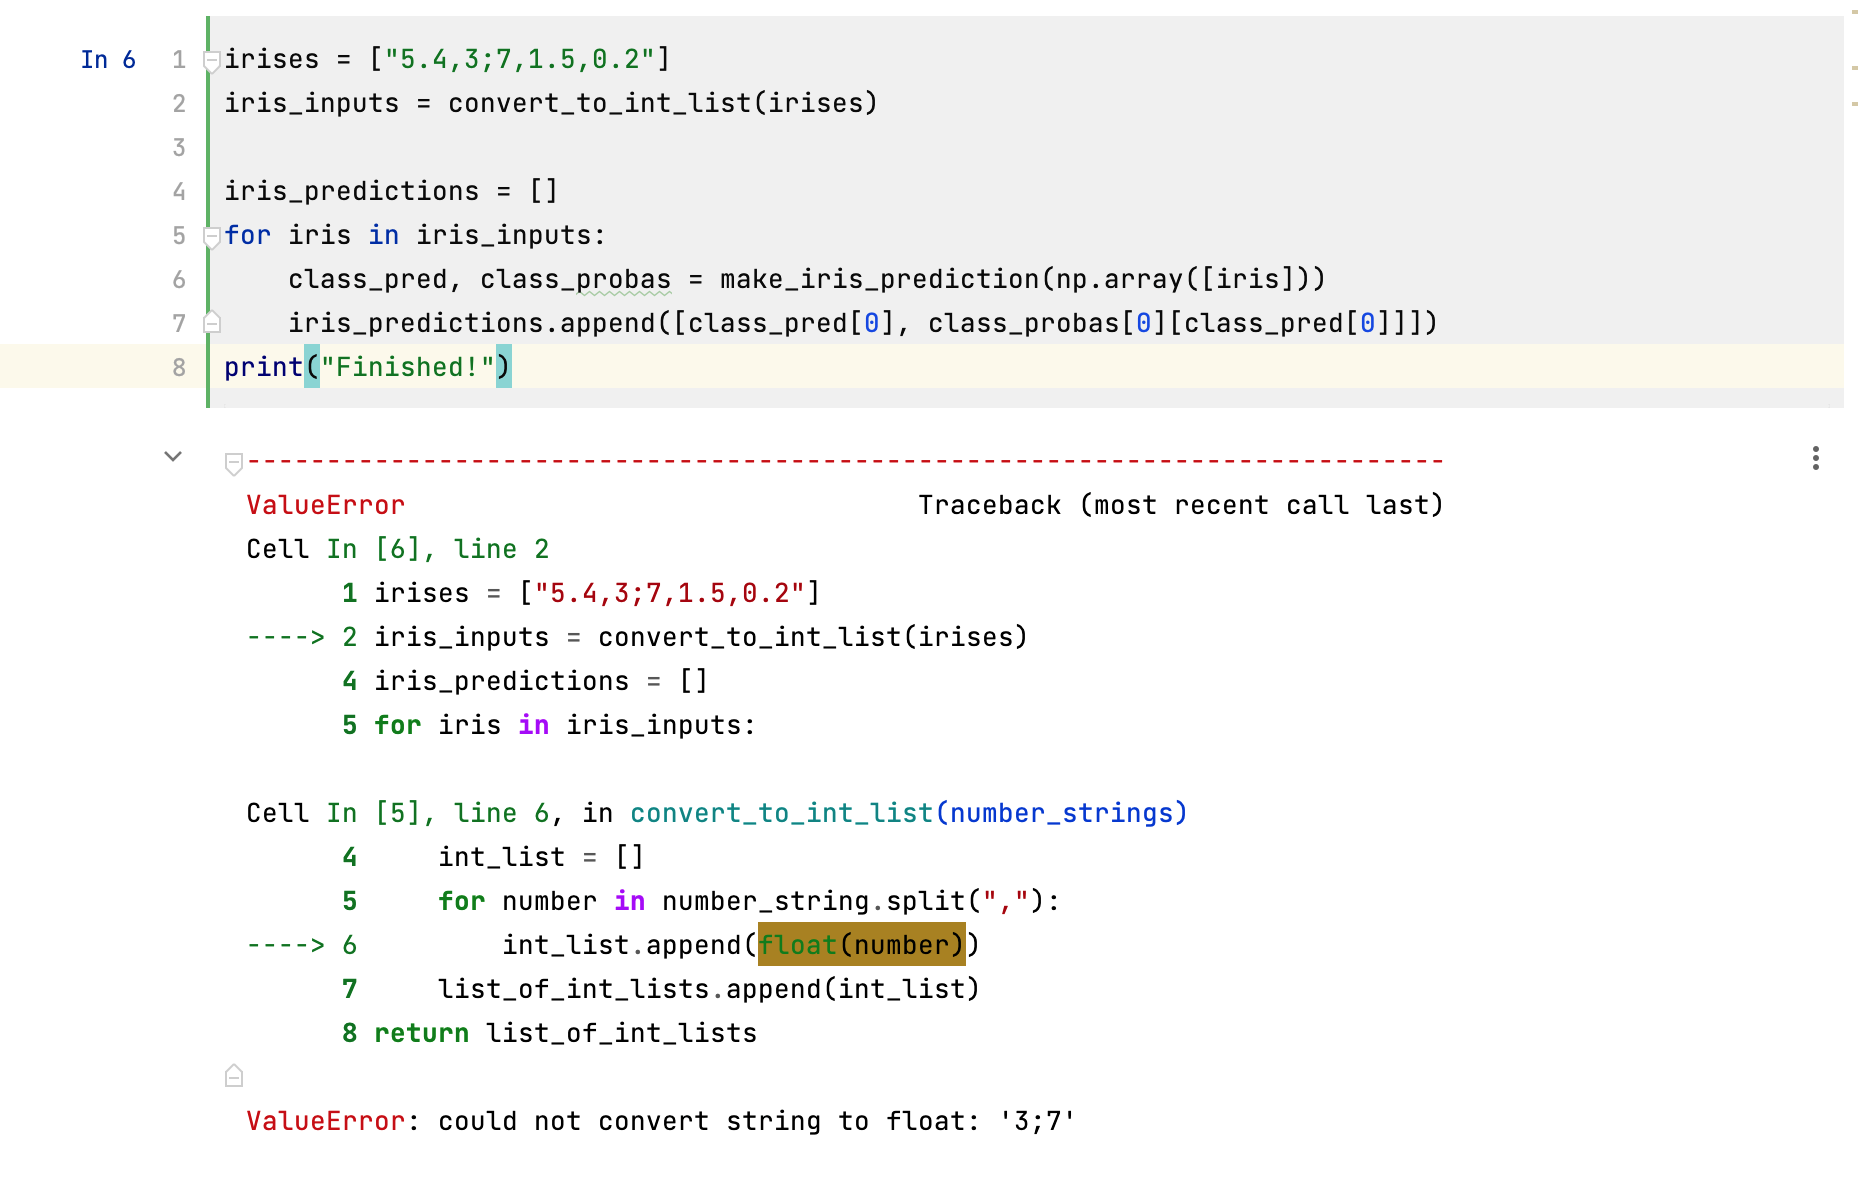
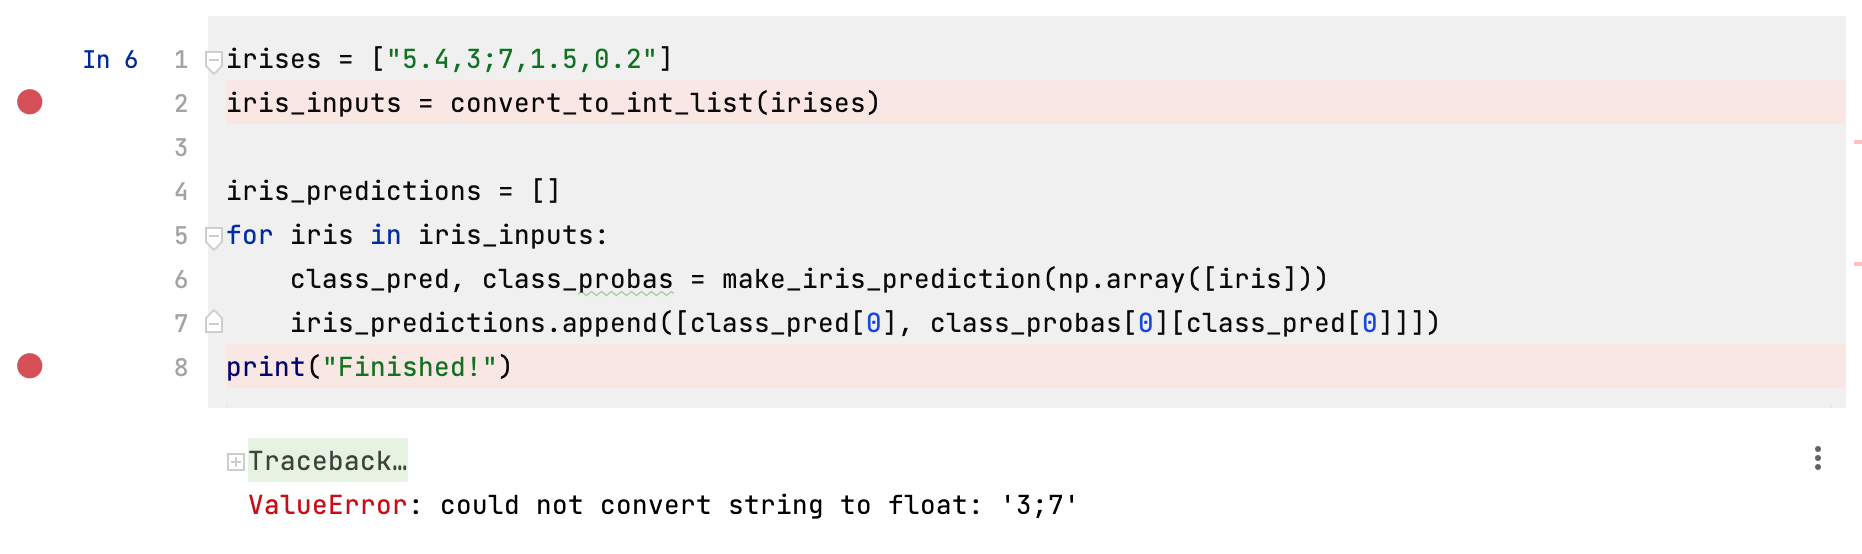
irises = ["5.4,3;7,1.5,0.2"]
iris_inputs = convert_to_int_list(irises)

iris_predictions = []
for iris in iris_inputs:
   class_pred, class_probas = make_iris_prediction(np.array([iris]))
   iris_predictions.append([class_pred[0], class_probas[0][class_pred[0]]])
print("Finished!")
Ah, but we get an error! The traceback is telling us that when we call the function convert_to_int_list on the list irises, it can’t convert one of the values to a float.
At this stage, I would normally start copying and pasting code in new cells, trying to figure out what had happened. However, we can use the debugger to avoid replicating code and messing up our notebook, while systematically working through to where the code fails.
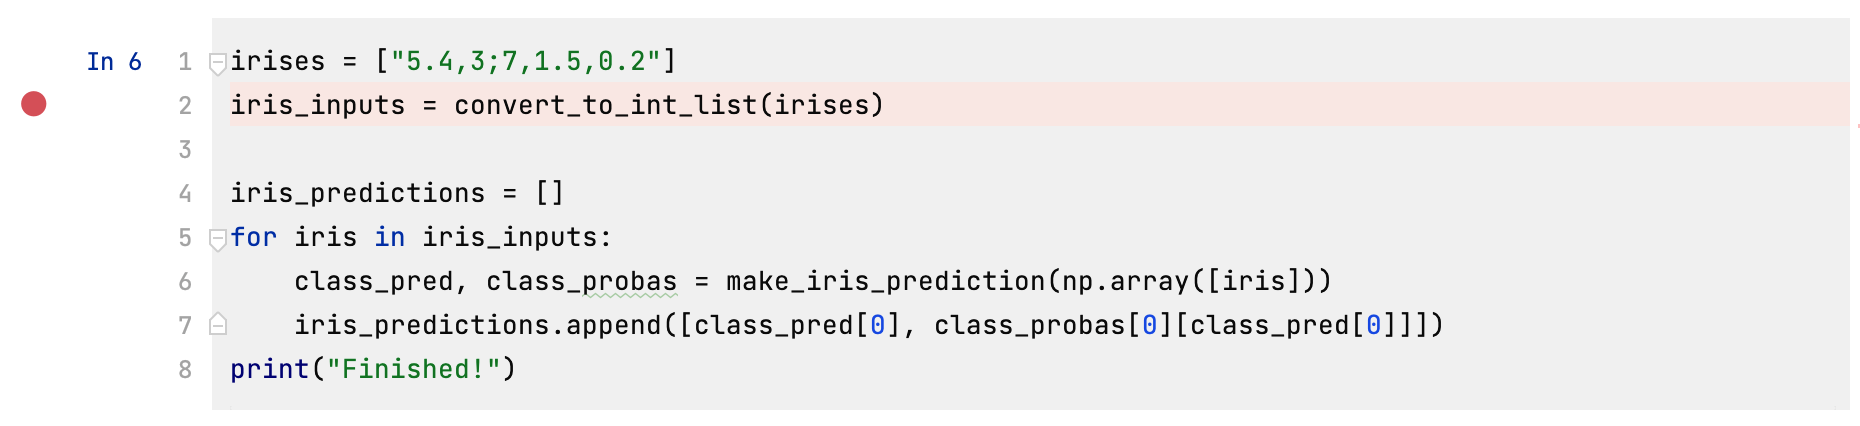
As the traceback tells us that the code is failing on line 2, we can start the debugging process by inserting a breakpoint on this line. A breakpoint is a marker which indicates that we want to interrupt the execution of a cell at a certain line. We can add a breakpoint by clicking in the gutter to the left of a cell. You can see a red point next to line 2, indicating that we’ve inserted a breakpoint at this line.
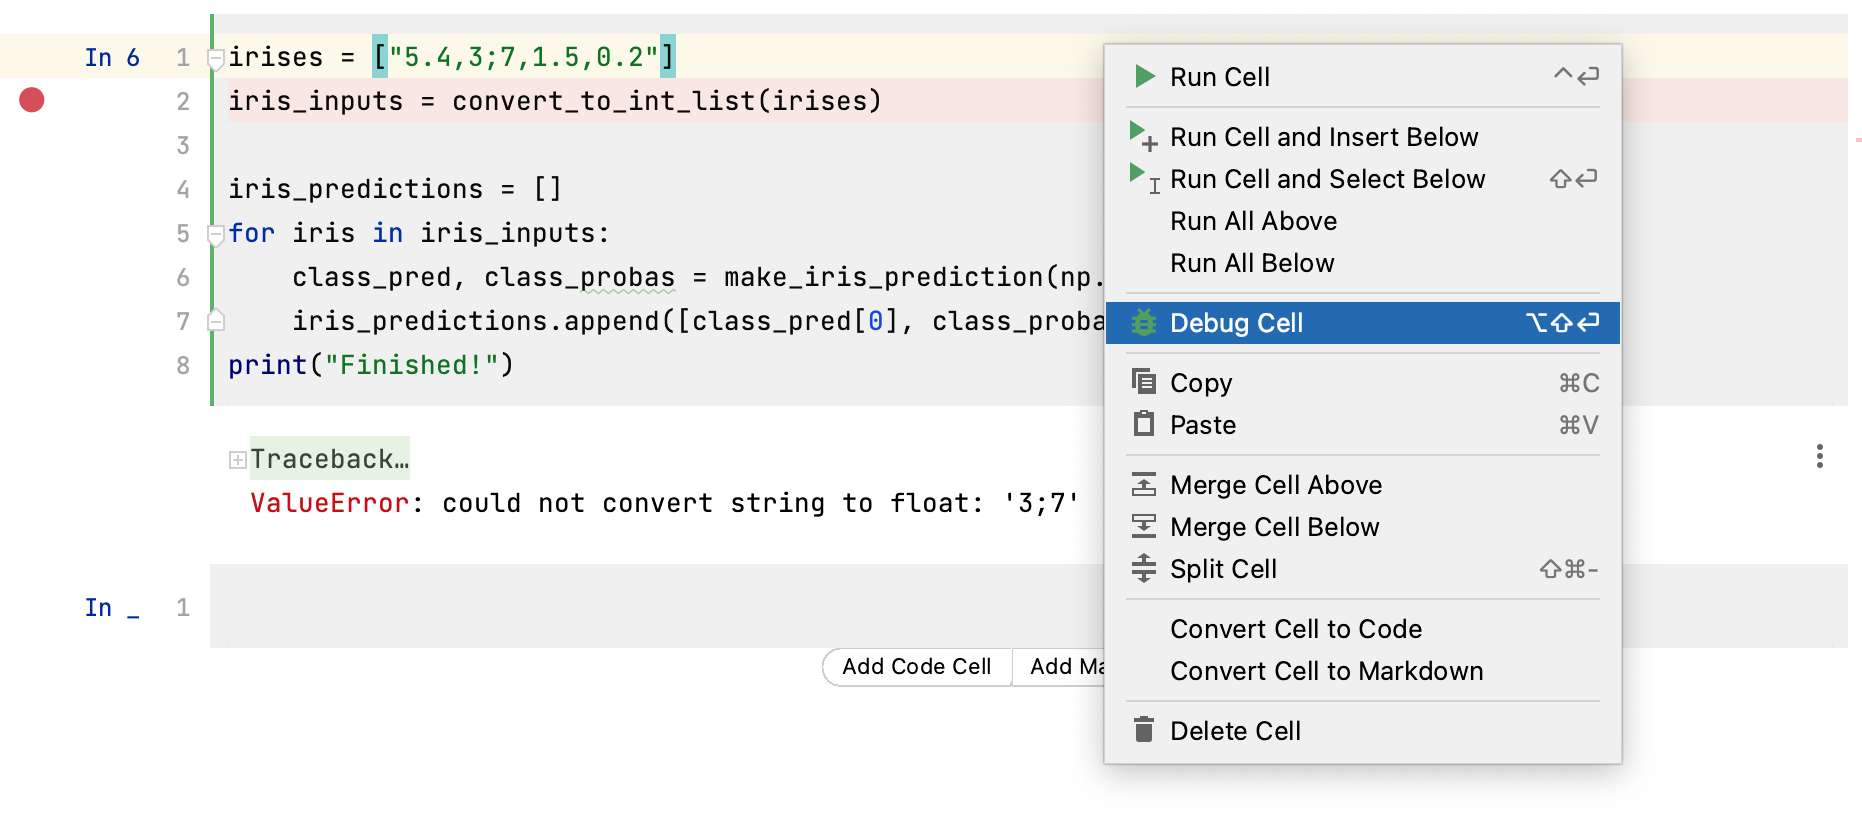
We can then right click within this cell and select Debug Cell.
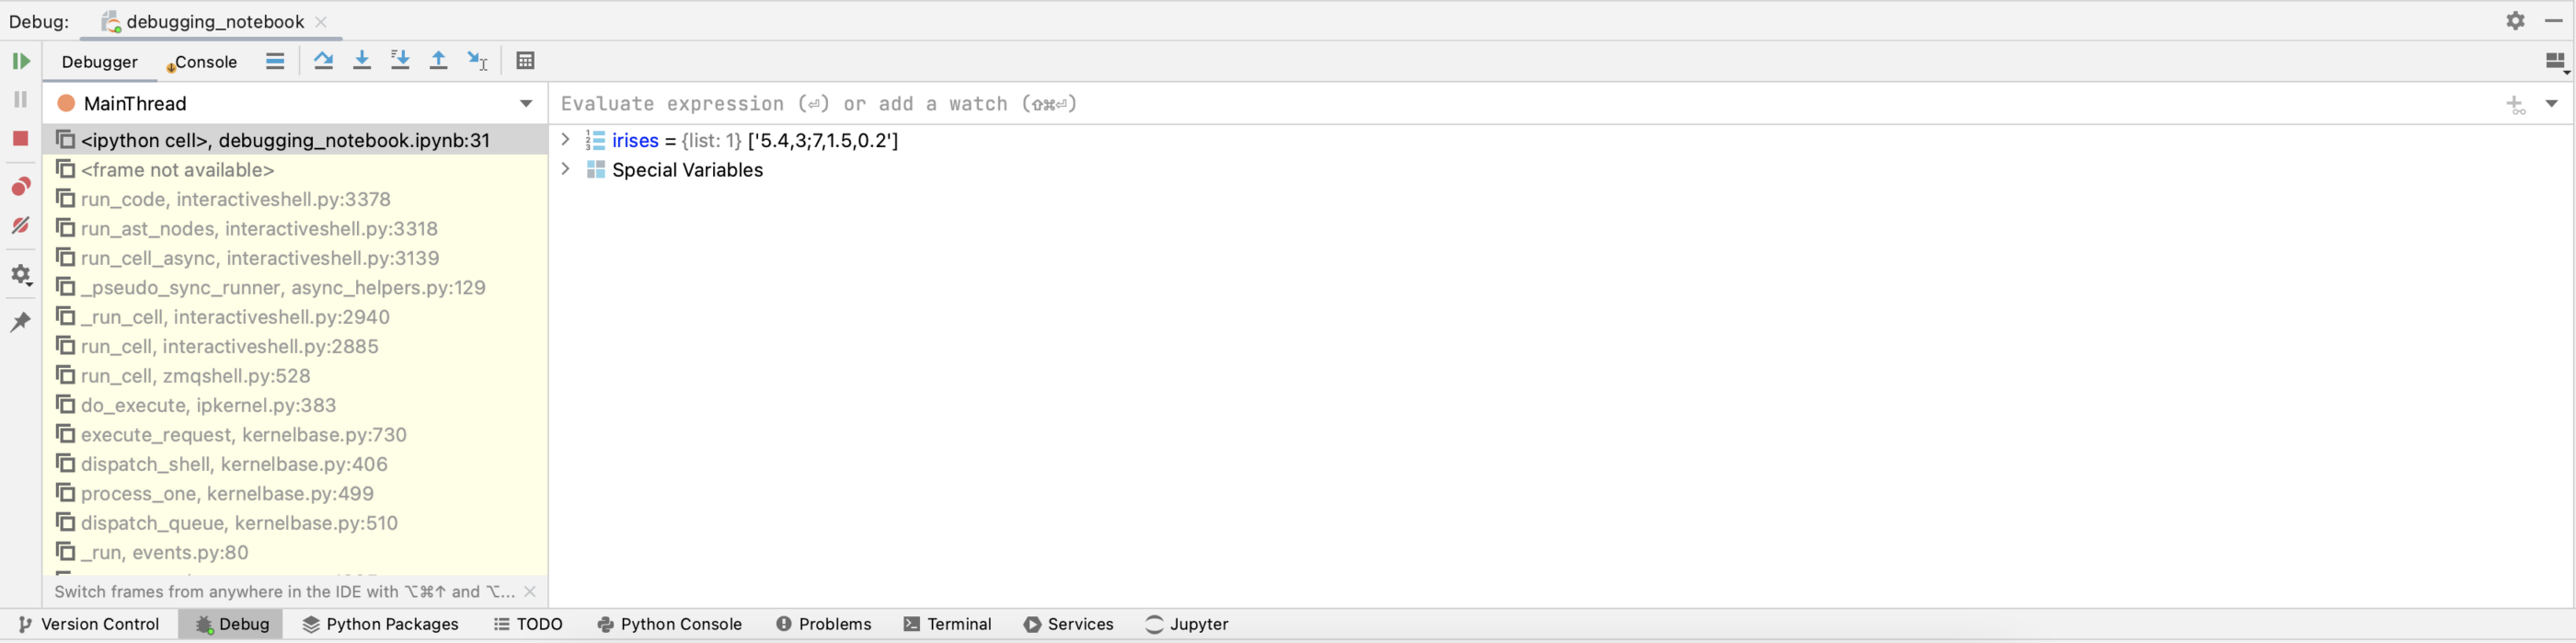
This will open the Debug tab at the bottom of PyCharm. We’re now ready to diagnose what went wrong in our code!
Using the debugger to find the point of failure
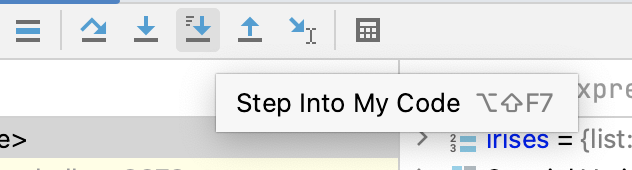
In the image above, we can see that the list irises has already been created in the Debug tab. This is because all of the code in the cell prior to the breakpoint has been executed, and in line 1 of the cell we create this list. We can now work out what is going on when our function convert_to_int_list tries to execute over this list. There are a number of blue arrows at the top of the Debug tab. Click the one called Step Into My Code.
This instructs the debugger to enter the function call for convert_to_int_list. After clicking this button once, you can see that the first step in the function call has been executed, assigning our irises list to the number_strings argument. You might have also noticed that, even though the function we’re stepping into is defined in another cell, the debugger is still able to access it while debugging this cell.
If we continue clicking through, we can see that the function is executed step by step. Sequentially, it:
- Creates the empty list
list_of_int_lists. - Assigns our input string of numbers to
number_string. - Creates the empty list
int_list. - Splits
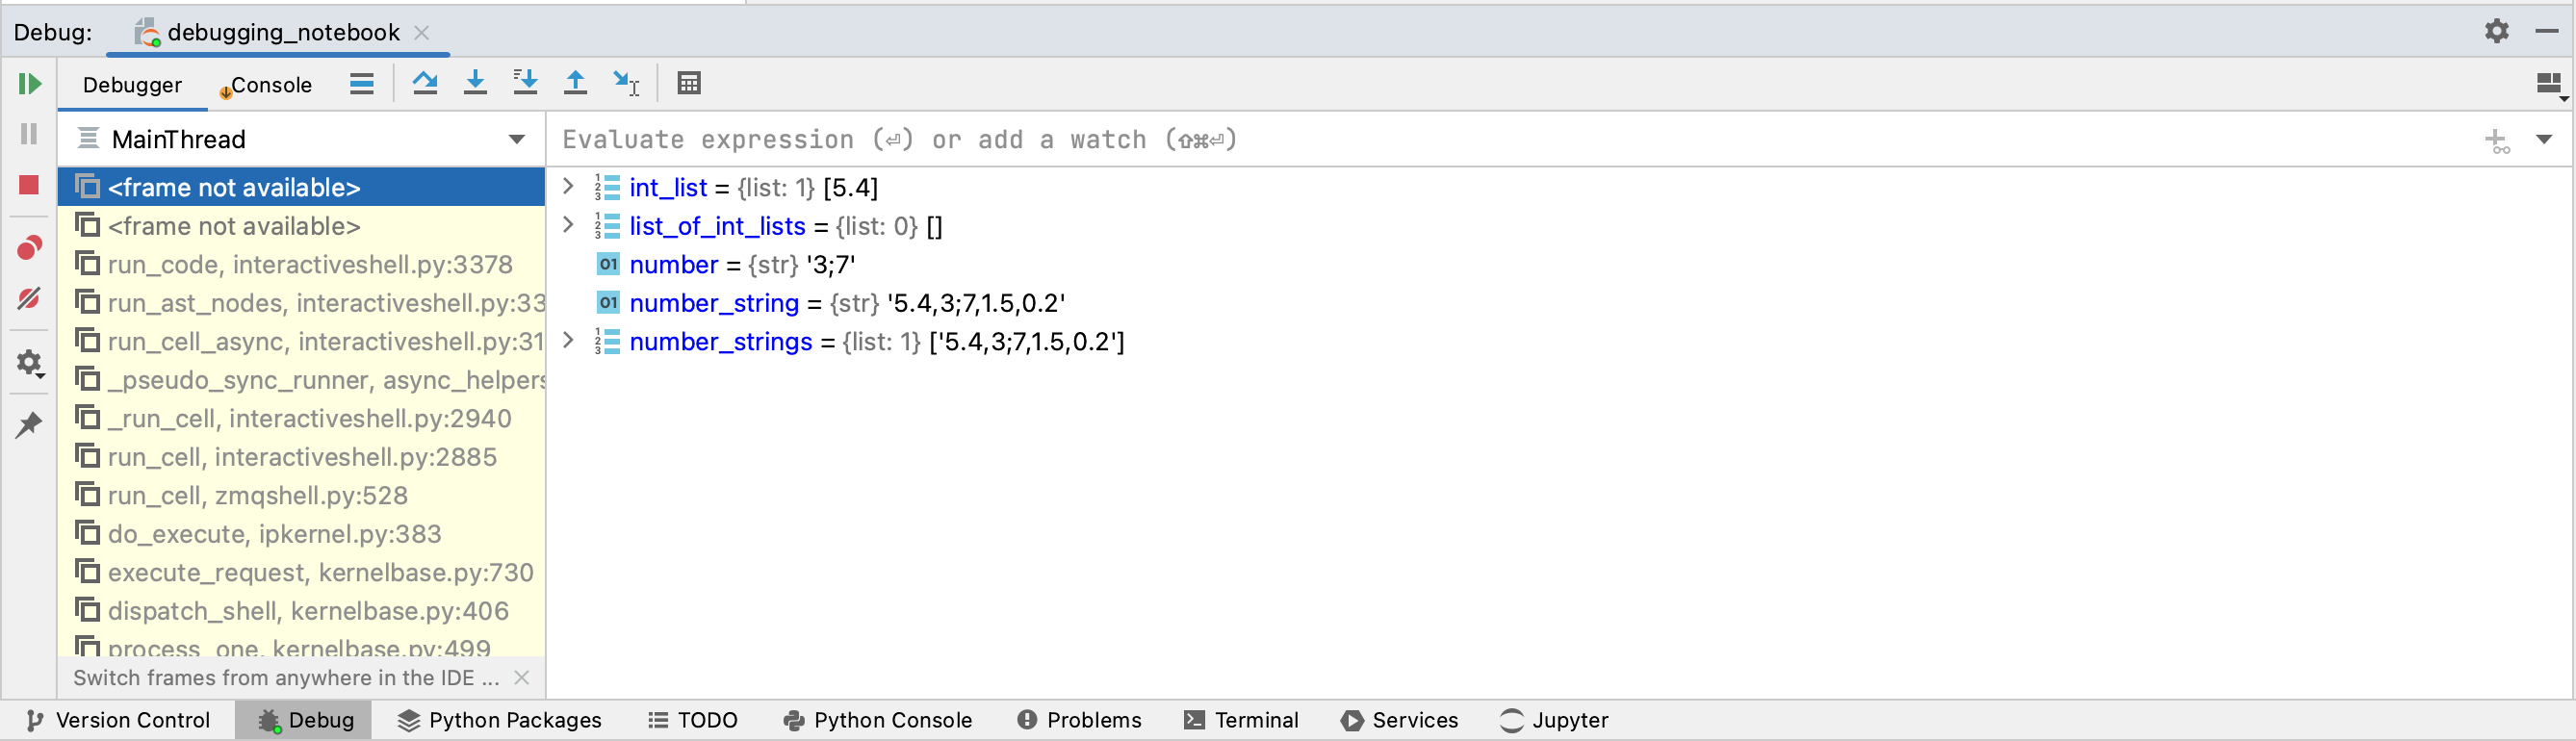
number_stringby comma and assigns the first element, “5.4”, tonumber. - Converts
numberto a float and appends it toint_list. - Takes the next element, “3;7” and assigns it to
number.
The function call then terminates, as we’ve just found the point where the error was originally thrown. We now have a good guess about what happened: the second value in our string is “3;7”, which is not a valid number. Subsequently, when we attempted to cast it to a float, it created a ValueError.
Using the debugger to test a solution
Now, we’re reasonably certain that this is the cause of our problems, but what if we want to test this before we start changing our code directly?
We can use another nice feature in the Debug tab called Evaluate Expression. This feature allows you to run code within the debugger, including defining or changing the values of variables. We can use this feature to test whether changing the value of “3;7” will actually fix the code and allow us to make a prediction from our model using this corrected input.
What we want to do is repeat what we did above, but use Evaluate Expression to change the second number to “3.7” before it gets cast to a float. We then want to resume running the rest of the code in the cell, and inspect the variables that are created to check that we’re getting valid predictions from the model. To do this, we first add an additional breakpoint after line 7, which will suspend the code after the prediction loop. Just a quick note – you can add as many breakpoints as you’d like in a cell.
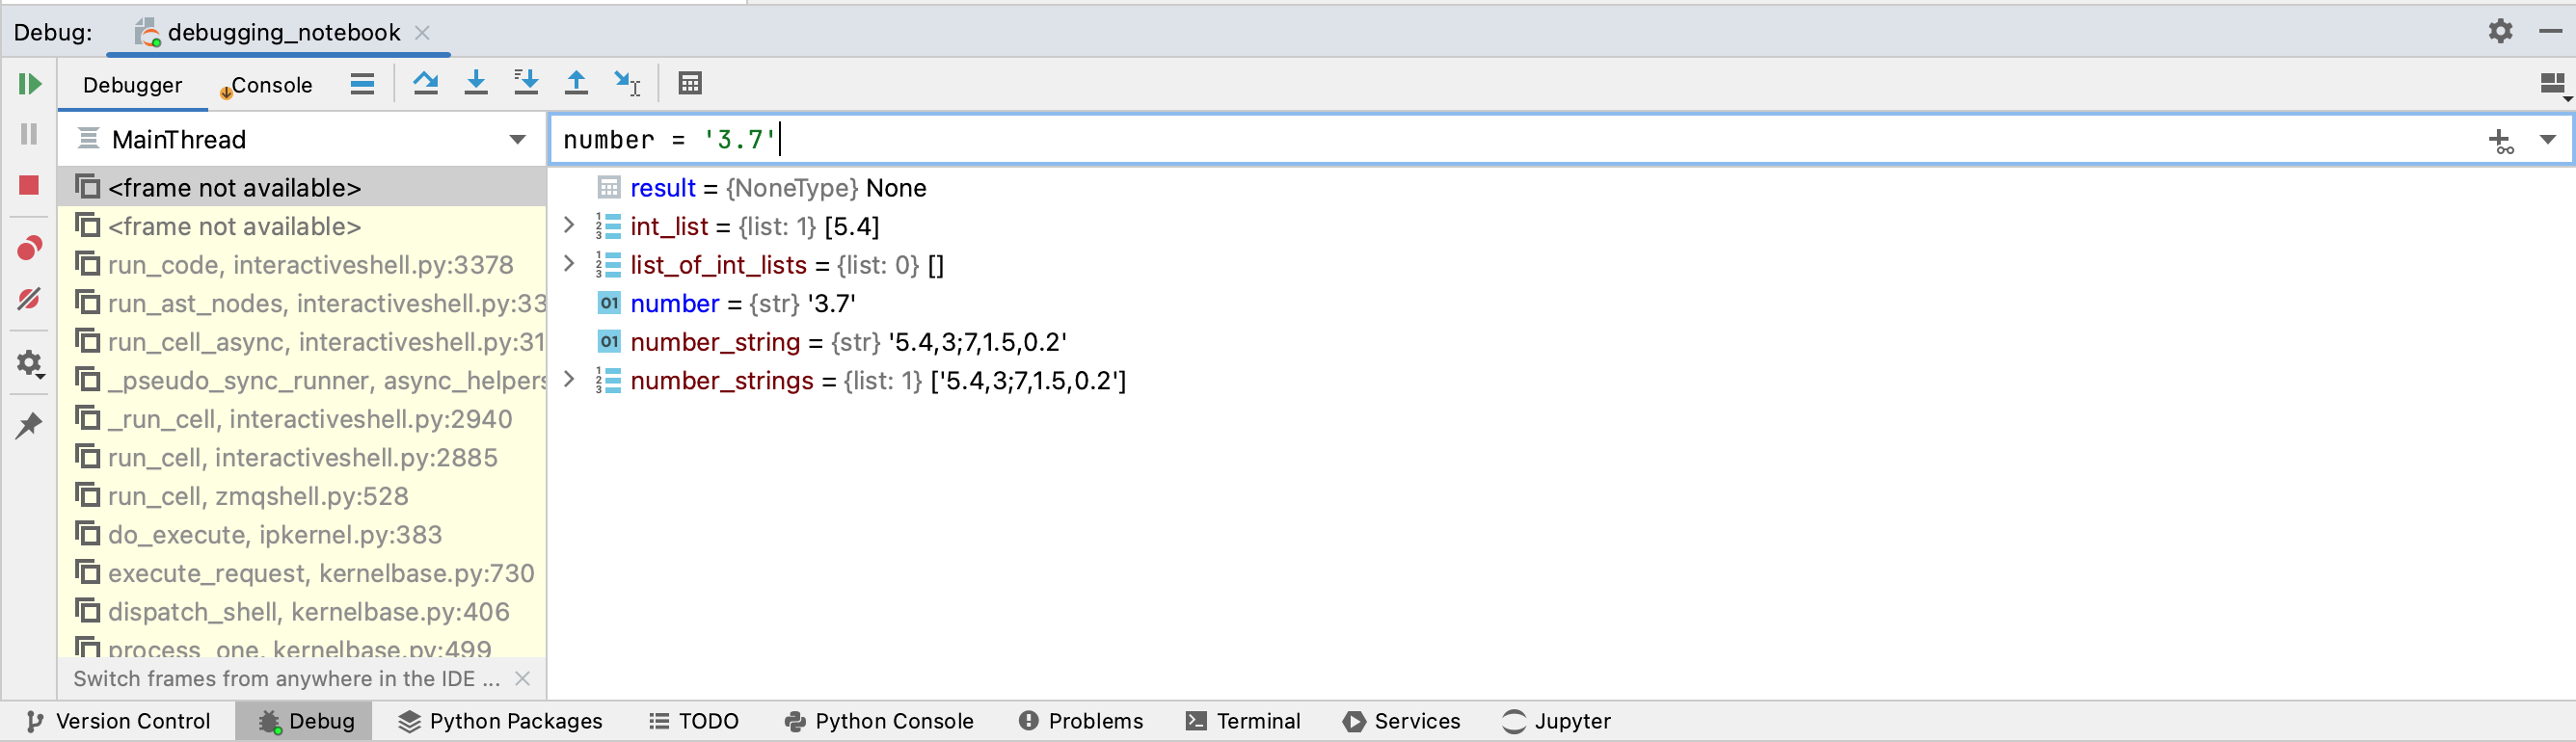
We then start the Debugger, and keep clicking on Step Into My Code until the value for number is “3;7”.
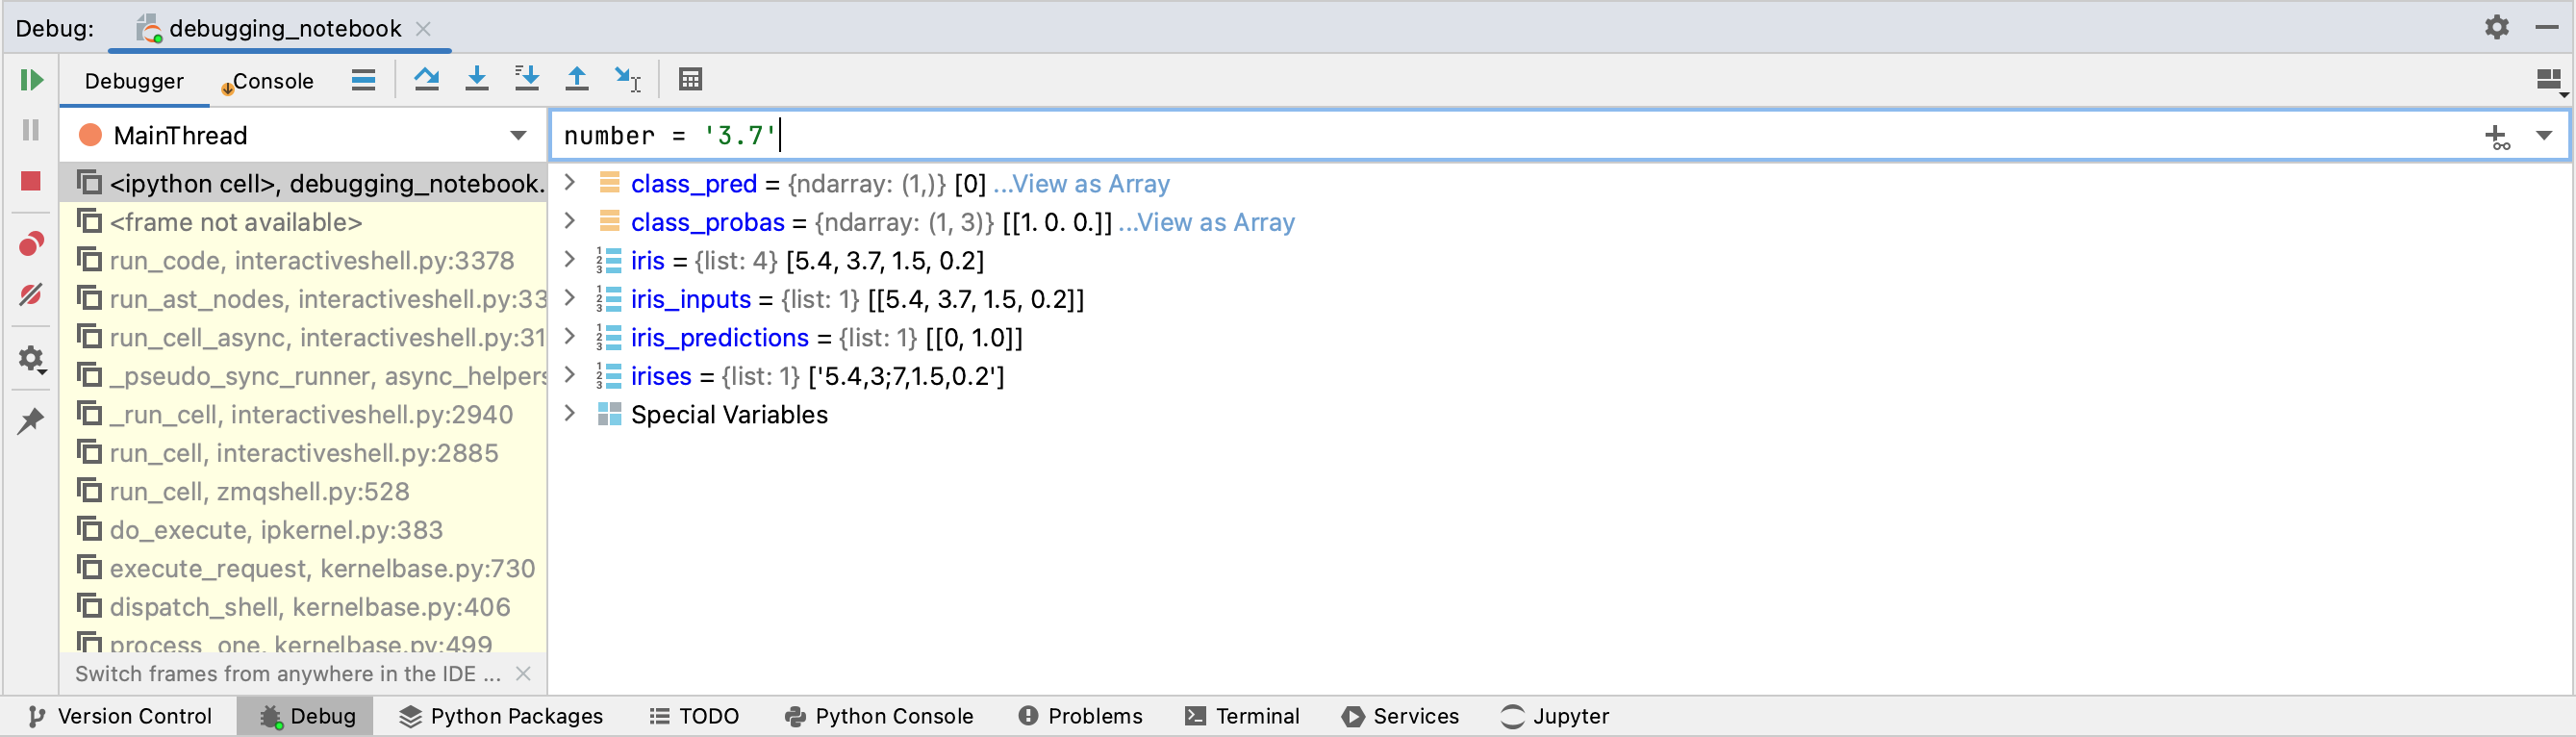
We can now use Evaluate Expression to change this to what we think is the correct value, “3.7”. To do this, we simply type number = ‘3.7’ in the box above the variables, and then hit Enter.
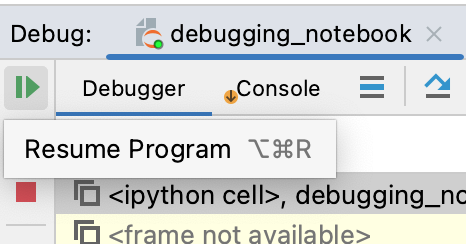
We can now resume running the code in the cell until we hit the second breakpoint. We do this by clicking the Resume Program button in the top left corner of the Debug tab.
We can see that the rest of the cell’s code executed successfully. The values in iris_inputs are all numeric, and iris_predictions contains the expected prediction (class 0) and prediction probability (1.0) for this set of values.
We can now go ahead and modify our actual code to fix the initial bug.
I hope this short tutorial has given you an idea of how the PyCharm debugger works for Jupypter notebooks, and how you can use it to make diagnosing and fixing bugs much easier and cleaner than copying and pasting chunks of your original code.