Unveiling Python 3.12: What’s New in the World of Python?

Python 3.12 made its debut on October 2, 2023, in keeping with the annual tradition of releasing new versions every October.
This latest iteration introduces a range of new features and enhancements that we will delve into in this blog post. For a comprehensive list of changes, you can refer to the official documentation.

F-Strings
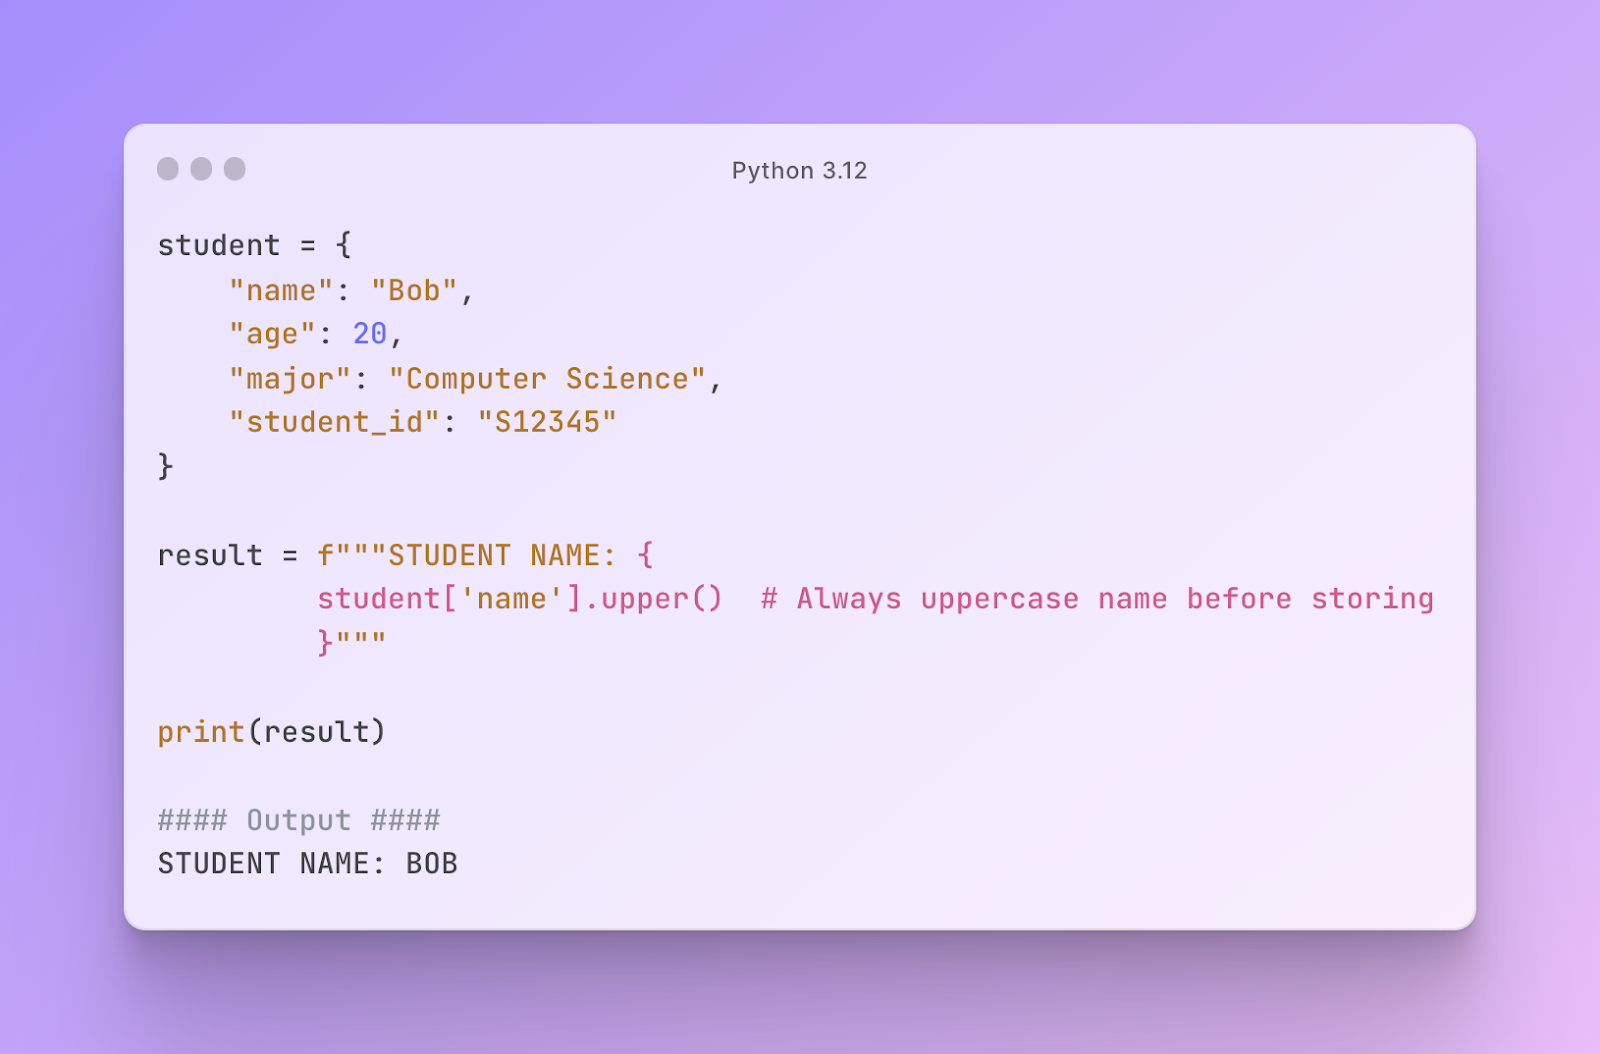
F-strings, also known as formatted string literals, were introduced in Python 3.6, providing a straightforward and concise method for string formatting. They allow the inclusion of expressions within string literals, simplifying the creation of strings with variables, expressions, or function call results. F-strings are identified by the prefix fbefore the string, and expressions within curly braces {} are computed and substituted with their values.
Due to their readability and versatility, f-strings have become the preferred choice for string formatting in Python, facilitating the creation of neatly formatted and dynamic strings in your code.
Issues addressed in Python 3.12:
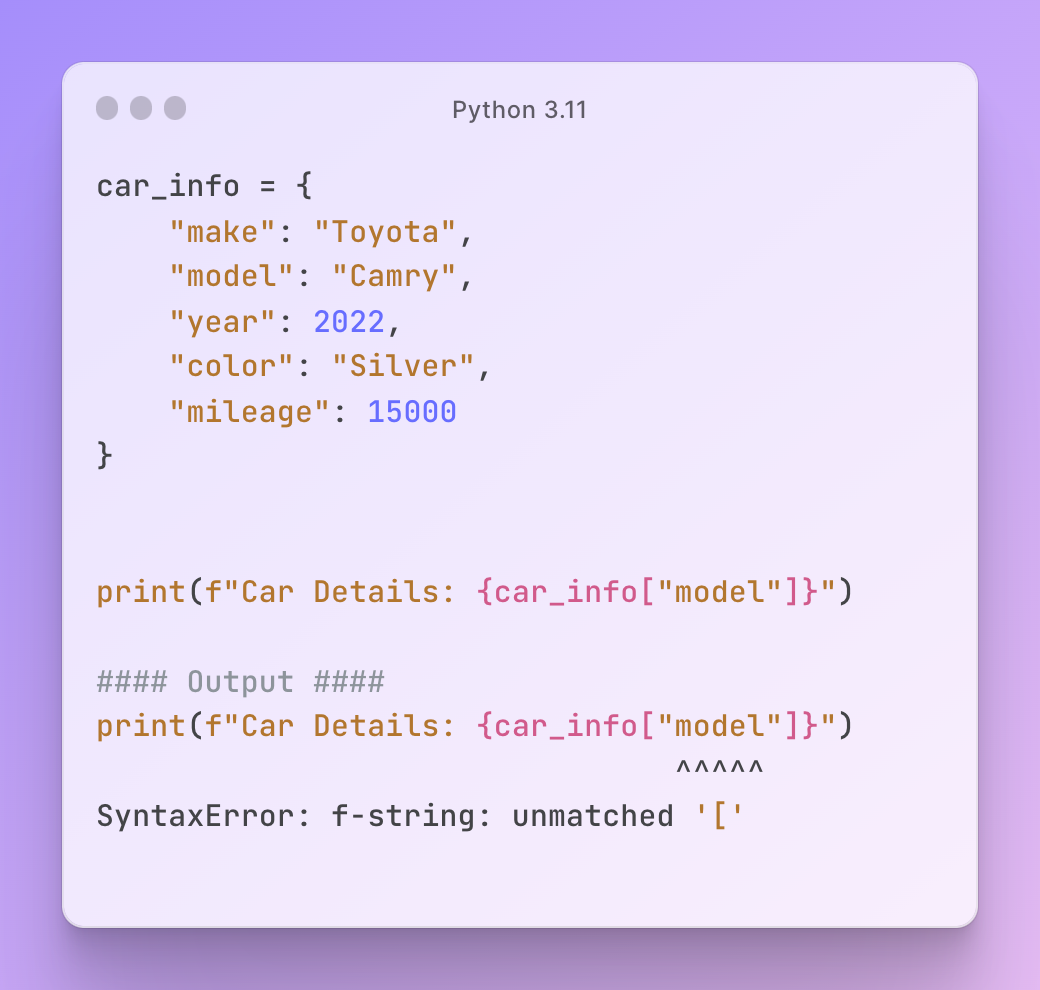
- Flexibility to use quotes
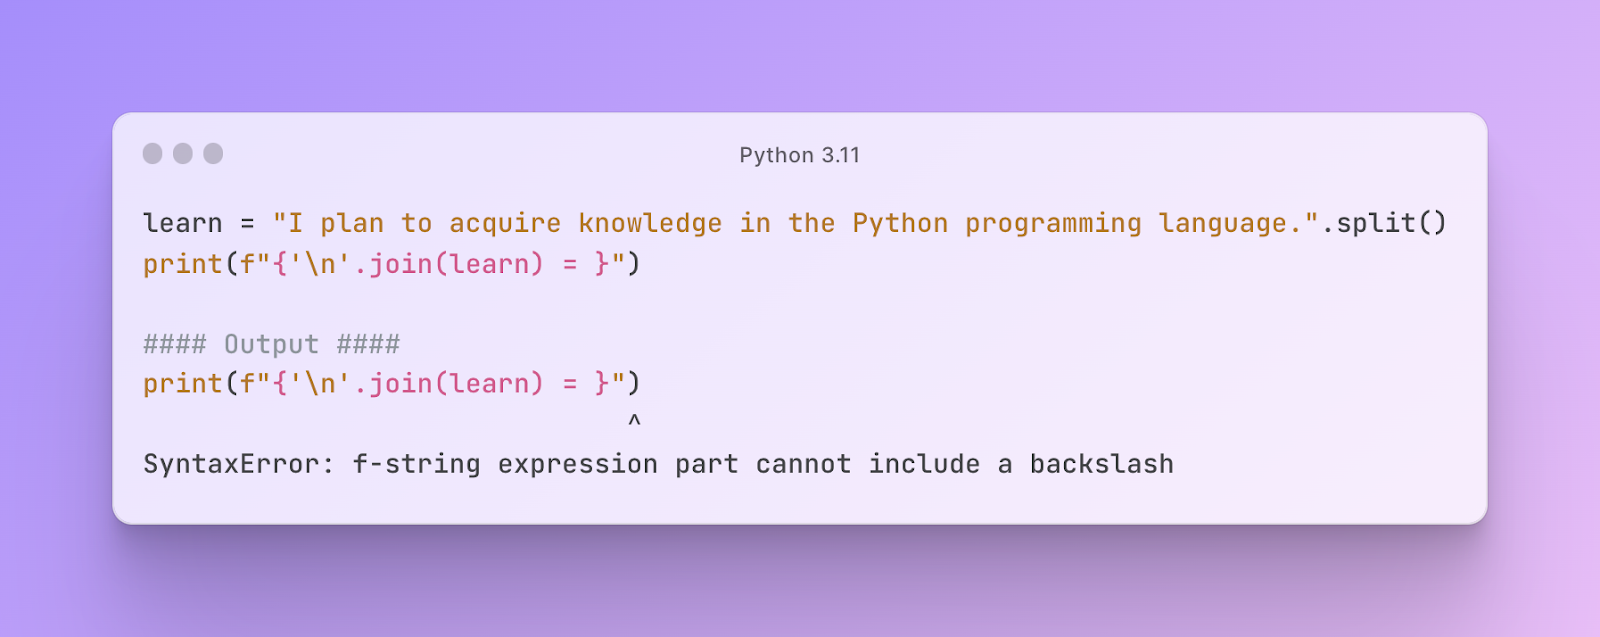
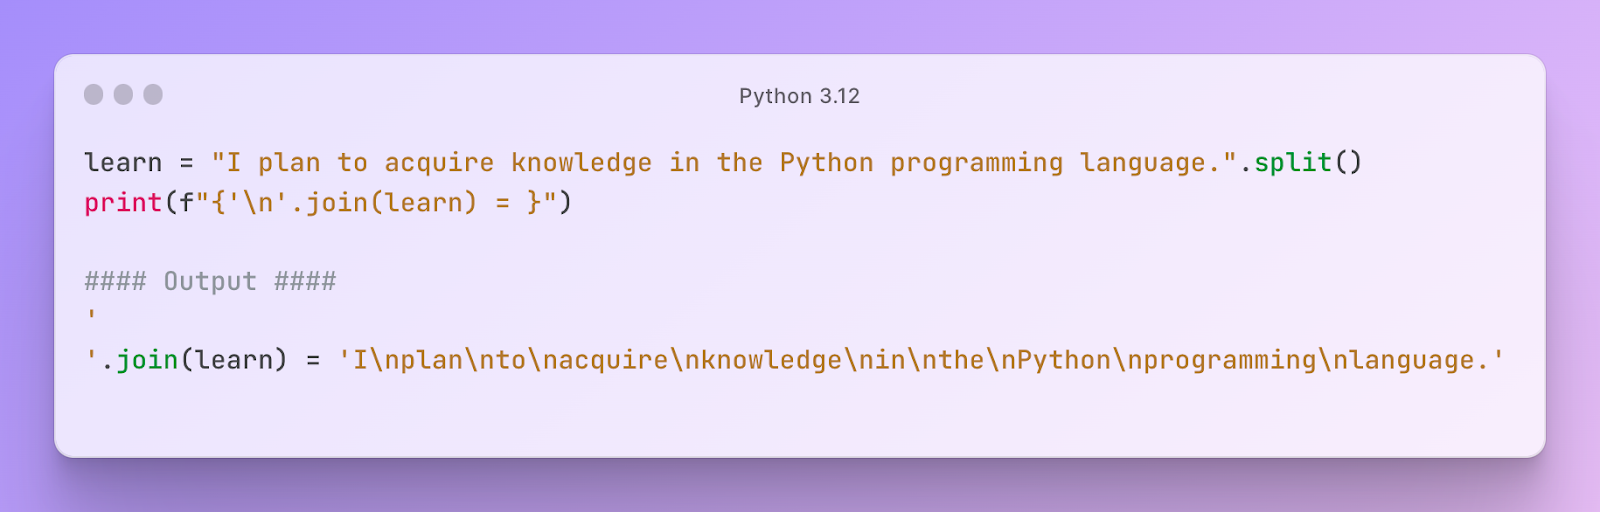
- Improved handling of backslashes
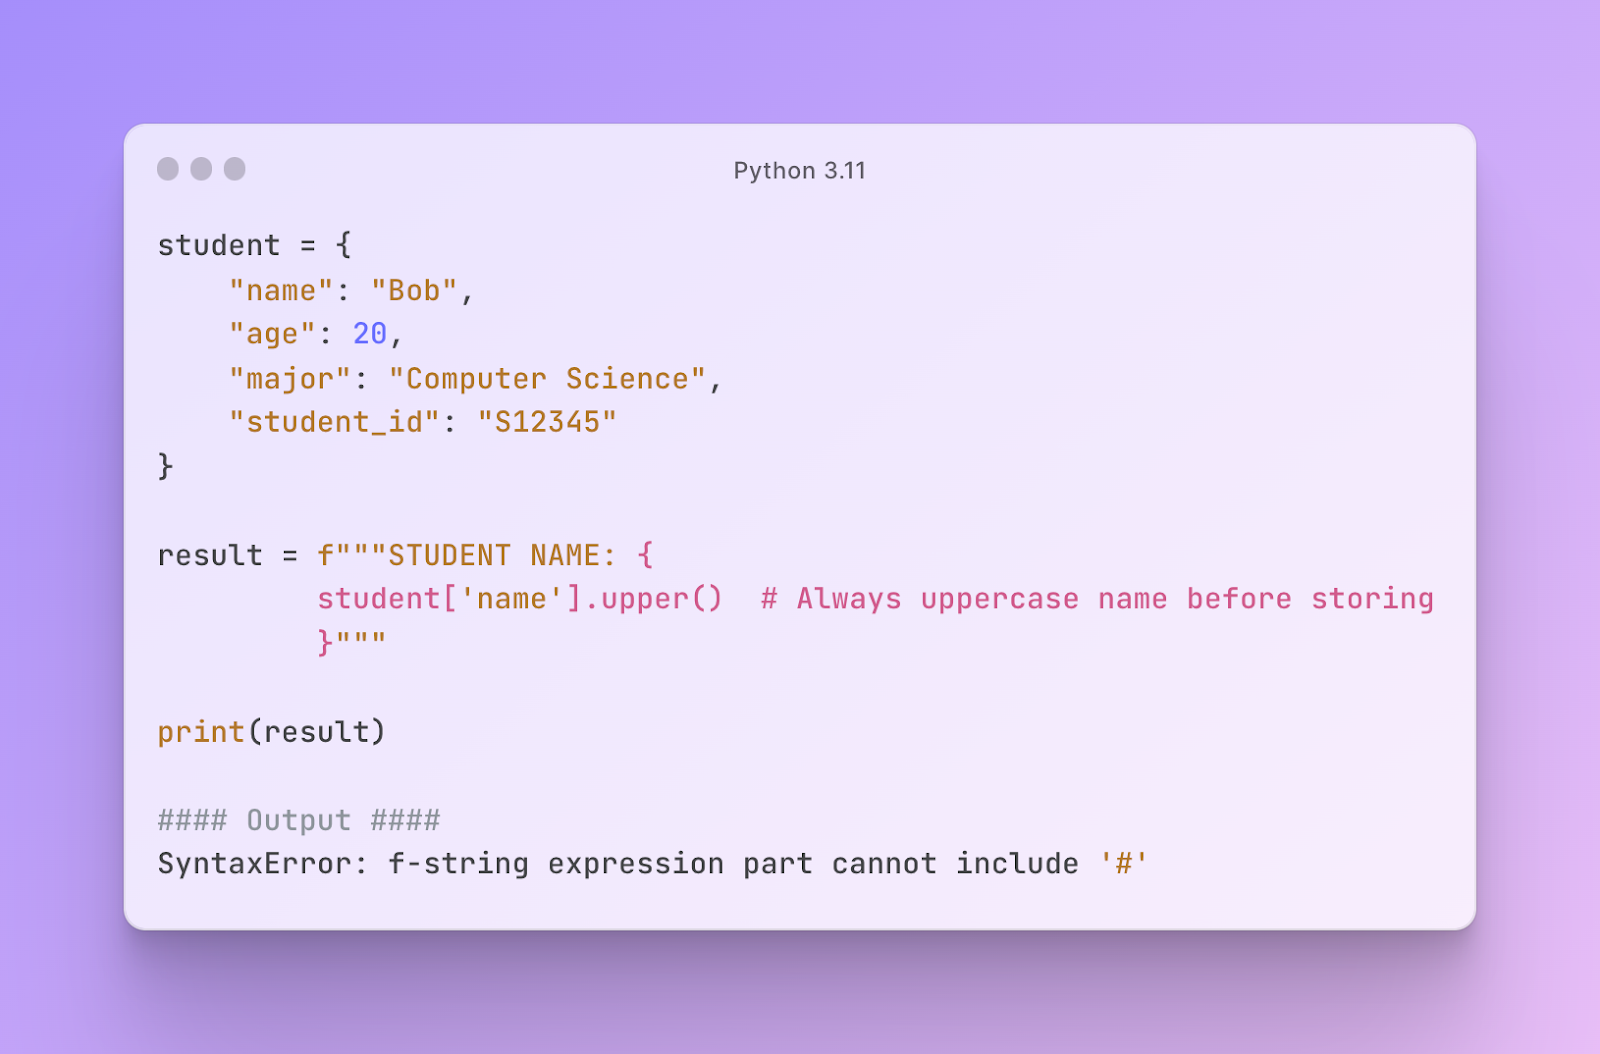
- Refined handling of comments
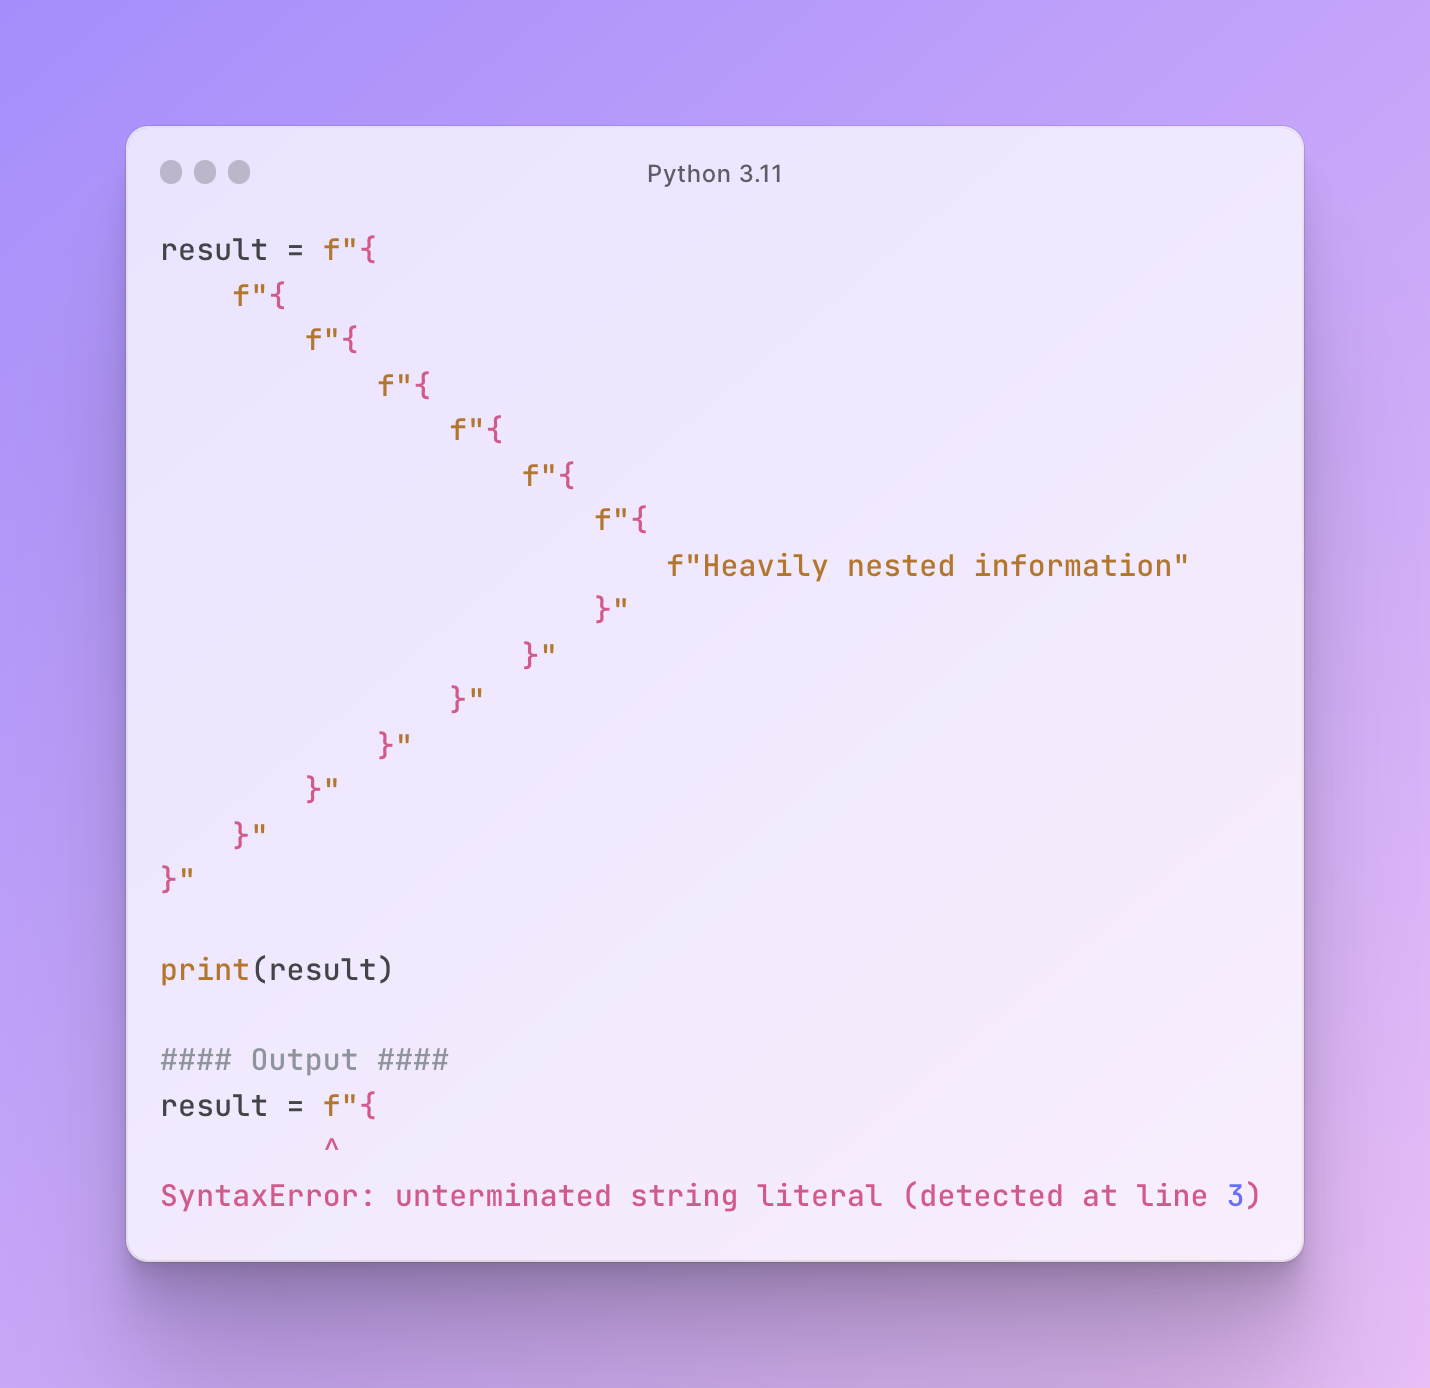
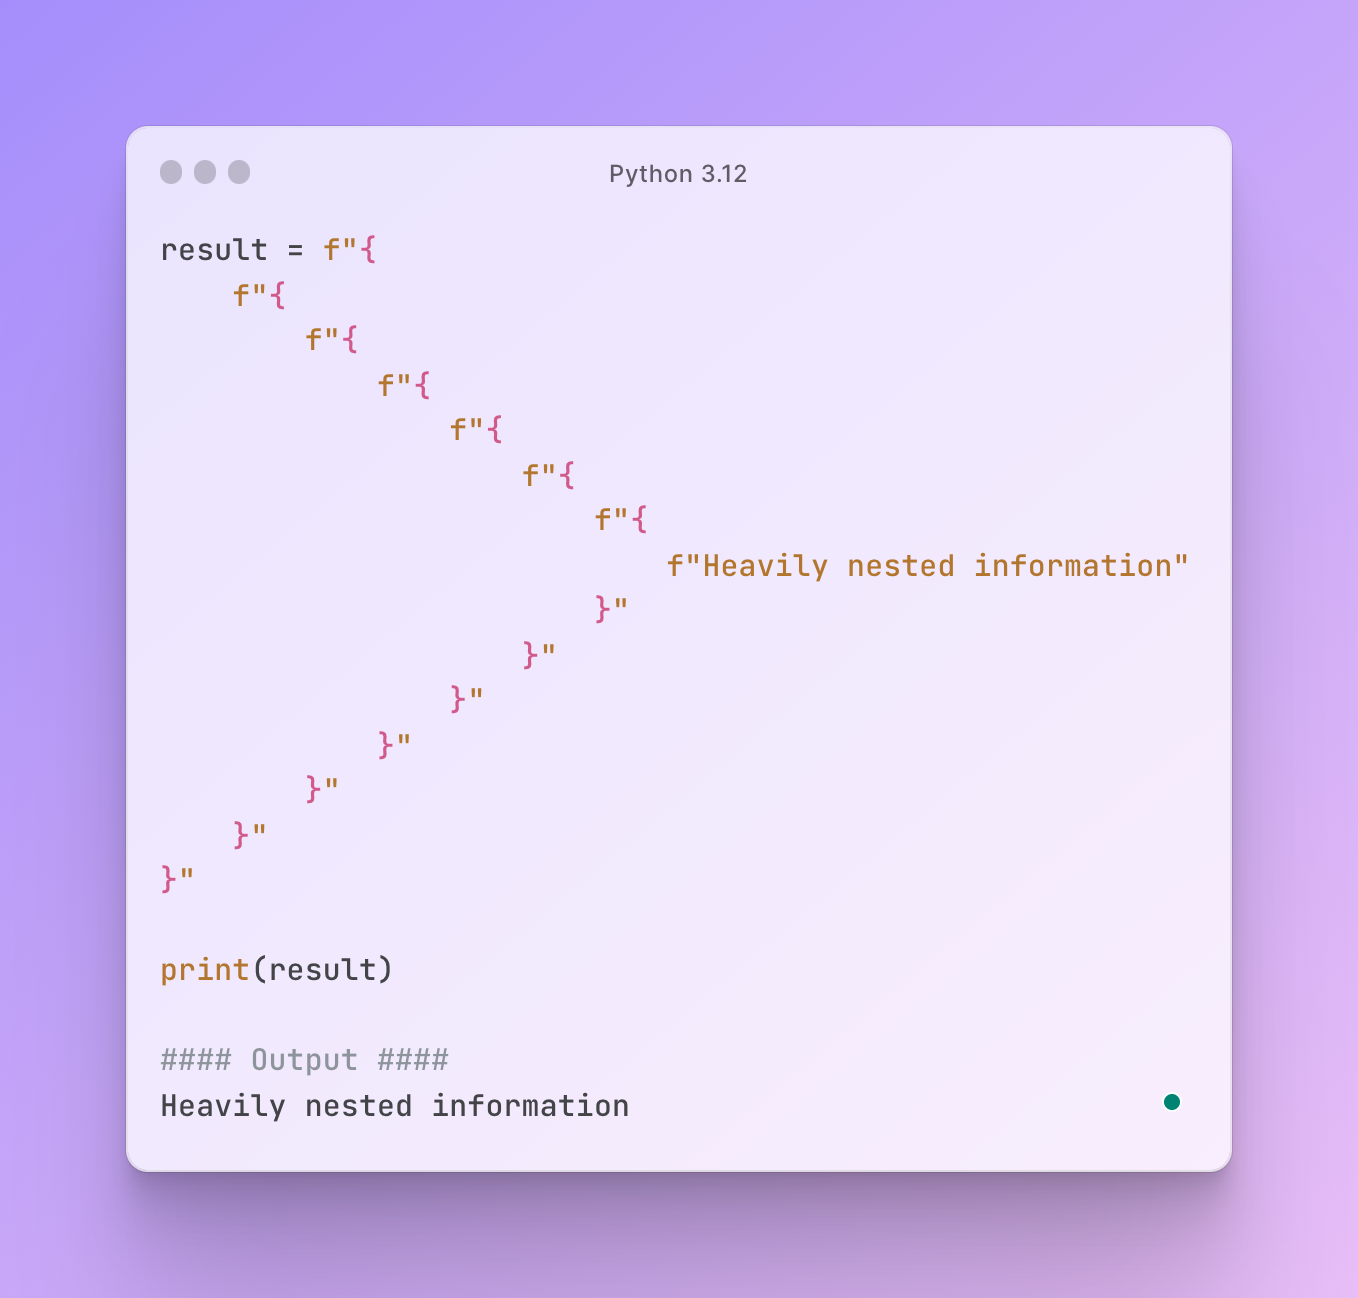
- Enhanced support for nested f-strings
Quotes
Quotes in Python 3.11
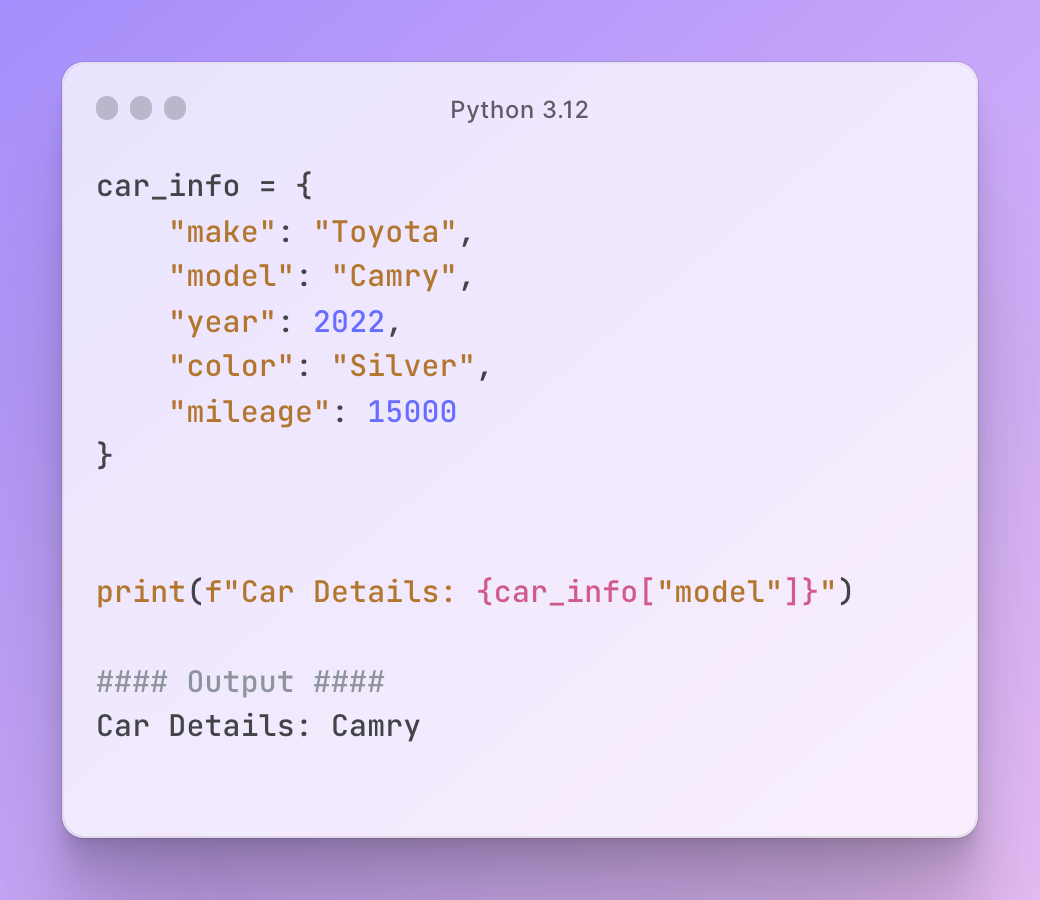
Quotes in Python 3.12
Backslashes
In Python 3.11
In Python 3.12
Nested
In Python 3.11
Comments
In Python 3.11
Error Messages
Python 3.12 has made significant enhancements in error messages compared to previous versions. While prior updates improved error messages, with the introduction of a PEG parser in Python 3.9 and “did you mean” semantics in Python 3.10, this release introduces further improvements:
- Added
stdlibas a source of places for “did you mean” - Class member “did you mean”
- Import from syntax error “did you mean”
- Import names “did you mean”
Another notable improvement is the increased intelligence of error messages when dealing with common developer mistakes. For example, the error message explicitly recommends the correct approach.
import a.y.z from b.y.z

Traceback (most recent call last):

  File "<stdin>", line 1

    import a.y.z from b.y.z

    ^^^^^^^^^^^^^^^^^^^^^^^

SyntaxError: Did you mean to use 'from ... import ...' instead?
Additionally, Python 3.12’s error messages are more astute in recognizing instances where you reference an object’s attribute but don’t include the self prefix.
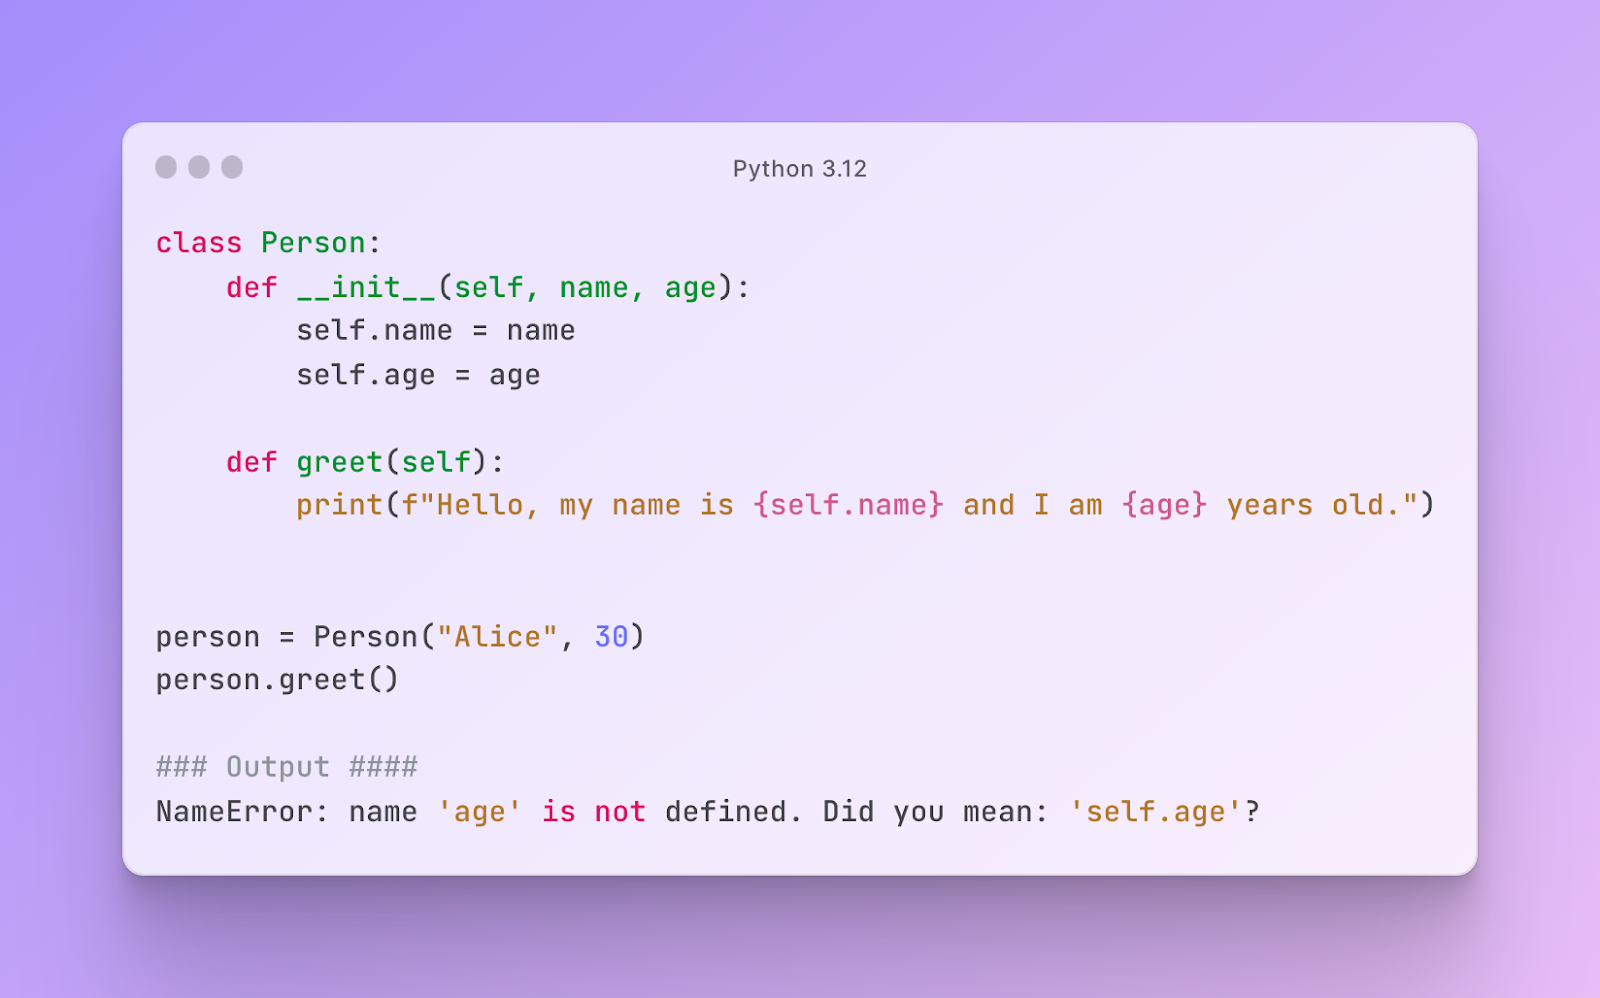
If you use PyCharm, you probably won’t see much of a change, since the IDE handled such errors and provided a quick-fix suggestion even before running a script.
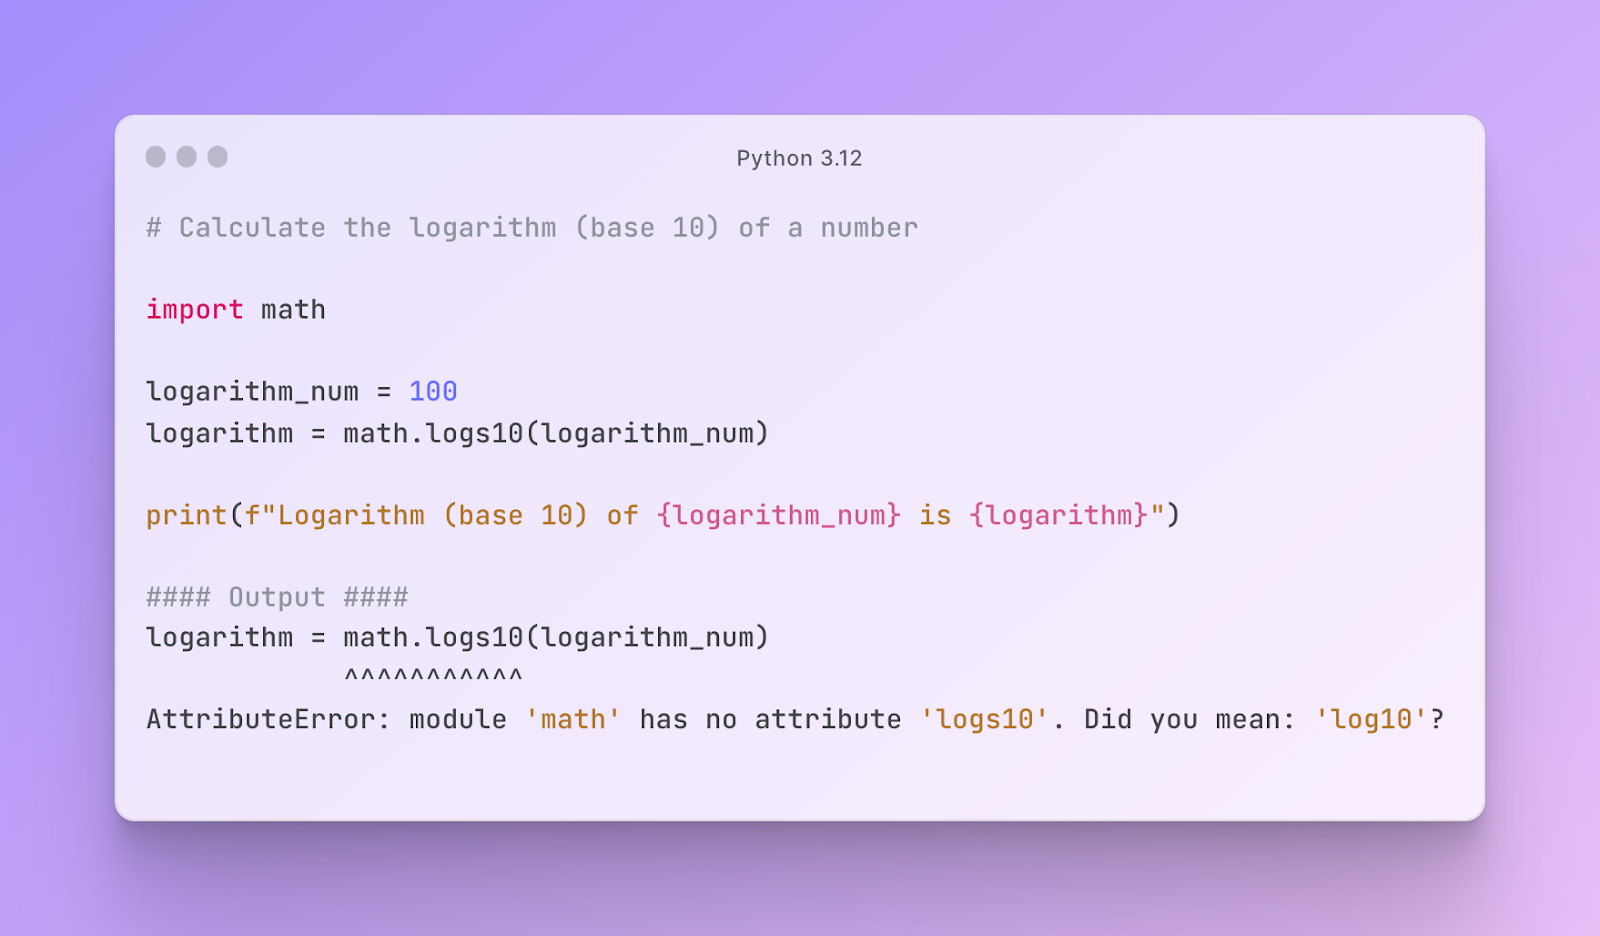
In the past, the check was limited to the built-ins, but it now includes support for the standard library.
Lastly, when you encounter an import error and receive an exception while trying to import something from a module, Python 3.12 automatically suggests potential corrections. These enhancements collectively contribute to a significantly improved coding experience in Python.
Improvements in Type Annotations
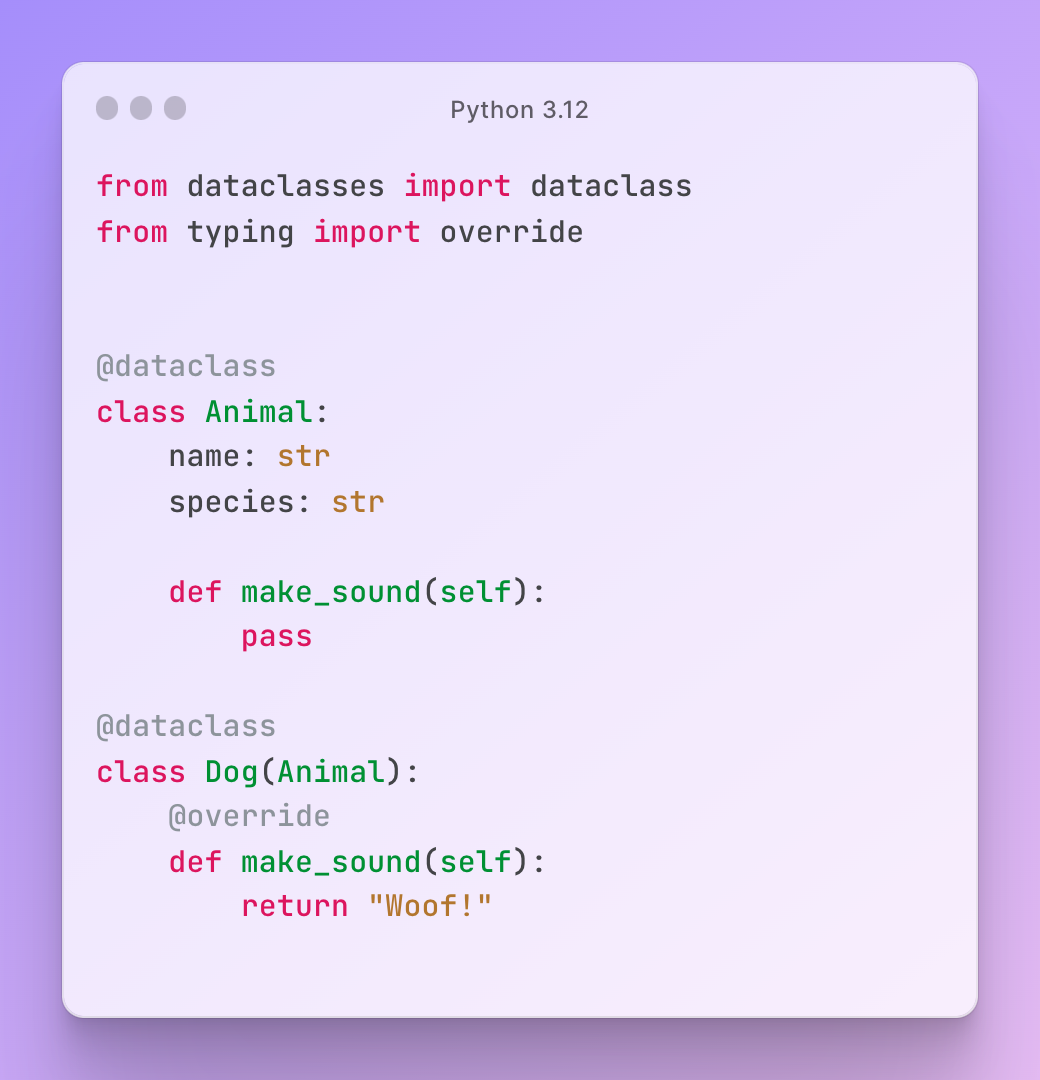
PEP 698 Override Decorator
In this PEP, the suggestion is to introduce an @override decorator to Python’s type system. This addition aims to empower type checkers to proactively identify and prevent a specific category of errors arising when a base class modifies methods inherited by its derived classes.
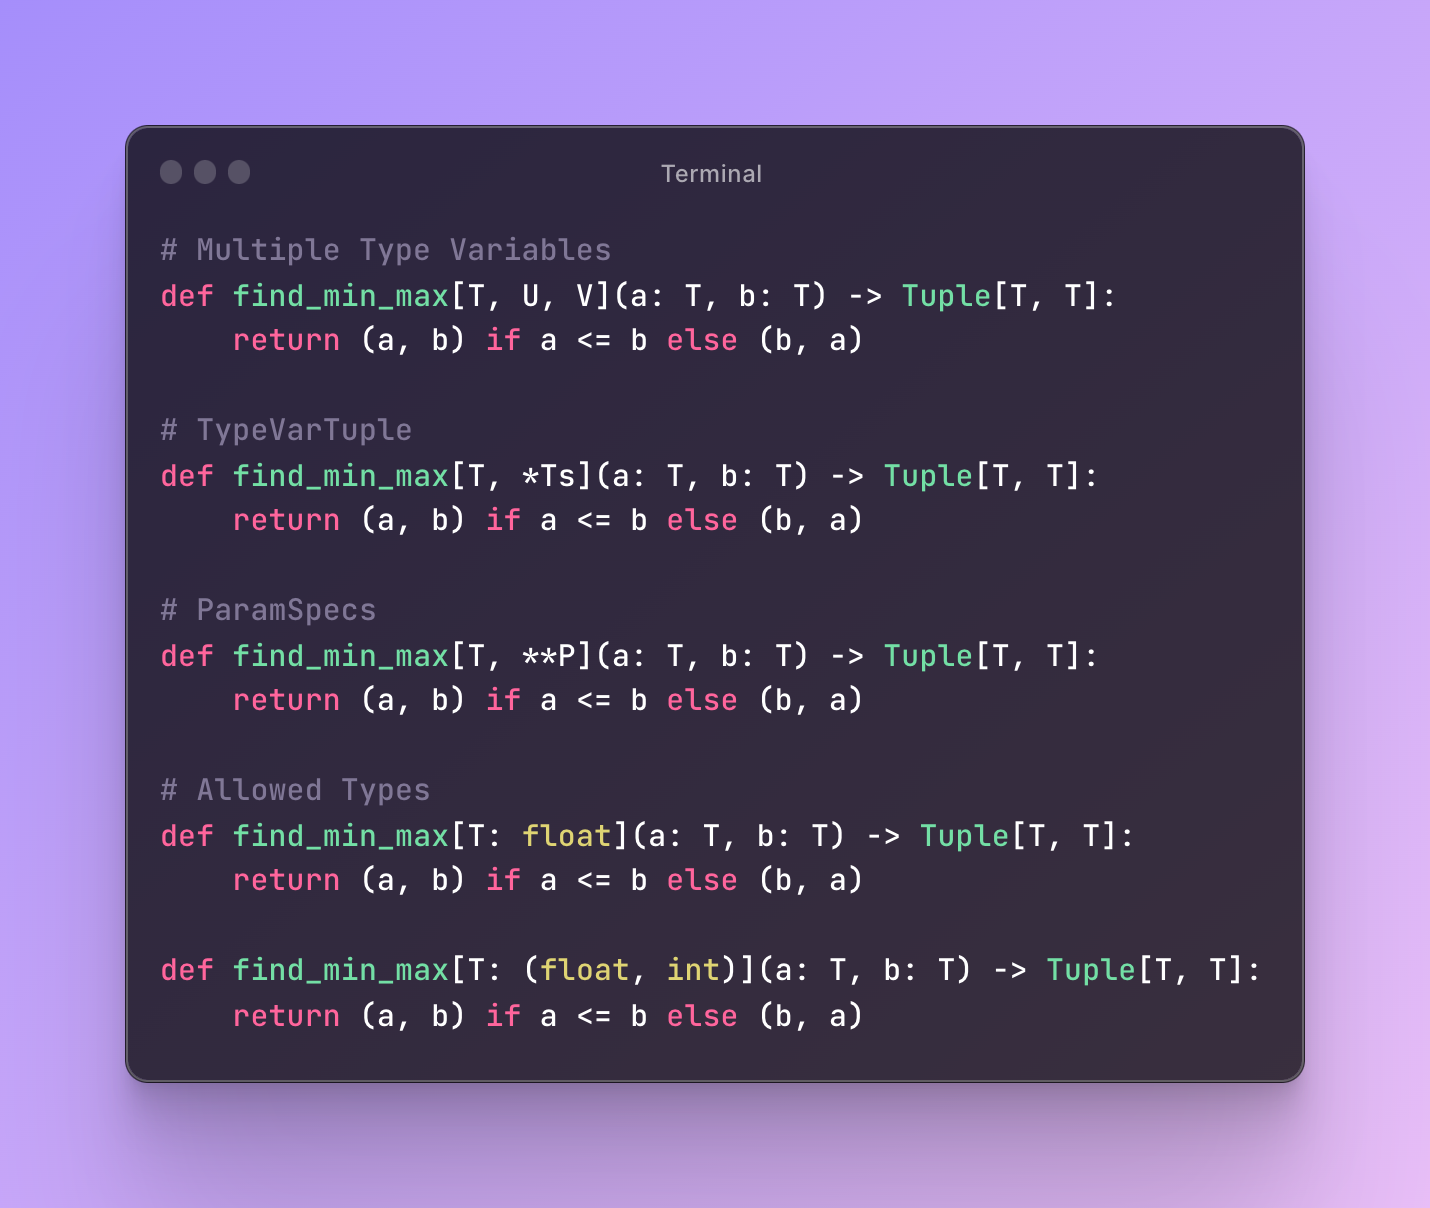
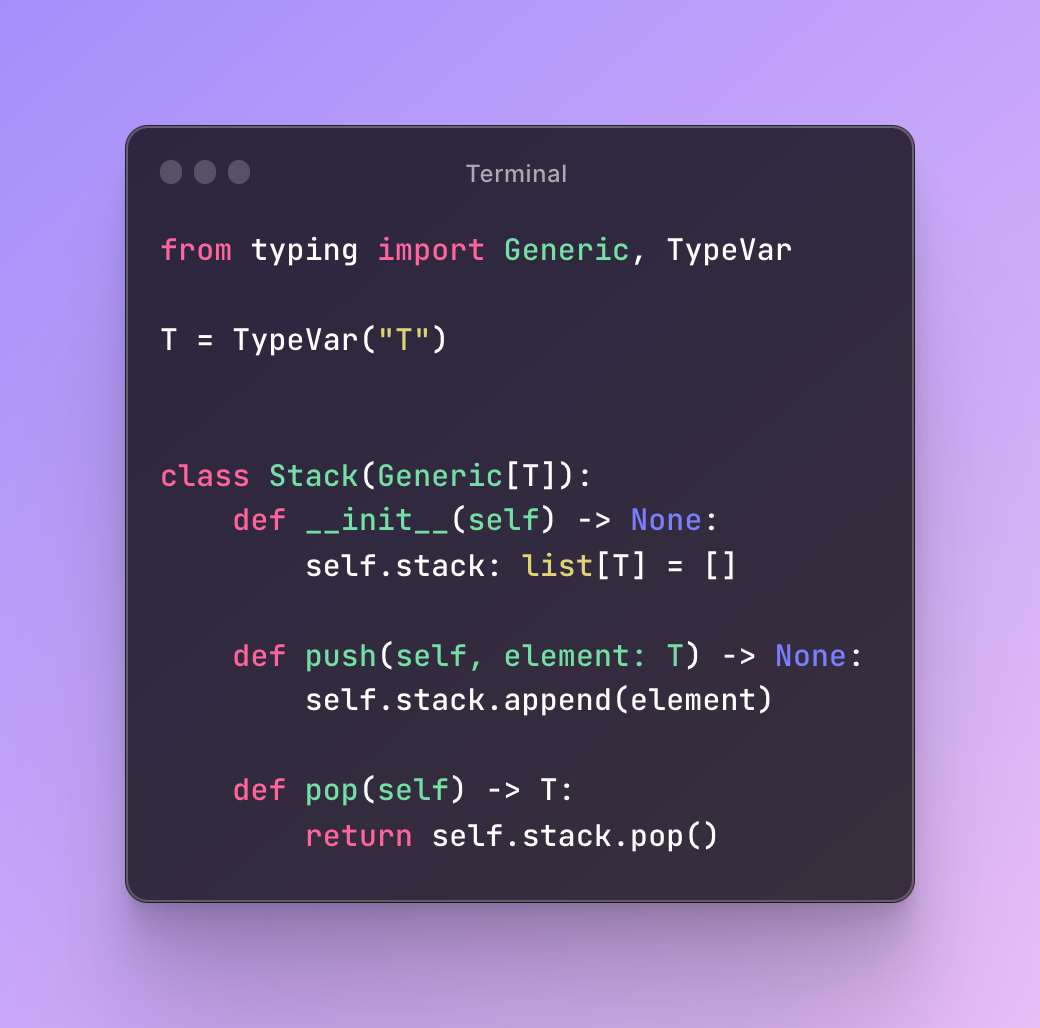
PEP 695 Generic Types
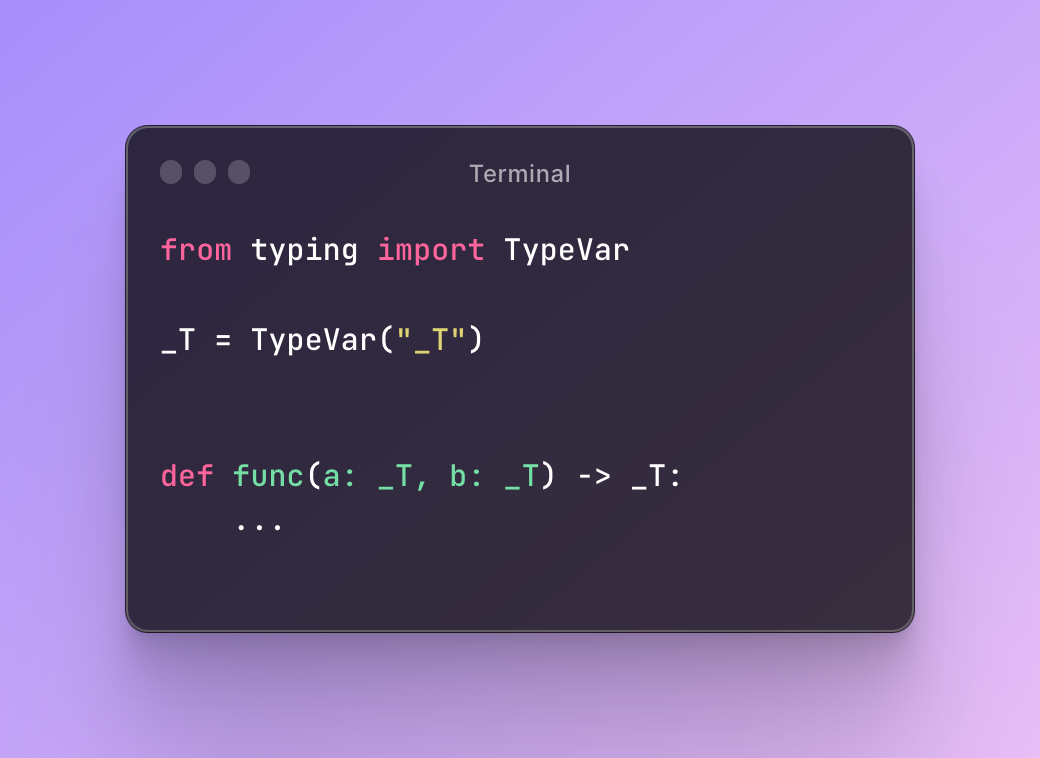
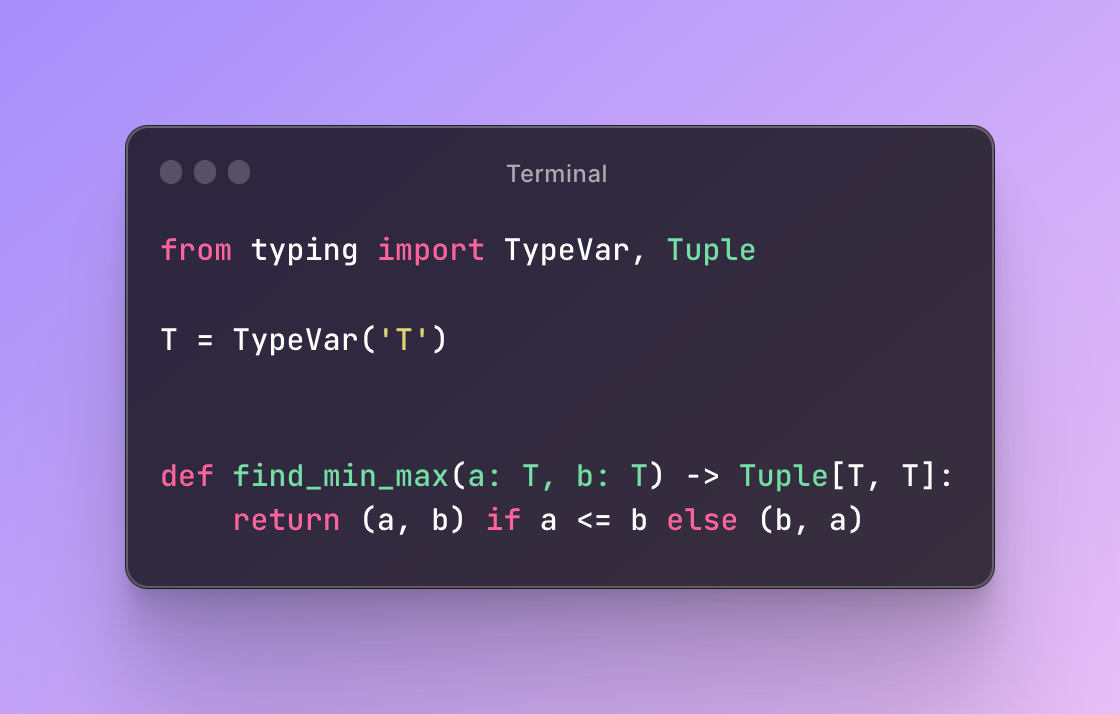
Previously, we used to define generics using TypeVar syntax. TypeVar is a feature of the Python type hinting system that allows you to create a placeholder for a type that will be specified later when a function or class is used. It is primarily used to indicate that a particular type can be of any type, providing flexibility and generic type annotations in Python.
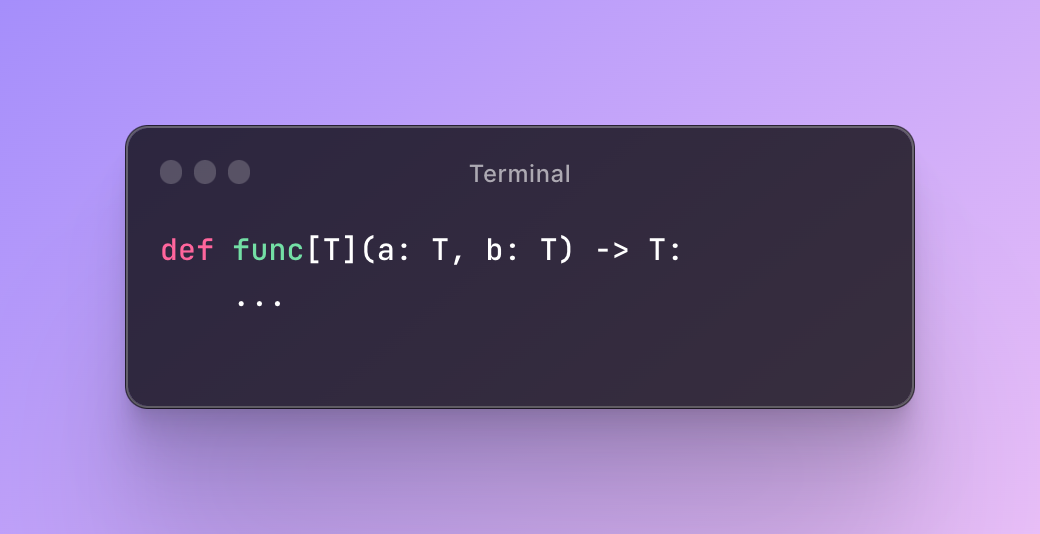
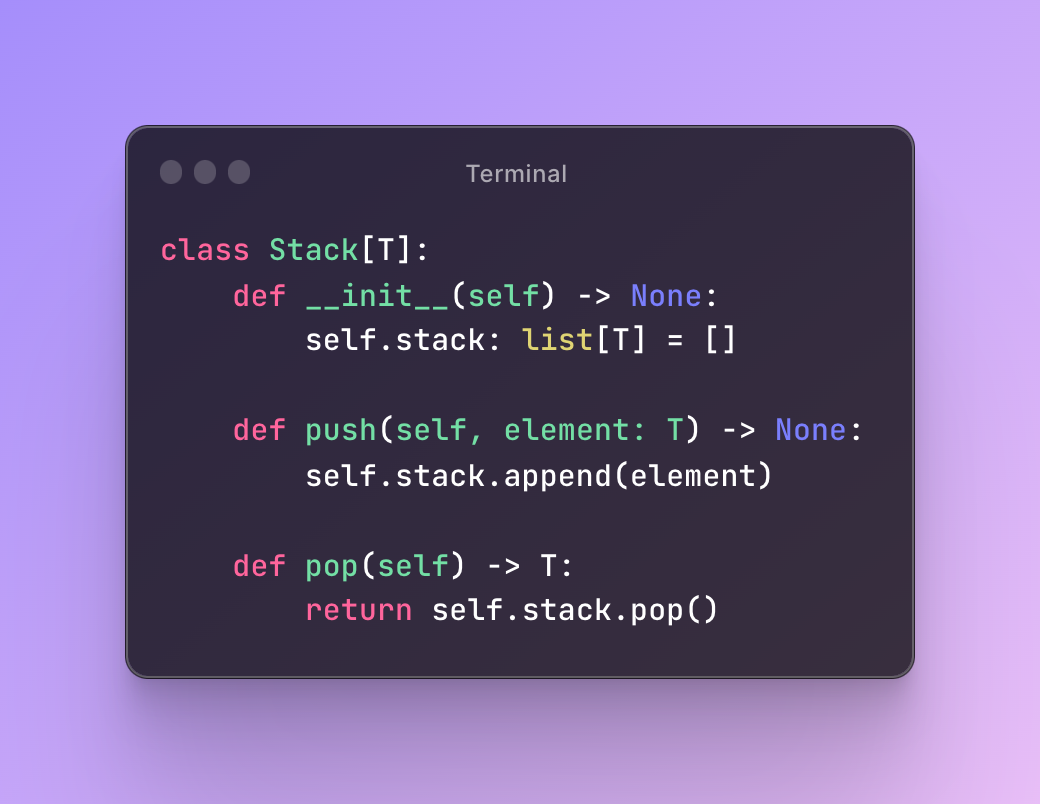
In Python 3.12, this has become much simpler.
You can also extend it to classes.
Previously we used TypeVar.
Now, in Python 3.12, it is not necessary:
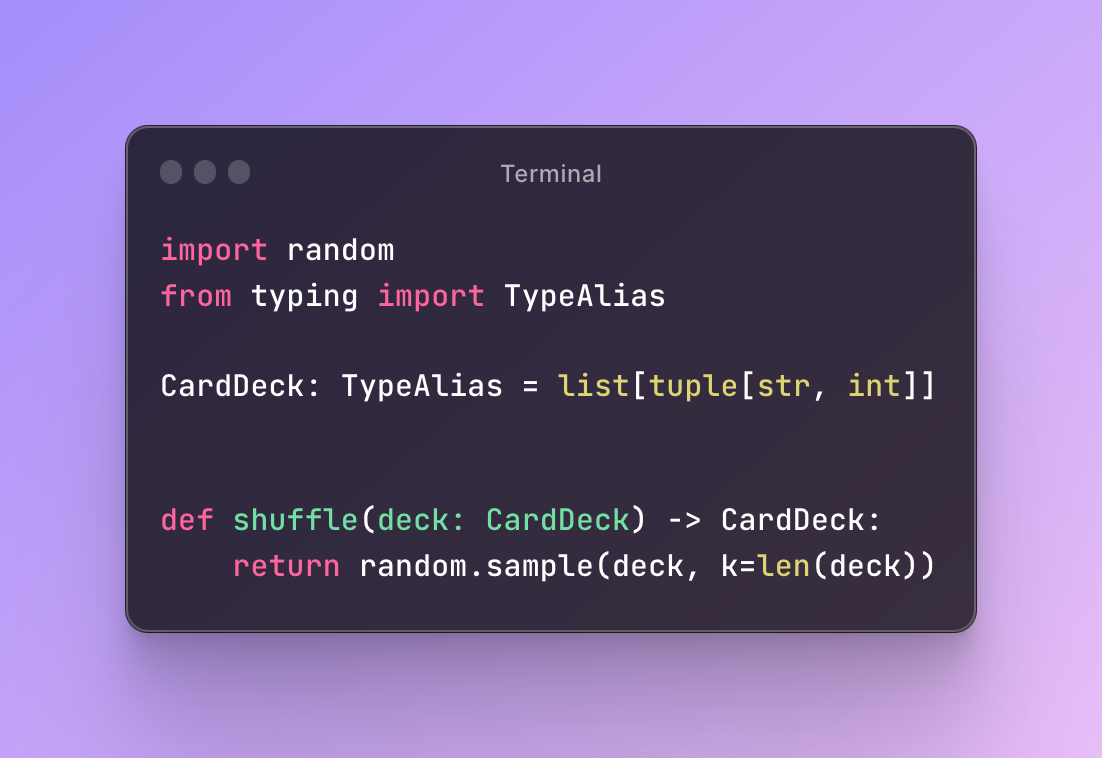
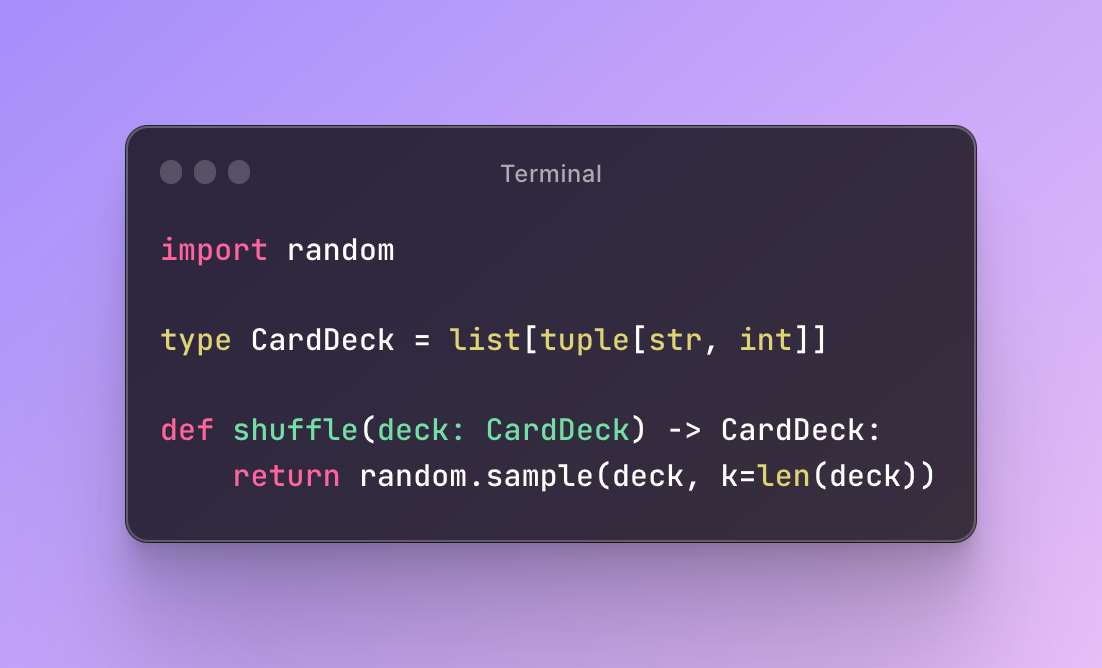
Use the type keyword to define your own aliases.
Previously, we used TypeAlias from the typing module.
Now, in Python 3.12
PEP 709 Comprehension Inlining
In the past, dictionary, list, and set comprehensions were defined using a mechanism that involved creating functions. Essentially, the contents of comprehension were compiled into a separate function, which was then instantiated and immediately executed. This process incurred some overhead because it required the creation of a function object and the establishment of a stack frame when the function was called.
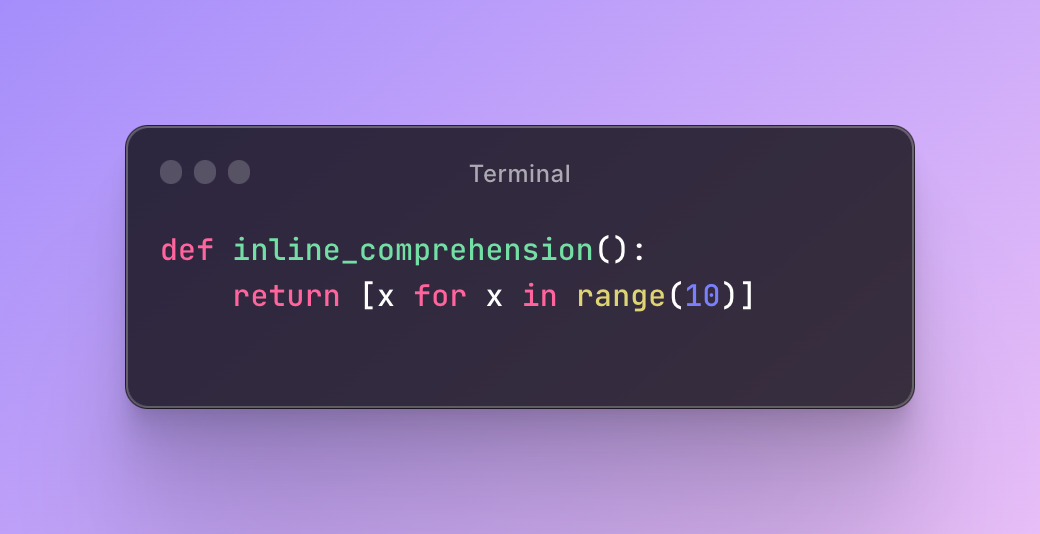
However, the implementation has been changed. Dictionary, list, and set comprehensions no longer rely on functions in the background. Instead, all comprehensions are now compiled directly within the context of the current function.
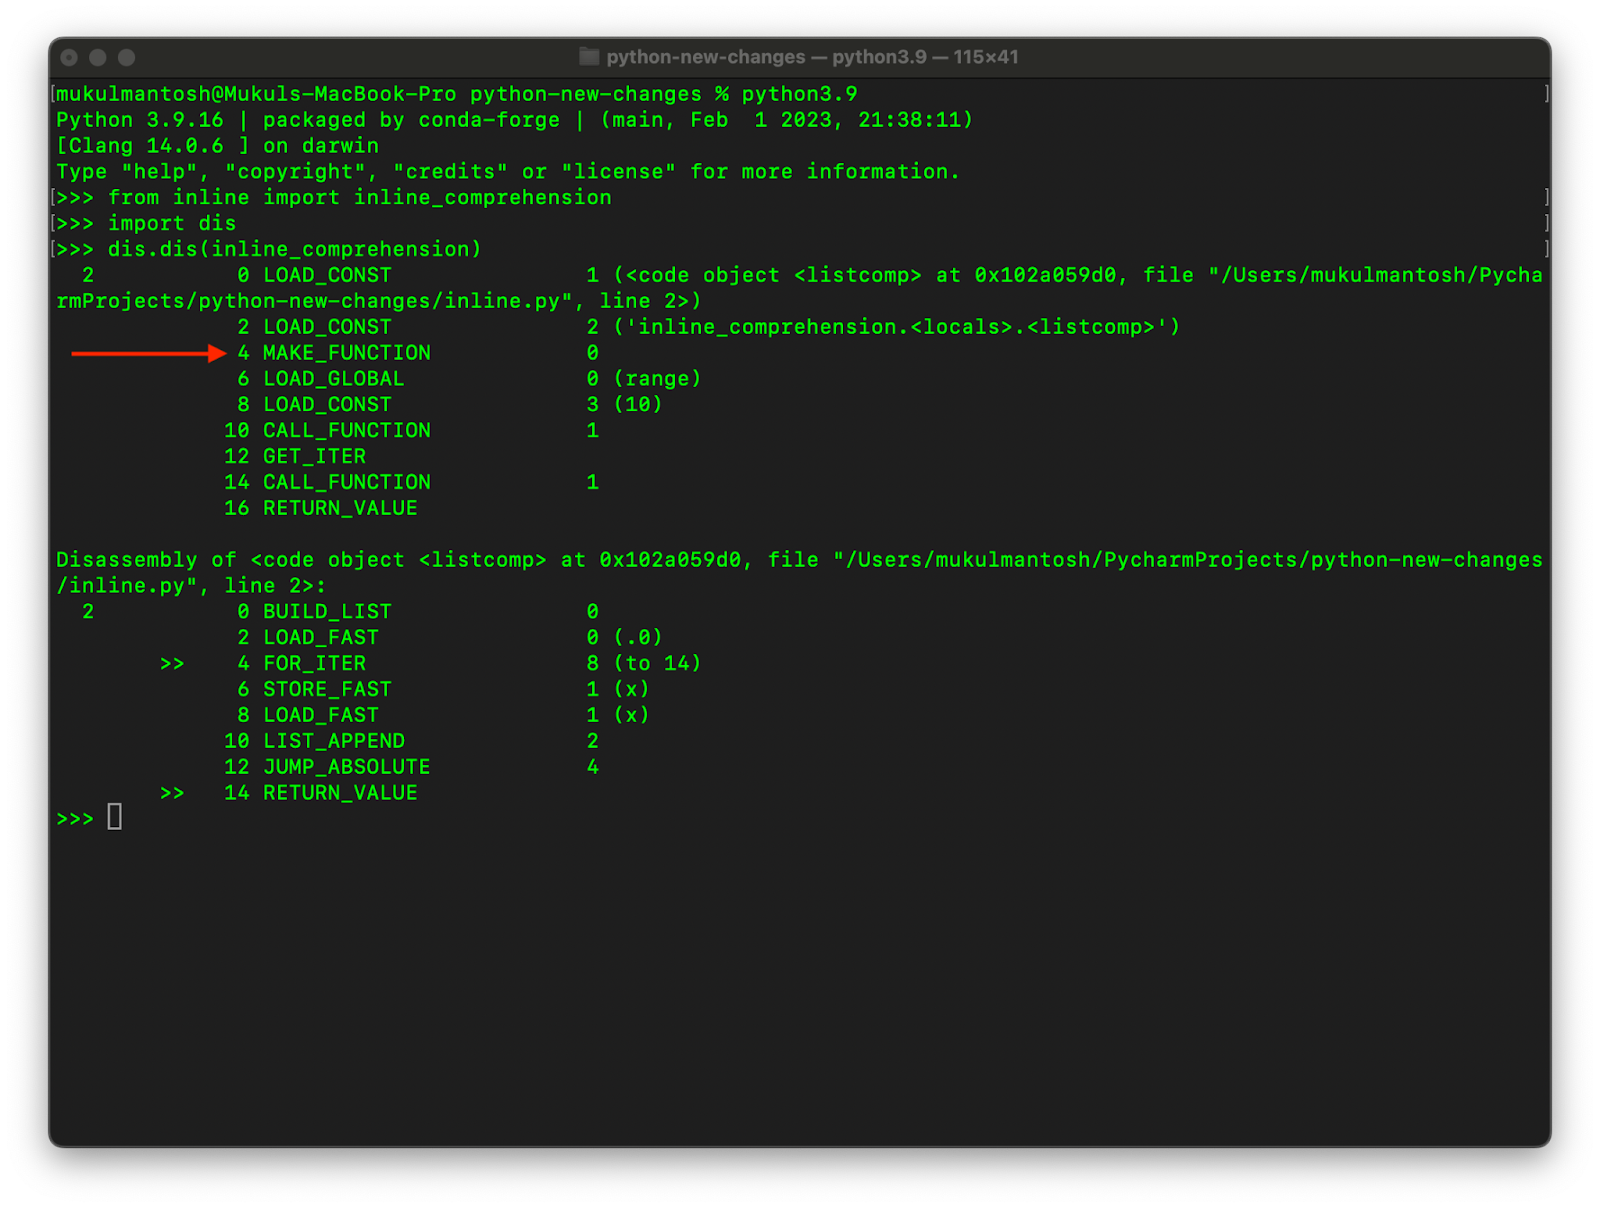
The comprehension’s bytecode is contained within an individual code object. Whenever inline_comprehension() is invoked, a new temporary function object is created via MAKE_FUNCTION, executed (resulting in the establishment and subsequent removal of a new frame on the Python stack), and promptly discarded.
Python 3.12
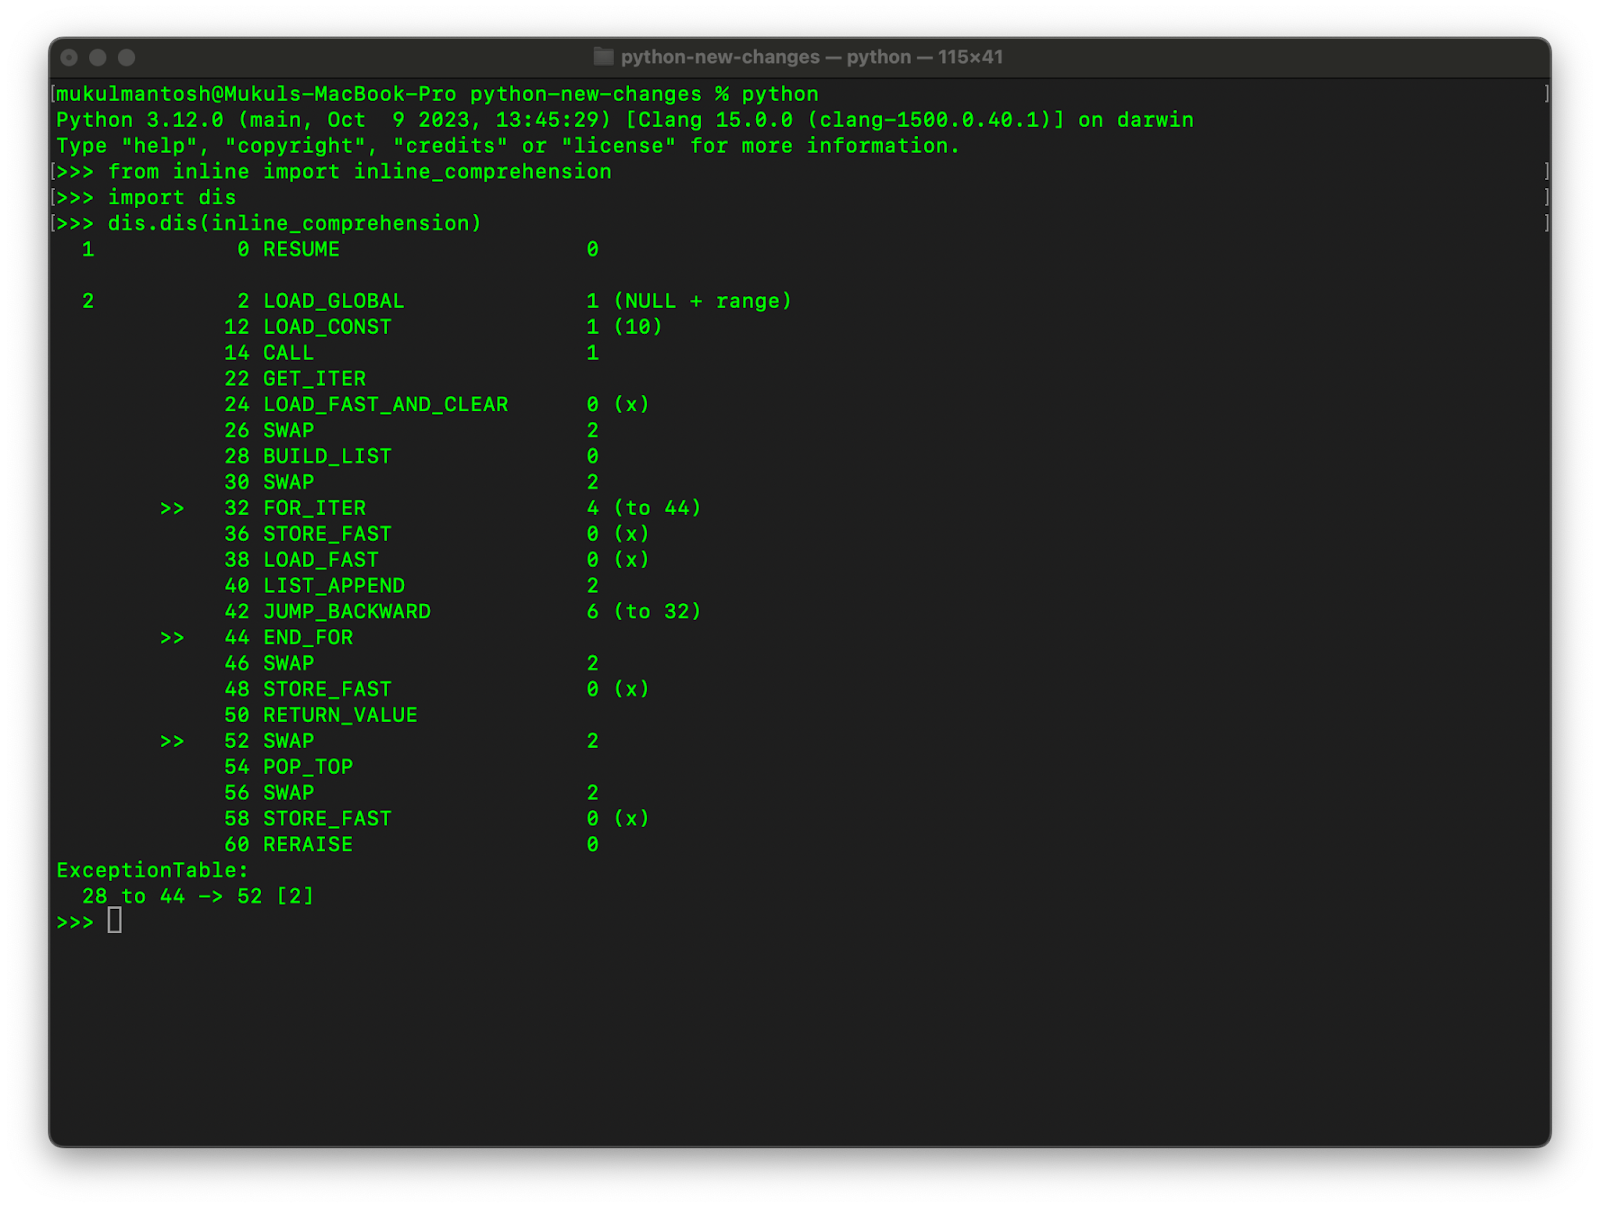
This alteration means that there is no longer a separate stack frame associated with the comprehension.
PEP 684 Per Interpreter GIL
If you’d like to learn more about the Global Interpreter Lock (GIL), watch this video where Guido discusses the Global Interpreter Lock and subinterpreters.
Python operates as an interpreted language, setting it apart from compiled languages that employ compilers to convert code into machine language. In contrast, Python reads and executes instructions directly within its interpreter. Performance enhancements in Python releases often translate to improvements in the CPython interpreter.
When you execute a Python program using CPython, it creates an interpreter instance. The initial instance is called the main interpreter and it is capable of generating subinterpreters. Most aspects of subinterpreters are distinct from one another, but not entirely. This subinterpreter concept isn’t new and has existed since Python 1.5, although it typically operates beneath the language’s surface.
Handling parallel execution can be tricky, especially when multiple processes attempt to modify a single value simultaneously, leading to consistency issues. Python employs the Global Interpreter Lock to mitigate such problems, but it’s been a source of frustration for developers seeking to write parallel code.
interp = interpreters.create()

print('before')

interp.run('print("during")')

print('after')
Efforts are underway to minimize the GIL’s impact and potentially eliminate it.
PEP 684 and PEP 554 impact the structure of subinterpreters. PEP 684 relocates the GIL from the global level to a subinterpreter level, while PEP 554 is focused on enabling the fundamental capability of multiple interpreters, isolated from each other, in the same Python process.
It’s crucial to understand that these adjustments are largely behind the scenes, and Python users will not encounter them directly until Python 3.13 is released.
To learn more about PEP 684, visit https://peps.python.org/pep-0684/
PEP 669 Low Impact Monitoring
PyCharm has added initial support for debugging based on PEP 669, improving overall debugger performance and making functionality such as tracing of raised exceptions and dropping into the debugger on a failed test almost penalty-less compared with the old sys.settrace based approach.
Credits: mCoding
import sys

def my_trace_call(code, instruction_offset, call, arg0):

   print("Event: call")

def my_trace_line(code, line_number):

   print("Event: line")

def setup_monitoring():

   mo = sys.monitoring

   events = mo.events

   mo.use_tool_id(0, "my_debugger")

   mo.set_events(0, events.CALL | events.LINE)

   mo.register_callback(0, events.CALL, my_trace_call)

   mo.register_callback(0, events.LINE, my_trace_line)

def main():

   for x in range(5):

       print(x)

if __name__ == "__main__":

   setup_monitoring()

   main()
In the past, Python debuggers used sys.settrace, which offered essentially the same functionality but in a less efficient manner. The new sys.monitoring namespace introduces a streamlined API for event registration, and its implementation details enable it to leverage the ongoing efforts to specialize instructions at runtime.
To know more about PEP 669 https://peps.python.org/pep-0669/
PEP 683 Immortal Objects
Meta, the company behind Instagram, utilizes Python (Django) for its front-end server. They implement a multi-process architecture with asyncio to handle parallelism. However, the high scale of operations and request volume can lead to memory inefficiency issues. To address this, they employ a pre-fork web server architecture to cache objects in shared memory, reducing private memory usage.
Upon closer examination, they found that the private memory of processes increased over time, while shared memory decreased. This issue was caused by Python objects, which although mostly immutable, still underwent modifications through reference counts and garbage collection (GC) operations, triggering a copy-on-write mechanism in server processes.
To resolve this problem, they introduced Immortal Objects (PEP-683), marking objects as truly immutable. This approach ensures that the reference count and GC header remain unchanged, reducing memory overhead.
To learn more about Immortal Objects, read the Meta Engineering Blog https://engineering.fb.com/2023/08/15/developer-tools/immortal-objects-for-python-instagram-meta/
Linux Perf Profiler
A profiler serves as a valuable instrument for observing and diagnosing the efficiency of your scripts and programs. Profiling your code allows you to obtain precise measurements, which can be utilized to refine your implementation.
Python has a history of supporting profiling through standard library tools such as timeit, cProfile, and memray from Bloomberg. Furthermore, there are third-party alternatives that provide more functionality.
Linux perf is a profiling and performance analysis tool that is integrated into the Linux kernel. It provides a wide range of features and capabilities for monitoring and analyzing the performance of a Linux system. Linux perf is a powerful utility that allows you to collect and analyze data on various aspects of system behavior, such as CPU utilization, memory usage, hardware events, and more. Some of its key features include:
1. CPU Profiling: Linux perf can be used to profile CPU usage, helping you identify hotspots in your code and understand how CPU time is distributed among different processes and functions.
2. Hardware Events: It can collect data on hardware events like cache misses, branch mispredictions, and instruction counts, which is valuable for optimizing code and understanding the impact of hardware on performance.
3. System-wide Profiling: Linux perf can capture system-wide data, enabling you to analyze the performance of all running processes and system components simultaneously.
4. Kernel Profiling: You can use Linux perf to analyze the performance of the Linux kernel itself, helping you pinpoint kernel-level bottlenecks and issues.
5. Tracing: It supports dynamic tracing of kernel and user-space events, allowing you to trace the execution of specific programs or system calls.
6. Performance Counters: Linux perf can access the performance monitoring counters available in modern CPUs, providing detailed information about processor behavior.
Linux perf is a versatile tool that is commonly used by developers, system administrators, and performance analysts to optimize software and diagnose performance problems on Linux systems. It provides a wealth of information that can help improve the efficiency and performance of applications and the overall system.
This article, authored by Peter McConnell, explores the use of performance engineering with Python 3.12. It begins by introducing the Linux perf tool and the FlameGraph visualization tool. The goal is to reduce the runtime of a Python script from 36 seconds to 0.8 seconds, emphasizing the importance of Python 3.12’s performance profiling support.
The article explores the use of environment variables to enable perf support and repeats the profiling process with Python 3.12, generating an improved FlameGraph. The source code responsible for the performance issue is examined.
Summary
Python 3.12 comes with a bunch of welcome ergonomics improvements. Declaring generic classes, functions, and type aliases for type hinting is now as straightforward as in many statically typed languages with first-class syntactic support provided by PEP 695. Already universally loved f-strings are now even easier to use thanks to former grammar restrictions, such as preventing re-using quotes and including escape sequences inside them, being lifted in PEP 701. Low overhead debugging features make using a debugger by default for all development tasks a no-brainer. Apart from that, there are new typing features, various performance improvements, and new standard library APIs.
Explore the capabilities of Python 3.12 with PyCharm 2023.3, now available in the Early Access Program (EAP). This version introduces a swifter debugging experience and enhanced code assistance tailored to Python 3.12’s new typing features. Unlock the potential of the new language features with the tool designed for it.
Learn more about Python 3.12 Support in PyCharm: https://blog.jetbrains.com/pycharm/2023/10/2023-3-eap-2/.
For a detailed exploration of additional features, please refer to the official documentation at https://docs.python.org/3/whatsnew/3.12.html.