New Low-Impact Monitoring API in Python 3.12

People love PyCharm’s debugger, and we work hard to make it both fast and easy to use. But what if it could be even faster and easier to use?
Python 3.12 adds the new low-impact monitoring API described in PEP 669, enabling debuggers, profilers, and similar tools to run code at almost full speed. As we show below, this can lead to an up to 20 times performance increase compared to the old API.
Previously, we had to turn two useful debugger features – Stop on raised exceptions and Drop into debugger on failed tests – off by default. With PEP 669, PyCharm can now do this and more.
Let’s take a look under the hood.
General debugging framework
No matter what programming language you use, to be able to debug a program, the language runtime should provide the means to react to events, such as calling a function, moving to the next line, raising an exception, etc. This is usually achieved by defining callbacks, which the runtime invokes when an event occurs.
The callback invoked in response to an event gets access to the program’s state at the current execution point and reports this state back to the user. A state consists of the current function name, variables defined in the current scope and their values, information about a raised exception, etc.
Here are examples of runtimes and the facilities that enable us to debug a program:
ptrace(Linux)sys.settraceandsys.monitoring(Python)set_trace_func(Ruby)- CPU interruptions.
This article focuses on the Python debugging facilities and how the new event-monitoring-based API, introduced in PEP 669, resolves many issues in the old trace-function-based approach.
To better understand why the changes from PEP 669 are so important, let’s get a quick “refresher” on the old approach.
Old tracing function API
For decades, the sys.settrace(tracefunc) function has been the default way of implementing Python debuggers.
This function takes another function, tracefunc, as a parameter and sets it as a global trace function. The Python interpreter invokes this global callback each time a function is called.
The tracefunc function has three arguments: frame, event, and arg.
The frame object encapsulates information about the currently running function and provides access to the function name, the Python module this function is defined in, local and global variables available inside it, etc.
event is always a “call” for the global trace function.
Finally, the arg can be anything depending on the event type, but for “call”, it is always None.
To put the above into action, let’s write a simple debugger that prints a report about every function call to stdout.
import os.path
import sys

def trace_call(frame, event, arg):
   print("calling {} in {} at line {:d}".format(
       frame.f_code.co_name,
       os.path.basename(frame.f_code.co_filename),
       frame.f_lineno))

def f():
   pass

def g():
   f()

def h():
   g()

if __name__ == '__main__':
   sys.settrace(trace_call)
   h()
This simple debugger sets up a global trace function and runs some code. It also demonstrates access to the code object that, in turn, contains information about the function name and the name of the file where it is defined.
Running this script produces the following output:
calling h in trace_function_calls.py at line 20
calling g in trace_function_calls.py at line 16
calling f in trace_function_calls.py at line 12
Now, the trace-function-based API defines the following contract: if a global trace function returns another function, this function will be used for tracing the current scope. The local trace function will not be limited by “call” events but will receive the “line”, “exception”, “return”, and “opcode” events.
Let’s modify the previous example to trace not only function calls but also lines:
import os.path
import sys

def trace_call(frame, event, arg):
   print("calling {} in {} at line {:d}".format(
       frame.f_code.co_name,
       os.path.basename(frame.f_code.co_filename),
       frame.f_lineno))
   return trace_local_events

def trace_local_events(frame, event, arg):
   if event == "line":
       print("line {} in {}".format(
           frame.f_lineno,
           frame.f_code.co_name
       ))

def f():
   pass

def g():
   f()

def h():
   g()

if __name__ == '__main__':
   sys.settrace(trace_call)
   h()
It produces the following output:
calling h in trace_calls_and_lines.py at line 29
line 30 in h
calling g in trace_calls_and_lines.py at line 25
line 26 in g
calling f in trace_calls_and_lines.py at line 21
line 22 in f
This is how individual event tracing is achieved in Python. Since tracing functions can implement arbitrary logic, they can be used for reporting information about the program state to an IDE, stdout, etc. The information itself can be extracted from the frame argument of a trace function.
Disadvantages of trace-function-based debugging
If you look carefully at the sys.settrace API, you will notice a small issue with it that can have huge consequences for performance. Recall that as soon as the global trace function returns a local trace function, this callback receives all kinds of local events. This may not seem like a big deal, since you can ignore events you are not interested in. But when we think about this a little more deeply, we realize there’s more to it.
Suppose we want to trace all raised exceptions. To achieve this, the local trace function must be set for every scope. This means that every local event, such as “line”, “return”, and “exception”, will be traced for every function, whether in your project code, a dependency, or the standard library. So, every line will trigger the local trace function call. Even if “line” events are ignored, and the callback immediately returns, it still hurts the performance because a function call is a relatively expensive operation in every programming language.
The debugger pays the performance penalty in the described scenario even if no exception has ever been raised. The penalty is proportional to the number of lines of code executed.
Now, consider the following function:
def f():
   res = 0
   for i in range(100_000):
       res += i
   return res  # breakpoint
Imagine a breakpoint is put in line with the return statement. When f() is invoked, a local trace function should be set that checks if we are on the right line and pauses execution if we are. The problem is that the local trace function will be called 200,000 times because of the loop above the line with the breakpoint.
This lack of fine-grained control of what type of events should be traced is the main disadvantage of trace-function-based debugging.
The issue is not theoretical. It has affected PyCharm many times. One infamous case is when a test feature fails, and PyCharm drops into the debugger (PY-44270). To ensure that PyCharm stops on a failed assertion in a test, the PyCharm debugger traces raised exceptions. If an assertion exception is detected, PyCharm stops on the line where the exception has happened and shows the traceback in an editor inlay.
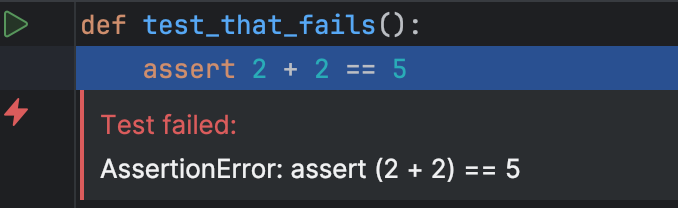
As one can imagine, test modules themselves can be long, but the code they invoke when testing can be even longer. Although no breakpoints are set in this case, and no stepping is involved, the performance hit is terrible to the point that this feature is disabled by default.
Another issue with sys.settrace is that many tools share it, such as debuggers, profilers, and test coverage. This creates another type of problem when different tools, being used simultaneously, redefine the global trace function, leading to a situation where the debugger doesn’t work (PY-20186).
Solving these issues
Before moving to the event-monitoring-based debugging that addresses most of the issues, let’s stop briefly and discuss an interesting attempt at improving the debugging performance by leveraging the CPython frame evaluation API introduced in PEP 523.
Frame evaluation is a low-level API available through CPython C API. It boils down to defining a custom evaluator for CPython bytecode. In other words, when a function is called, it is possible to take its bytecode and evaluate it however we want.
The PyCharm debugger uses this trick to inject bytecode with the “stop on breakpoint” logic to the original function bytecode. Let’s look again at the previous example:
def f():
   res = 0
   for i in range(100_000):
       res += i
   # The debugger logic will be injected here!
   return res  # breakpoint
Without frame evaluation, the local trace function will be called 200,000 times. Frame evaluation doesn’t rely on the local trace function to check if a breakpoint has been hit, but handles this event with injected code.
Unfortunately, code injection only allows optimized breakpoint stops. As soon as stepping is started or raised, exceptions need to be traced, and the only option is to fall back to local trace functions.
Frame evaluation itself is a major topic. If you want to learn more about it, you can watch an excellent talk from PyCon 2017 by Elizaveta Shashkova, where she explains how frame evaluation works “under the hood” and how it is used in the PyCharm debugger.
Low-impact monitoring in Python 3.12
PEP 669 introduces the new low-impact monitoring API starting from Python 3.12. Instead of using one local trace function that receives all events, the new API allows the definition of a separate callback for every event type. It also introduces tool identifiers that allow multiple tools to receive runtime events without interfering with each other.
Finally, the number of events that can be traced has grown, allowing more fine-grained control and allowing us to trace such events as returns from C extensions, taking a conditional branch, yielding from a function, and others.
To trace a particular event type, do the following:
- Set the tool ID using
sys.monitoring.use_tool_id. - Enable events delivery for the tool by calling
sys.monitoring.set_events. - Register a callback for a particular tool ID and event type combination with
sys.monitoring.register_callback.
Below is an updated version of the function call tracer that uses the new monitoring API:
import os.path
import sys

DEBUGGER_ID = sys.monitoring.DEBUGGER_ID

def init_tracing():
   sys.monitoring.use_tool_id(DEBUGGER_ID, "pep669_based_debugger")
   sys.monitoring.set_events(DEBUGGER_ID, sys.monitoring.events.PY_START)

   def pep_669_py_start_trace(code, instruction_offset):
       frame = sys._getframe(1)
       print("calling {} in {} at line {:d}".format(
       code.co_name,
           os.path.basename(code.co_filename),
           frame.f_lineno))

   sys.monitoring.register_callback(
       DEBUGGER_ID,
       sys.monitoring.events.PY_START,
       pep_669_py_start_trace)

def f():
   pass

def g():
   f()

def h():
   g()

if __name__ == '__main__':
   init_tracing()
   h()
Note that instead of the CALL event type, PY_START is used. According to the new conventions, a CALL event is emitted before the function call, while PY_START happens right after, exactly like the “call” event from sys.settrace. Also, the call-trace callback accepts a different set of parameters than a global trace function. As we will see in the next example, callbacks for different event types have different parameters related to the event type.
The updated version of the executed line tracer demonstrates that the new API allows for enabling event tracing for local contexts:
import os.path
import sys

DEBUGGER_ID = sys.monitoring.DEBUGGER_ID

def init_tracing():
   sys.monitoring.use_tool_id(DEBUGGER_ID, "pep669_based_debugger")
   sys.monitoring.set_events(DEBUGGER_ID, sys.monitoring.events.PY_START)

   def pep_669_py_start_trace(code, instruction_offset):
       frame = sys._getframe(1)
       print("calling {} in {} at line {:d}".format(
           code.co_name,
           os.path.basename(code.co_filename),
           frame.f_lineno))
       sys.monitoring.set_local_events(
           DEBUGGER_ID, code, sys.monitoring.events.LINE)

   def pep_699_line_trace(code, line_number):
       print("line {} in {}".format(line_number, code.co_name))

   sys.monitoring.register_callback(
       DEBUGGER_ID,
       sys.monitoring.events.PY_START,
       pep_669_py_start_trace)

   sys.monitoring.register_callback(
       DEBUGGER_ID,
       sys.monitoring.events.LINE,
       pep_699_line_trace
   )

def f():
   pass

def g():
   f()

def h():
   g()

if __name__ == '__main__':
   init_tracing()
   h()
As is evident from the code above, enabling local event tracing requires a code object.
Though the new API can look more verbose, it gives us much more control, solves long-standing performance issues, and opens up uses beyond debugging: low-impact profiling, coverage, and more.
Event-monitoring-based API performance implications
In general, using the event-monitoring-based API for debuggers is a good idea. PEP 669 tells us why:
“For heavily instrumented code, e.g. using
LINE, performance should be better thansys.settrace, but not by that much, as performance will be dominated by the time spent in callbacks.”
One of the most powerful mechanisms in the new monitoring API is the ability to disable emitting events for a specific line of code. Recall the function from the frame evaluation section:
def f():
   res = 0
   for i in range(100_000):
       res += i
   return res  # breakpoint
The line tracing callback can implement the following logic:
def line_callback(code, line):
   if line == 5:
       # Handle breakpoint
   else:
       return sys.monitoring.DISABLE
Returning sys.monitoring.DISABLE from the callback signals that no further events should be emitted for the line. This leads to fewer callback invocations and, thus, better performance. In the example above, this means that the LINE event for lines 2, 3, and 4 will be emitted only one time. This approach resembles the frame evaluation but without the necessity of dealing with low-level C API and patching bytecode.
However, disabling events for particular locations is not always feasible. If we want to trace raised exceptions, it is impossible to predict if an exception will be raised at a particular line because a function can fail with one set of parameters but work smoothly with another.
With the sys.settrace approach, when a single local trace function is responsible for handling all event types, invoking a local trace function is problematic. But the sys.monitoring API resolves the issue by allowing us to trace only the events we are interested in.
Let’s run a simple benchmark to see how huge the performance boost is. The benchmark code is a modified version of the snippet provided by Mark Shannon – the original author of PEP 669.
import timeit
import sys

def foo():
   for i in range(100_000):
       if i == 50_000:
           pass
   try:
       raise RuntimeError("Boom!")
   except RuntimeError:
       # Ignore.
       pass

print("No debug")

print(timeit.timeit(foo, number=100))

DEBUGGER_ID = sys.monitoring.DEBUGGER_ID

print("PEP 669")

raise_count = 0

def pep_669_exception(code, instruction_offset, exception):
   global raise_count
   raise_count += 1

sys.monitoring.use_tool_id(DEBUGGER_ID, 'debugger')
sys.monitoring.register_callback(DEBUGGER_ID, sys.monitoring.events.RAISE,
                                pep_669_exception)
sys.monitoring.set_events(DEBUGGER_ID, sys.monitoring.events.RAISE)

print(timeit.timeit(foo, number=100))

sys.monitoring.set_local_events(DEBUGGER_ID, foo.__code__, 0)

print("Exception raised", raise_count, "times")

raise_count = 0
# Use sys.settrace, this is about as fast as a sys.settrace debugger can be if written in Python.

print("sys.settrace")

foo_code = foo.__code__

def sys_settrace_exception(frame, event, arg):
   global raise_count
   if frame.f_code is not foo_code:
       return None
   if event == "raise":
       raise_count += 1
   return sys_settrace_exception

sys.settrace(sys_settrace_exception)

print(timeit.timeit(foo, number=100))

sys.settrace(None)

print("Exception raised", raise_count, "times")
The results are as follows:
| No debug (baseline) | 0.28 s |
| PEP 669 | 0.28 s |
sys.settrace | 5.48 s |
As you can see, sys.settrace is almost 20 times as slow as sys.monitoring. This performance penalty results from the invocation of sys_settrace_exception() 300,000 times in the for loop. The pep_669_exception() callback is invoked exactly one time when the runtime exception is raised.
Immediate benefits
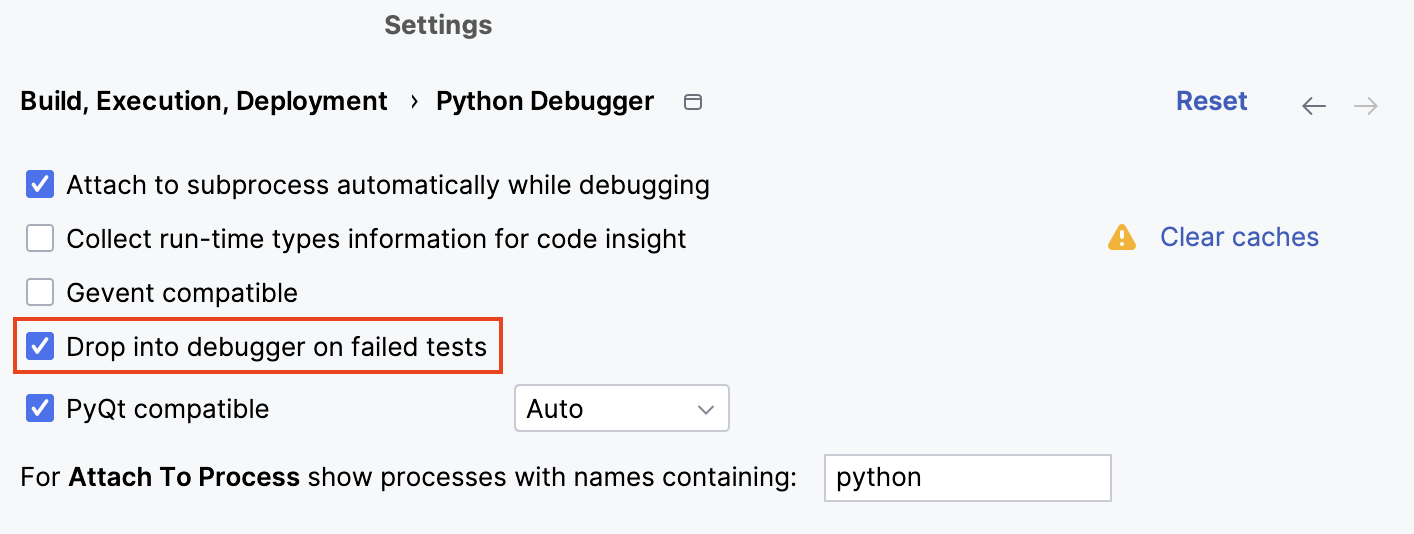
PyCharm 2023.3 adds initial support for the new low-impact monitoring API enabled by default for projects with Python 3.12 interpreters. All mentioned goodies from the previous section should work, so do yourself a favor and enable the “Drop into debugger on failed tests” feature.
Let’s take the following test:
def test_arithmetic_progression():
   acc = 0
   for i in range(1000):
       acc += i
   assert acc == 1000 * 999 // 2
and run it under the debugger in PyCharm 1,000 times using pytest and pytest-repeat. The results of the benchmark are shown in the table below.
| Without drop into debugger | With drop into debugger | |
| No debugger | 1.29s | 1.29s |
sys.settrace | 4.41s | 8.85s |
sys.monitoring | 4.60s | 4.98s |
As is evident from the table, the performance penalty for the new API is less than 10%, while with the old API, the code execution was two times as slow.
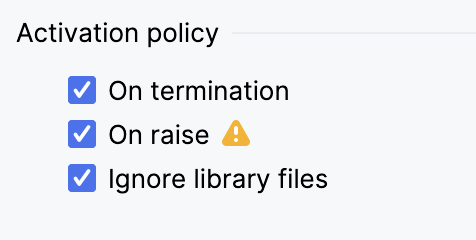
The same applies to tracing exceptions. Previously, the “On raise” activation policy could cause major performance degradation, especially compared to frame evaluation. With Python 3.12 and sys.monitoring, this activation policy is almost penalty-free.
Conclusion
Now that the sys.monitoring API has been stabilized, we will continue tuning up the debugger performance, leveraging all the good additions PEP 669 has brought. The fine-grained event types open new horizons for precisely tracing everything that happens at runtime.
If you have any issues with the debugger, feel free to report them to the PyCharm YouTrack issue tracker.
Migrating the tools from the old sys.settrace approach to the new API is an important undertaking for the Python community. This will allow them to play nicely together and save the users from confusing errors.
We hope this article has provided a solid foundation for using the different tracing API in Python and a glimpse into what’s going on “under the hood” when you debug your Python applications.