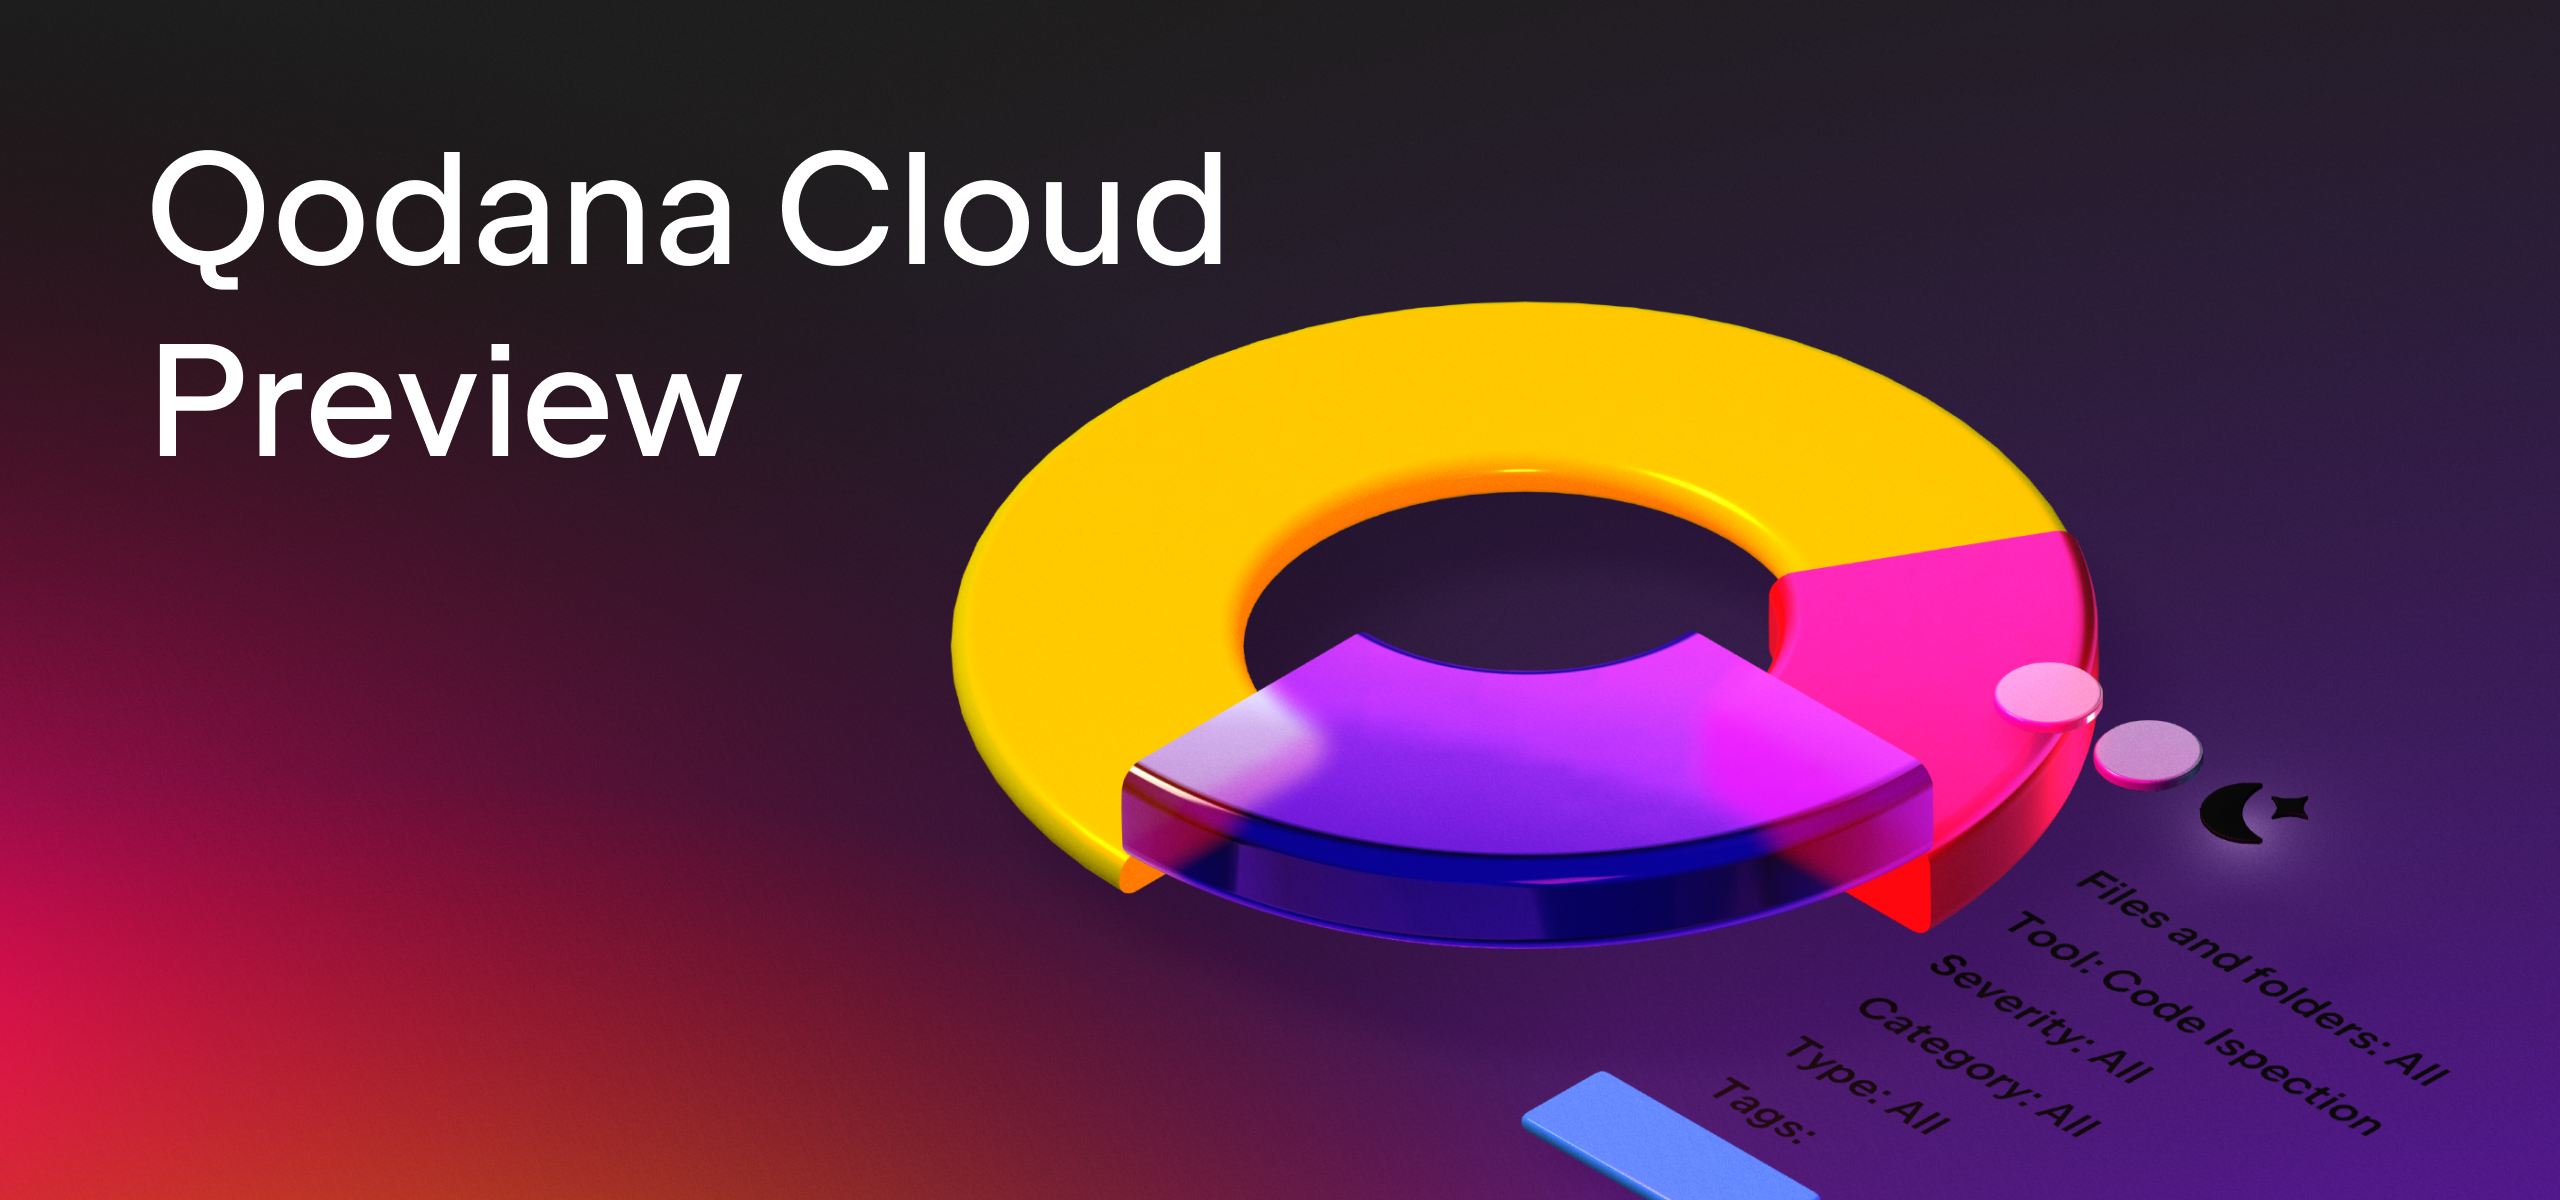
Qodana
The code quality platform for teams
Announcing the Preview for Qodana Cloud, a One-Stop-Shop for All Your Code Quality Insights!

A public preview is now open for Qodana Cloud – a centralized cloud-based solution that collects and displays data from different Qodana linters under one roof. You can use Qodana Cloud to manage your code quality checks in a variety of contexts, ranging from one-person projects to large development teams.
Qodana Cloud is still in development, and to iron out some wrinkles we are calling for the support of the community. If you want to become an early adopter of our new features, read on to learn how to get started with Qodana Cloud.
How Qodana Cloud can complement your projects
Do you want to run static analysis in multiple projects or repositories? Is your codebase distributed across several servers and virtual private networks? Do your teams work independently, and are they not always on the same page when it comes to code quality? In any of these scenarios, if you wanted to ensure that your code is clean and secure, you previously would need to switch between different linters or Qodana instances to see the results for different projects.
The need to switch between linters can make the code review process convoluted and inefficient, and we’ve developed Qodana Cloud to address precisely this problem. Qodana Cloud collects all the data from different Qodana linters in a single place and allows you to drill down into particular issues with interactive dashboards.
Here is how you can benefit from Qodana Cloud:
Get deeper insights into your projects’ trends
With the ability to aggregate reports from different sources in one view, you can discover trends and patterns in your code across all projects and get a better understanding of how your project or the whole team is performing. This way, developers will no longer code in silos, instead seeing the same list of issues. This also makes it easier for managers to track progress for the whole organization.
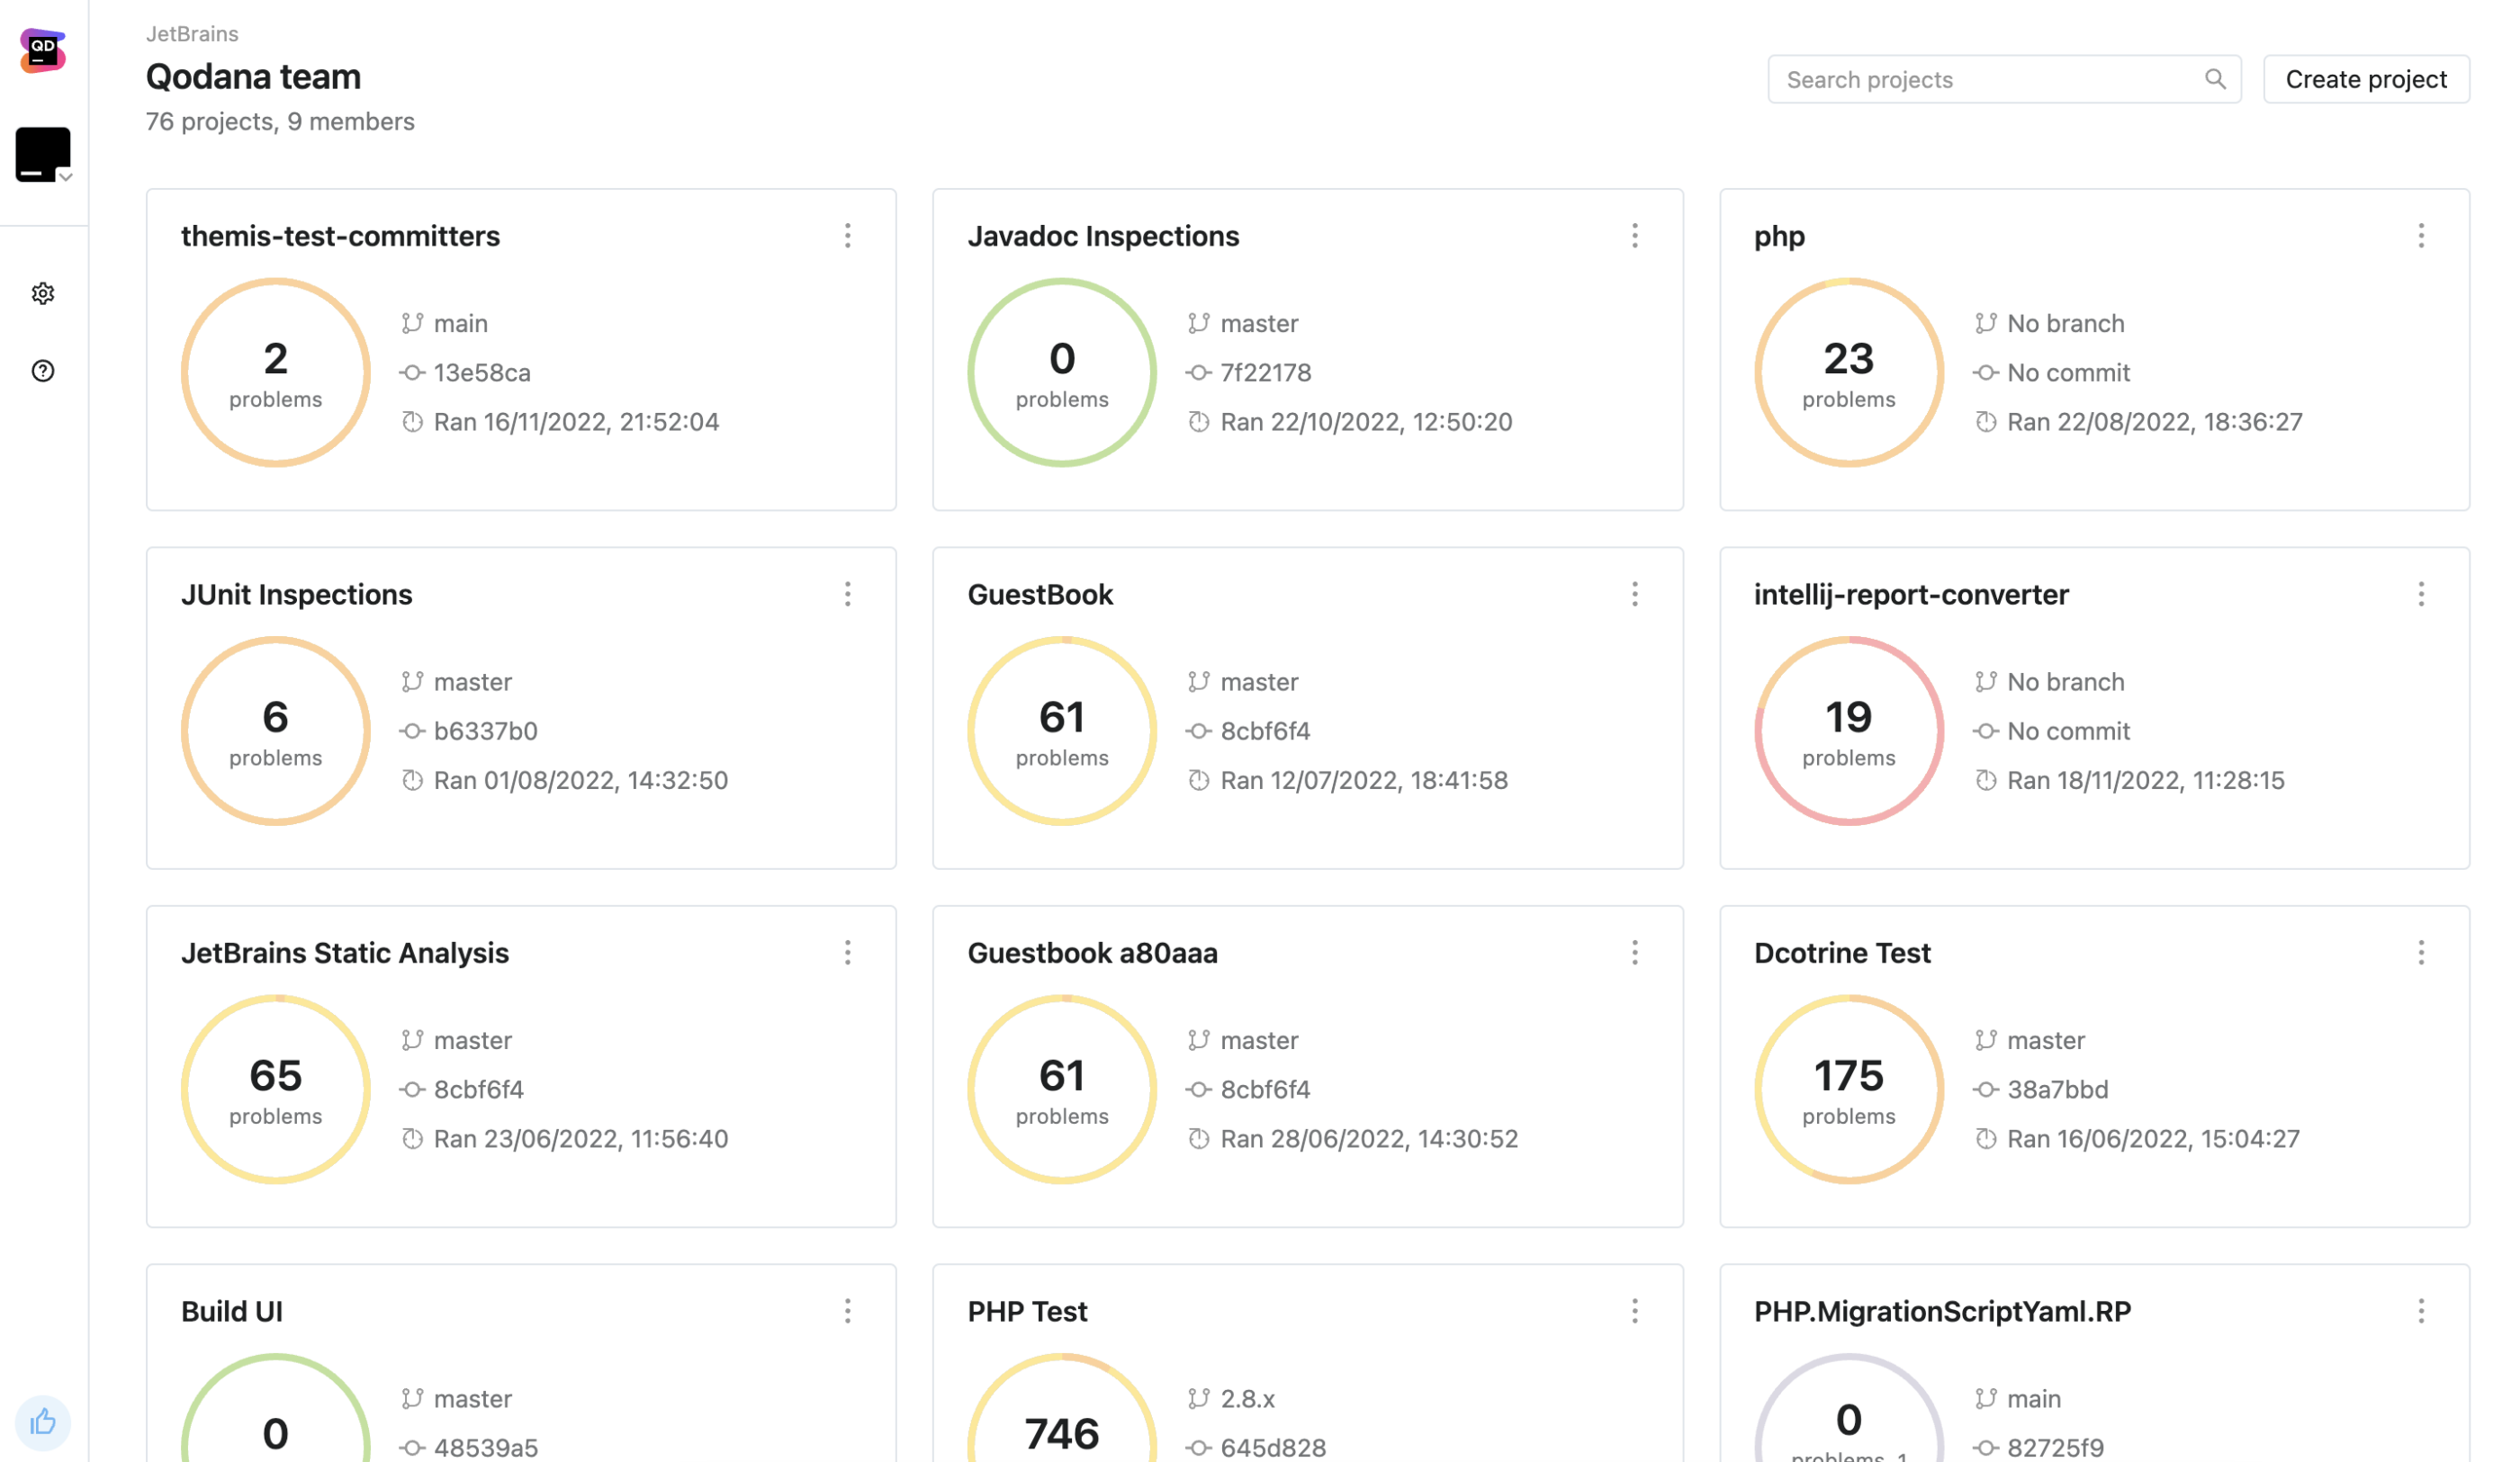
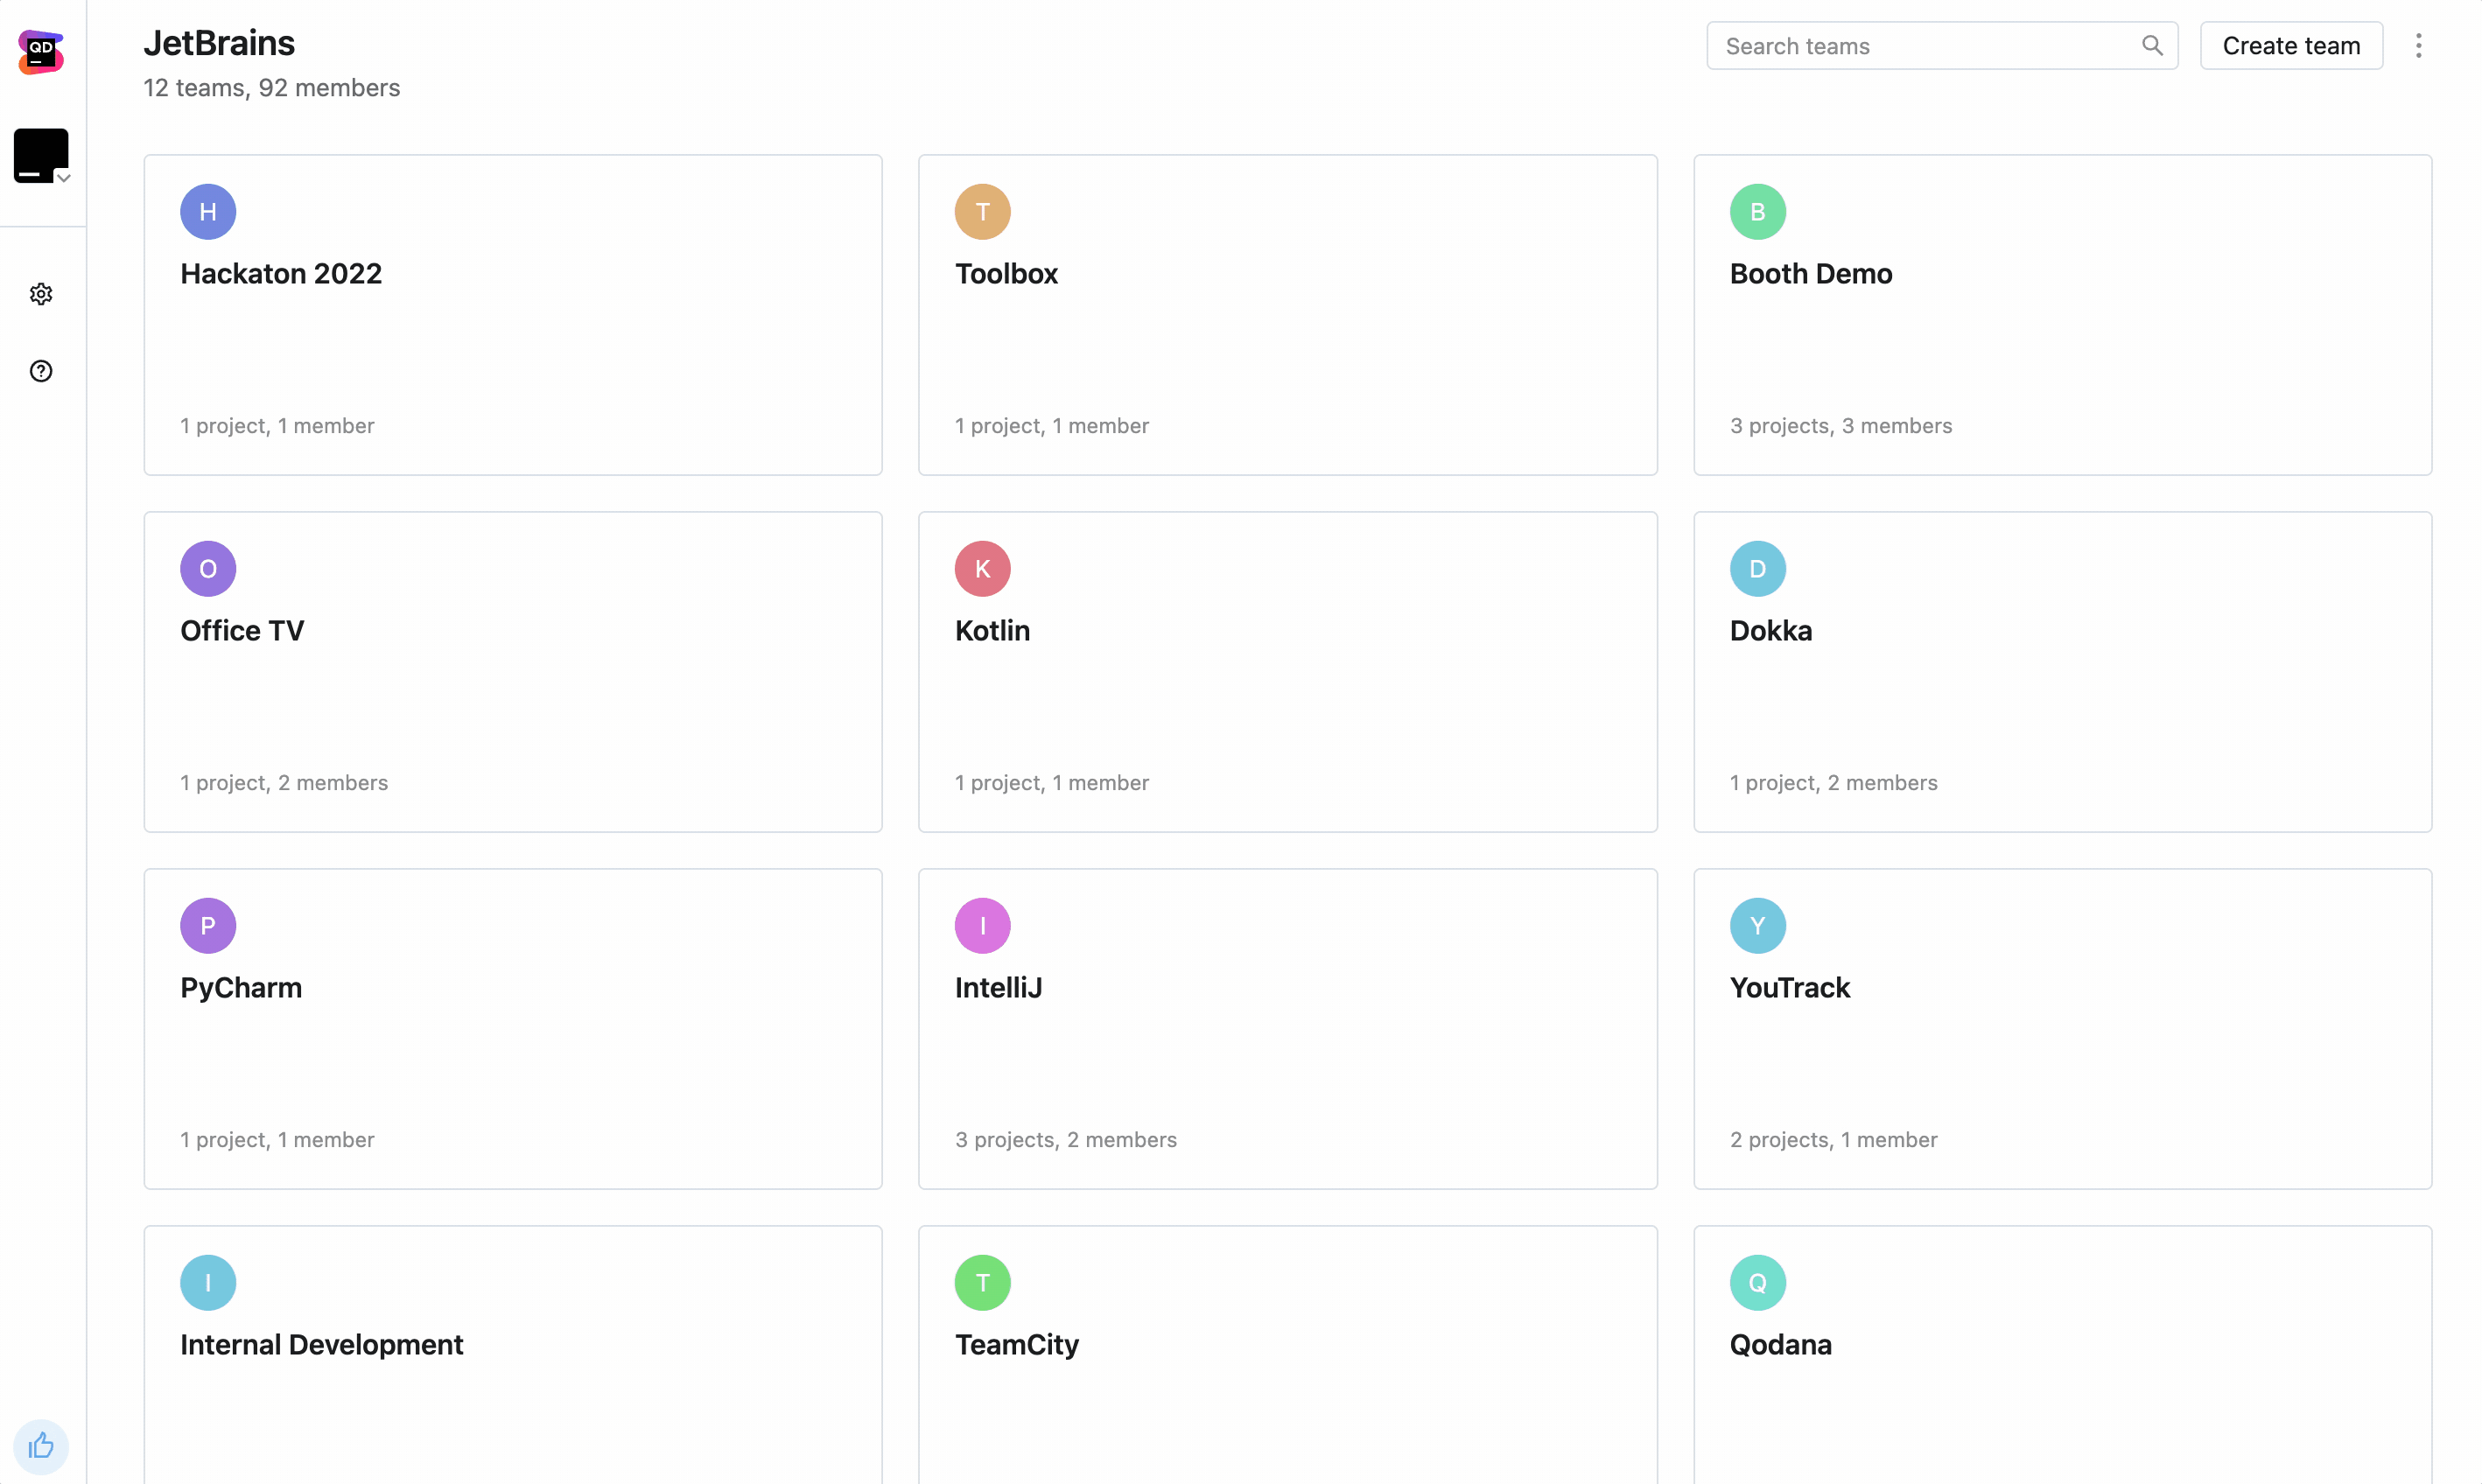
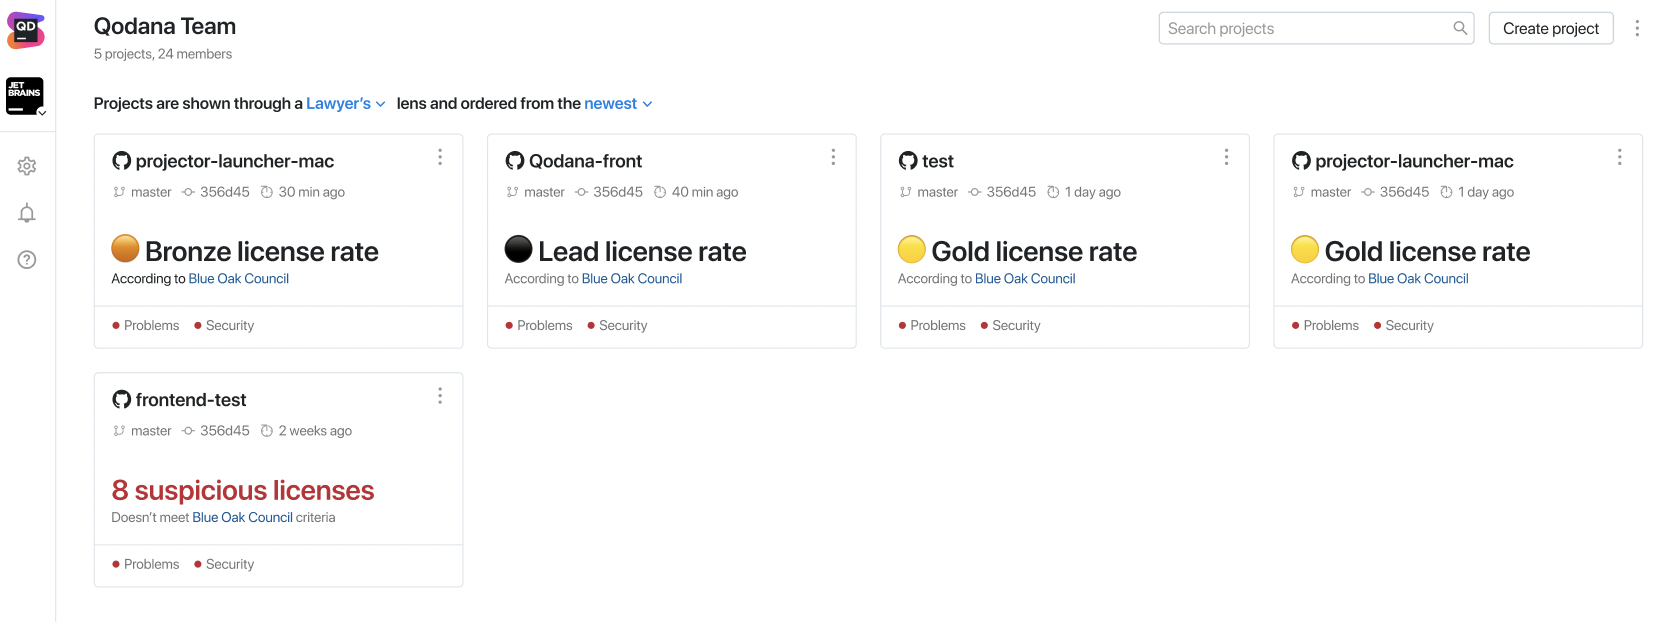
You can create separate organizations, teams, and projects in Qodana Cloud and assign a single team to several projects for convenient navigation. In addition, you achieve more transparency thanks to widgets updating in real time.
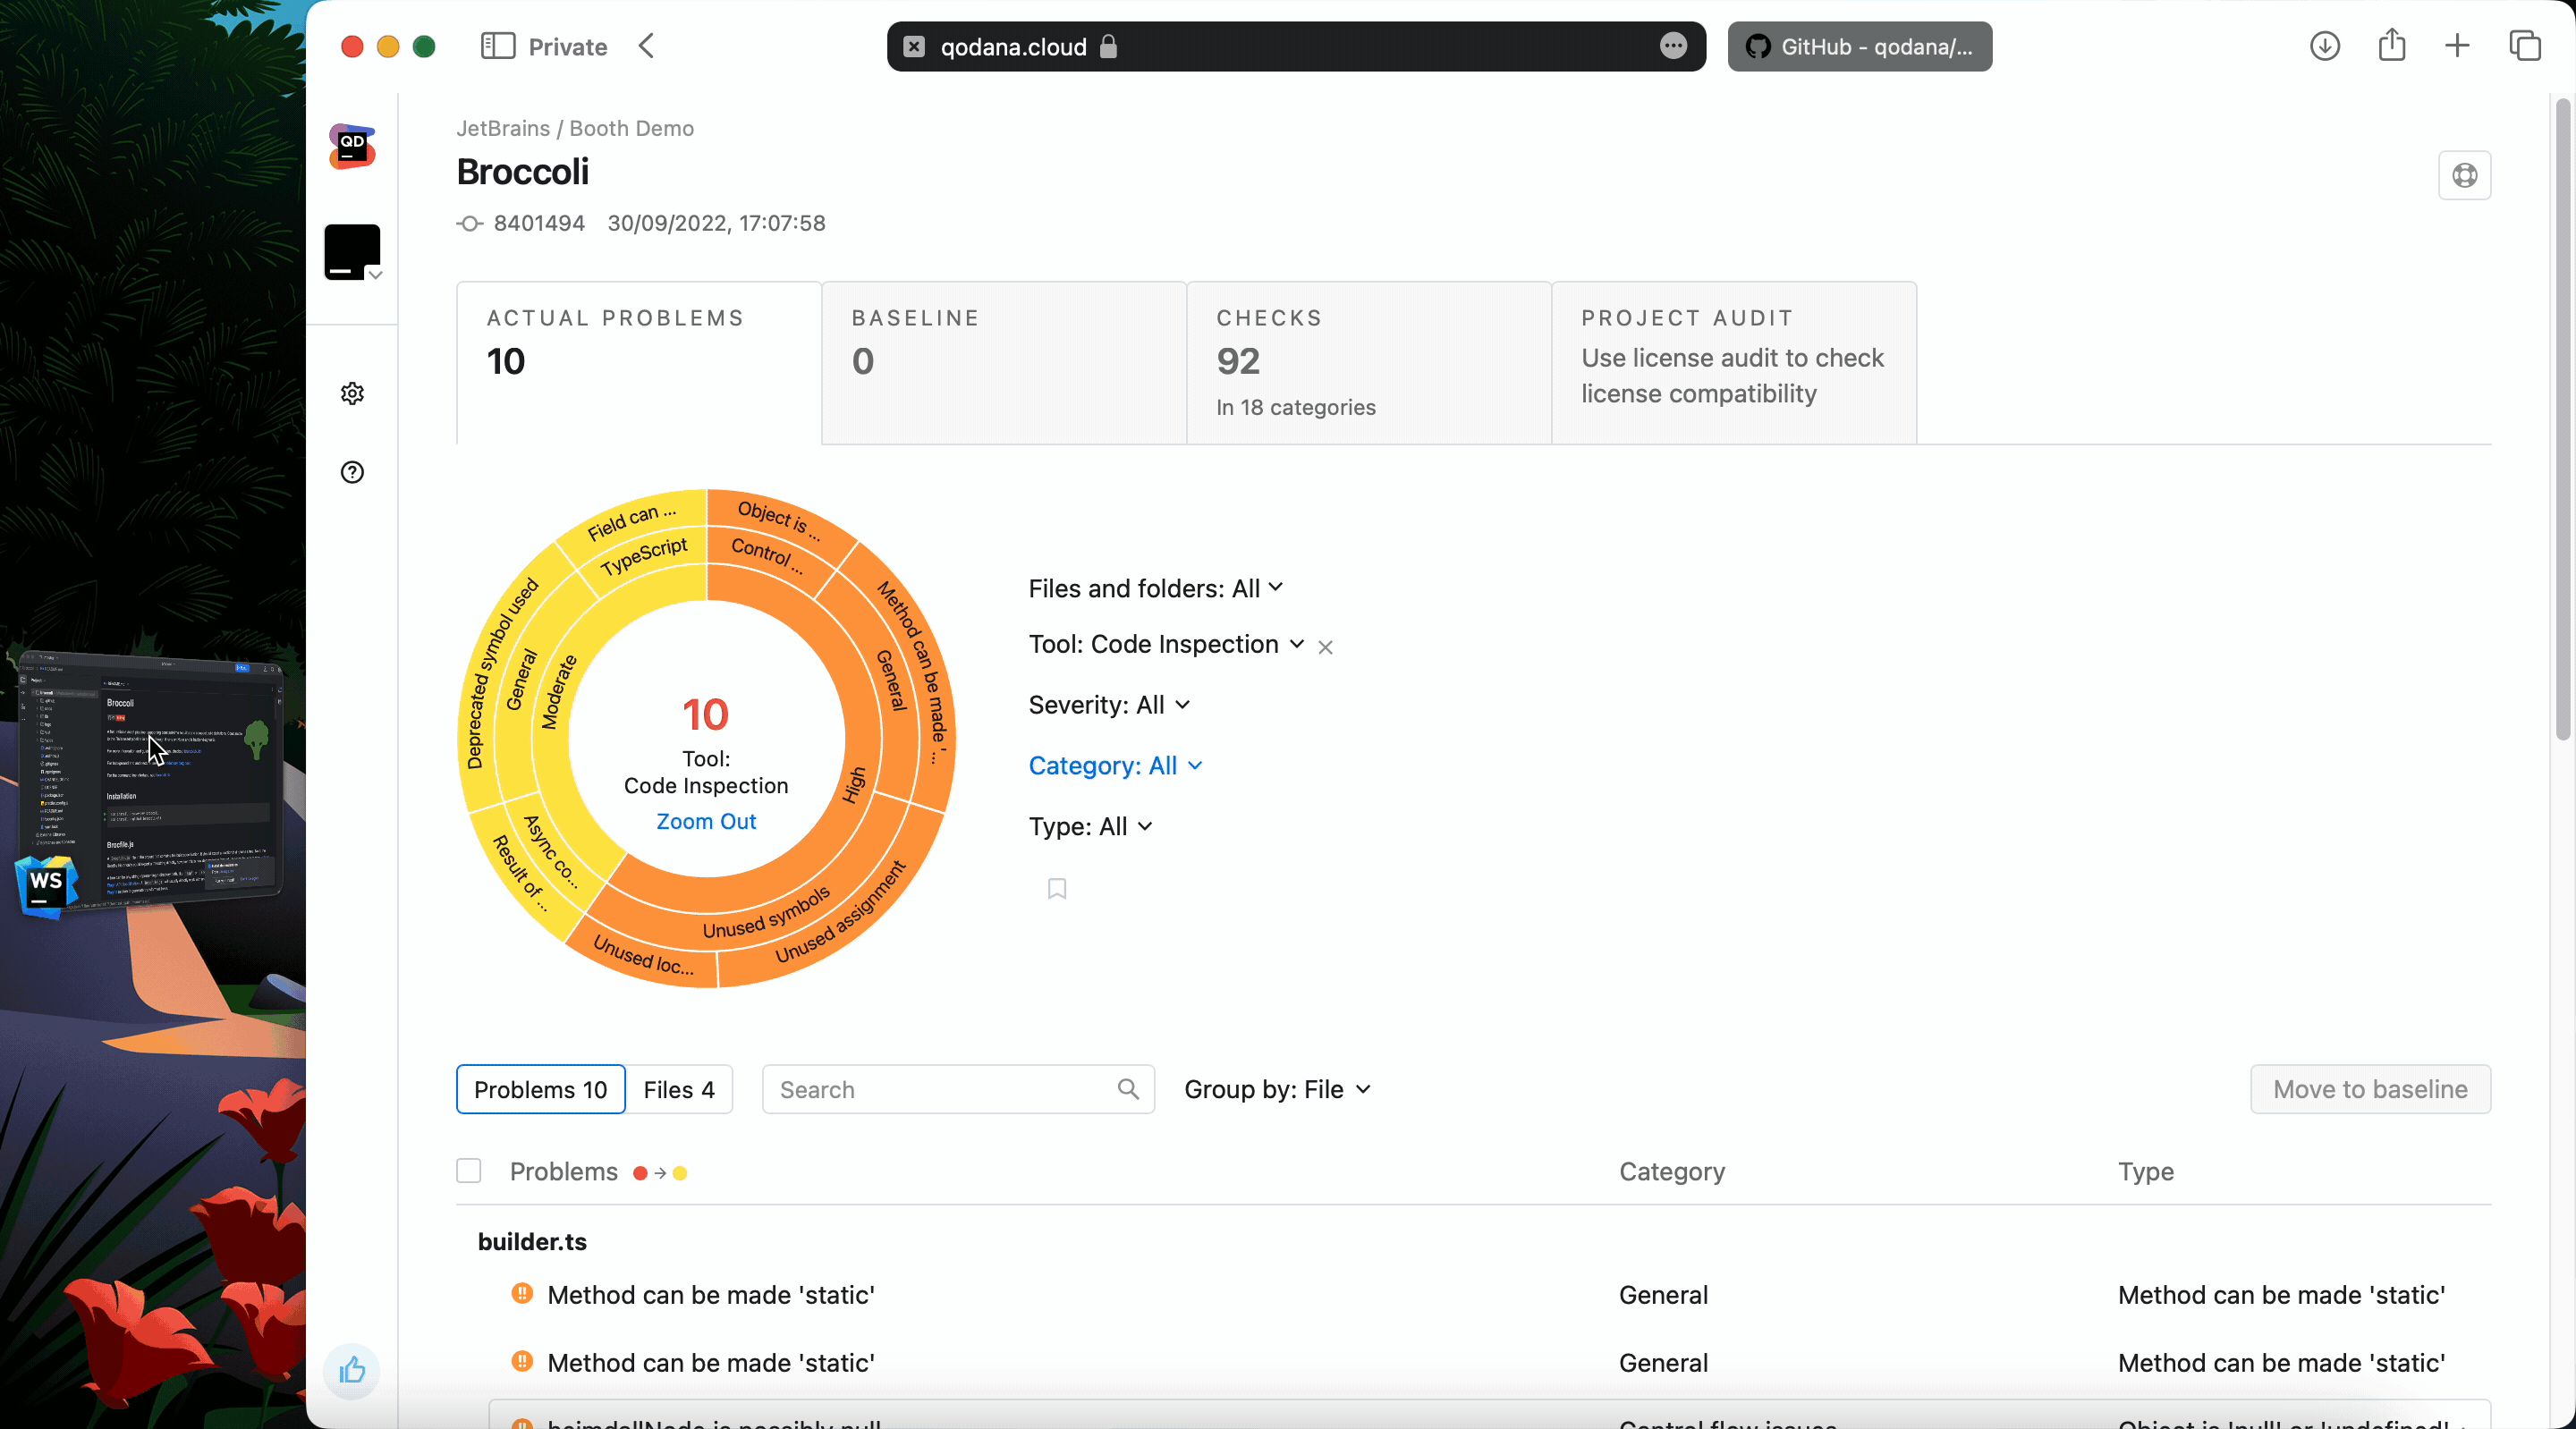
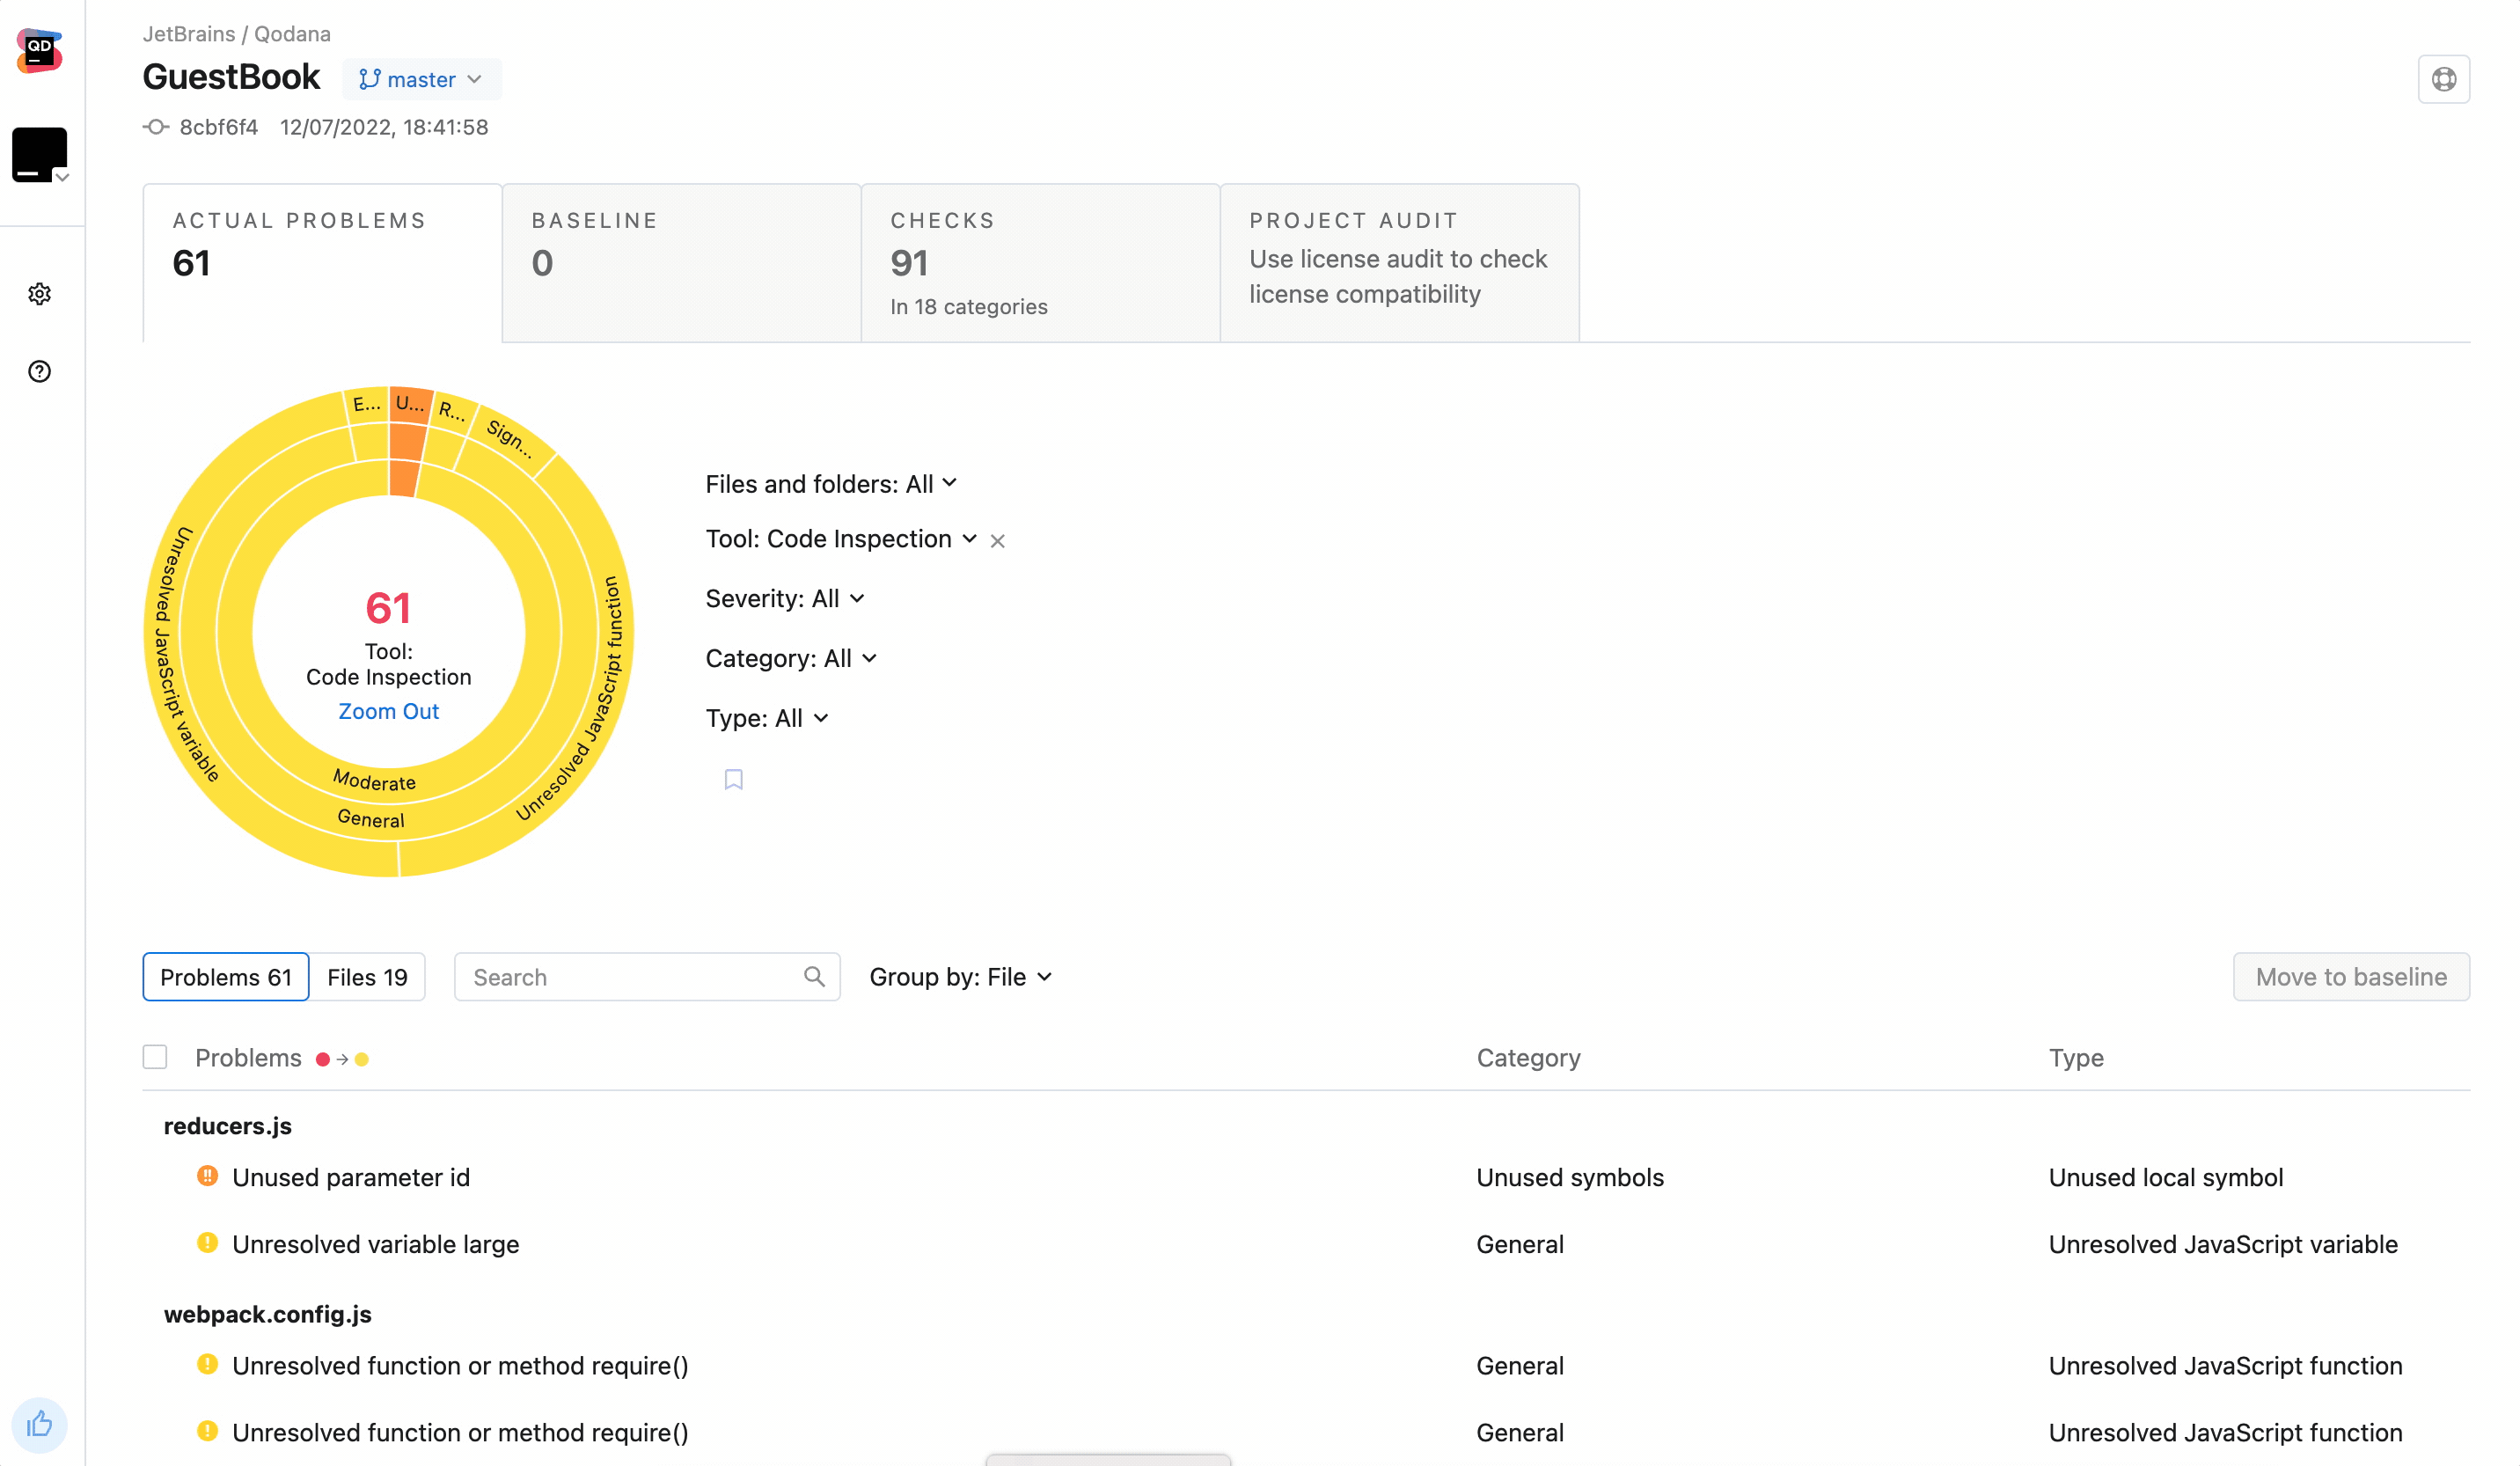
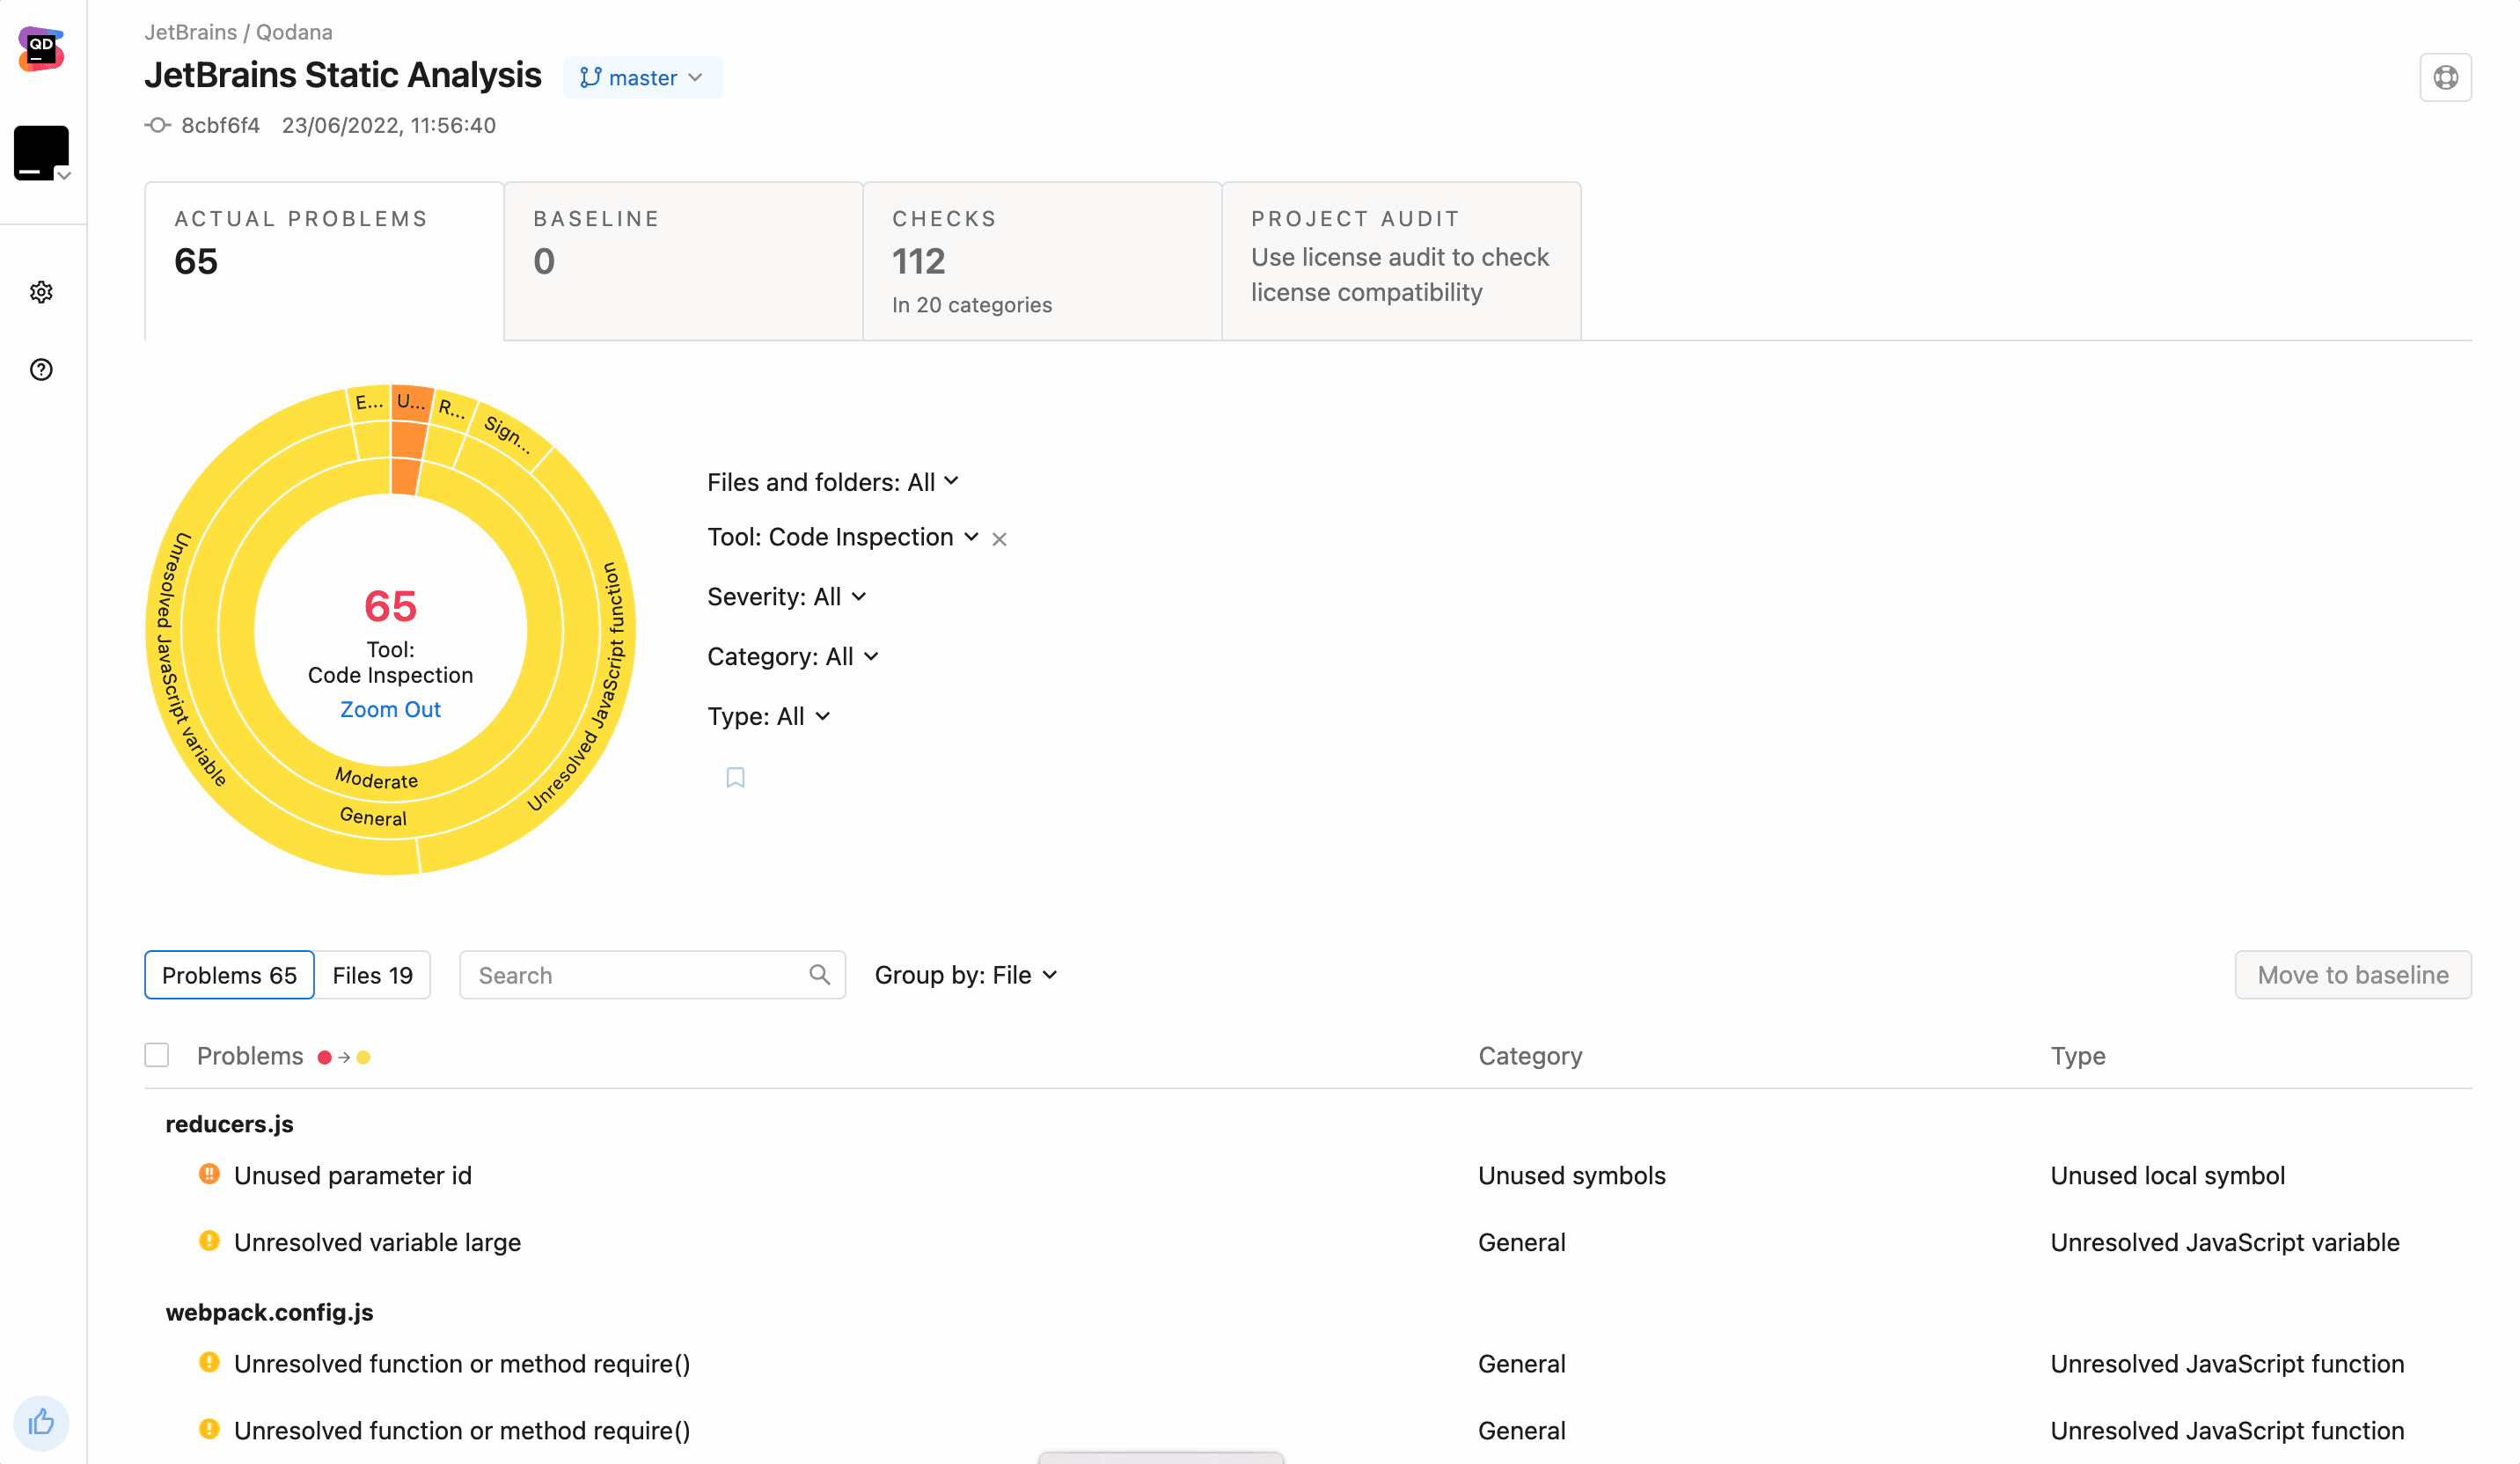
In each project, you can also see a history of previous results and compare the results of quality checks between commits. You can examine the absolute number of problems detected or compare the number of problems against a baseline – a snapshot of the codebase problems taken during a specific Qodana run.
Open problems detected by Qodana in your favorite IDE
If you are already a Qodana user, you might know that you can open issues spotted by Qodana right in your IDE. And now this feature works for Qodana Cloud, too! This means you can fix server-side errors in the editor the same way you work with other suggestions given by the IDE.
Here’s how it works:
What’s especially important about Qodana being bundled with JetBrains IDEs is that you run resource-intensive checks outside of your development environment without hurting your IDE’s performance. In the example above, Qodana spotted a chance that a variable could be null and cause a runtime exception. This is a severe issue, but users tend to switch off such inspections for the sake of saving resources.
In fact, that’s one of the reasons why we at JetBrains created Qodana, to ensure that you no longer have to choose between code quality and IDE performance!
Plan your work better
Split big projects into small steps! Switching to a newer version of a language or framework, or getting rid of a certain utility or pattern, can be a cumbersome task – especially if you are working on a big project involving many developers and QA engineers.
In Qodana Cloud, you can build a report to evaluate all pieces of code requiring modification and select issues to add to the baseline – otherwise known as the technical debt section. This way, the whole team can see the same list of issues and monitor progress with an interactive Qodana dashboard.
Choose the dark or the light side
In the design world, dark mode is the new black. Who are we to ignore that? To ensure you have a good experience with Qodana Cloud, we’ve provided the option to manually choose the dark or the light theme or have the UI sync automatically with your system preferences.
What’s coming next?
In future releases, we will add role-based access control so that you can grant different permissions based on a user’s responsibilities. For example, perhaps your legal team only needs the ability to view reports about licenses used in a product, or your security team needs to see a list of vulnerabilities in the codebase. You will be able to create custom roles for them with permissions that are specific to their tasks. We are also working on implementing more security controls and allowing quick-fixes for certain types of issues.
Follow us on Twitter or subscribe to the blog for updates.
How to get started with Qodana Cloud
To get started, go to qodana.cloud and log in with your JetBrains Account. Alternatively, as a non-registered user, you can explore demo projects that were already analyzed by Qodana Cloud to see it in action.
To pull your inspection reports from other Qodana instances into the cloud, Qodana Cloud will generate a token for you to set into your project in your CI tool. For detailed instructions, see our documentation.
Project setup
Setting up a project in Qodana Cloud takes five simple steps:
- Trigger the first run. First, Qodana analyzes your project using vital checks only. It will identify the number of files and folders containing problems, the languages used, and other important info about your project.
- Customize your analysis. Next, Qodana offers you the option to enable extra inspections that might be critical for your analysis.
- Narrow the analysis down. You can then exclude certain files and folders from the analysis.
- Create technical debt. Our favorite part is the ability to add detected problems to the baseline, allowing you to get back to them when you have time.
- Apply the inspections throughout the project. To apply the selected settings to your project, download
qodana.yamlandqodana.sarif.json, put them in the root folder, and restart Qodana.
That’s all for now! If you have any suggestions for future blog topics or if you want to learn more about how Qodana can help you and your business, post a comment here, tag us on Twitter, or contact us at qodana-support@jetbrains.com.
Happy developing, and keep your code clean!