Profile Ruby & Rails Apps With rbspy in RubyMine

RubyMine 2019.1 adds support for rbspy – a great sampling profiler for Ruby (many thanks to @jvns!). This post will help you start profiling your Ruby/Rails apps with RubyMine in 5 minutes. Here are the exact steps:
- Identify the scenario to be analyzed
- Create a profiler configuration
- Run the program with the profiler attached
- Analyze the profiled data
- Export/Import the profiled data
- Other options
First things first: make sure you have rbspy installed. If it’s not, see this guide to install it for Maс, Linux, and Windows. Now you’re set. Run RubyMine 2019.1 and follow these steps to start profiling:
Identify the scenario to be analyzed
For demonstration purposes, we’ve added an inefficient piece of code to our toy Rails blog*. The newly added feature checks whether a single author has different articles with the same title. However, after some testing it turned out that some pages take several seconds to load, which is pretty slow. It’s time to apply our new profiler.
Create a profiler configuration
Go to Preferences | Build, Execution, Deployment | Ruby Profiler to add your rbspy profiler configuration:
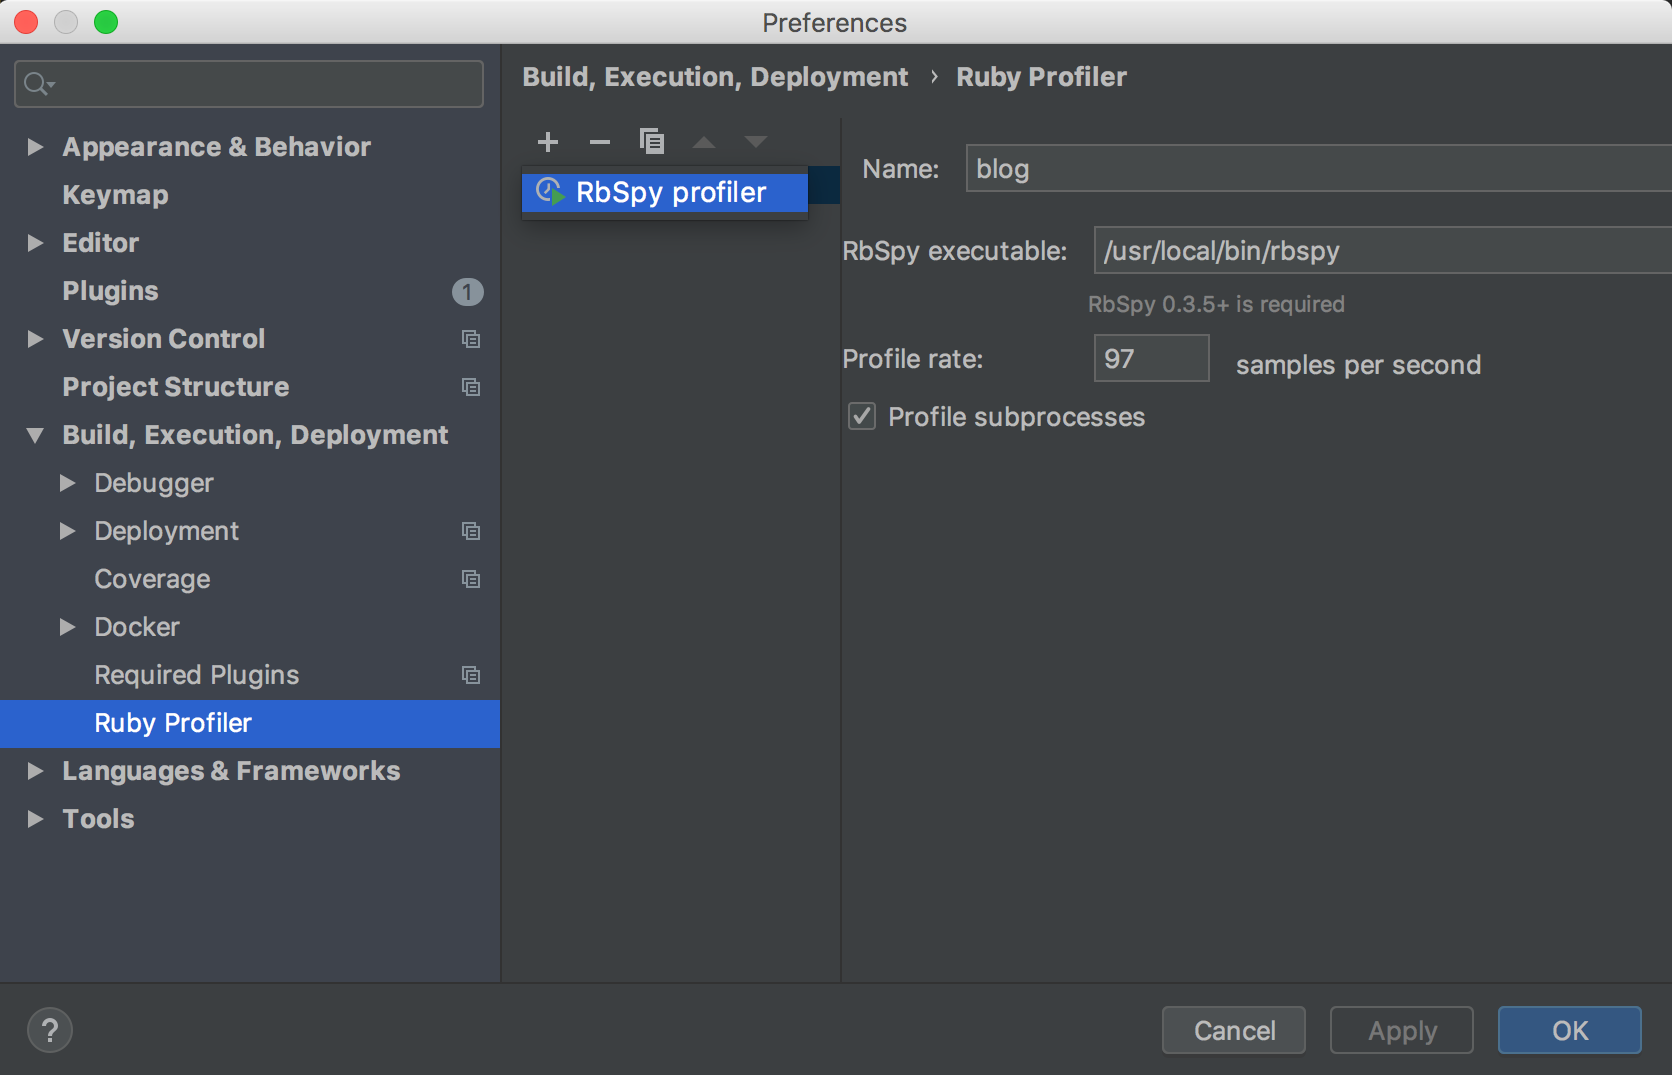
If the configuration is grayed out after your add it, then double-check your rbspy installation.
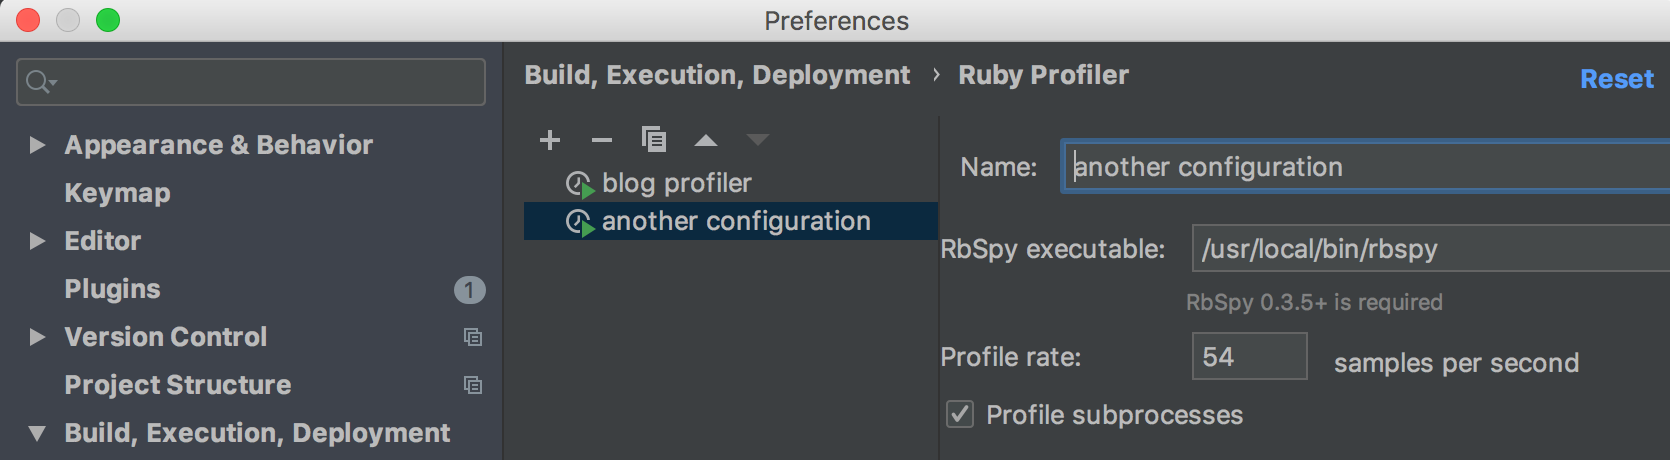
Note that with rbspy, you can create several profiler configurations if you want different profiler rates. The more samples per second you set, the more precision and, alas, overhead, you get, and vice versa:
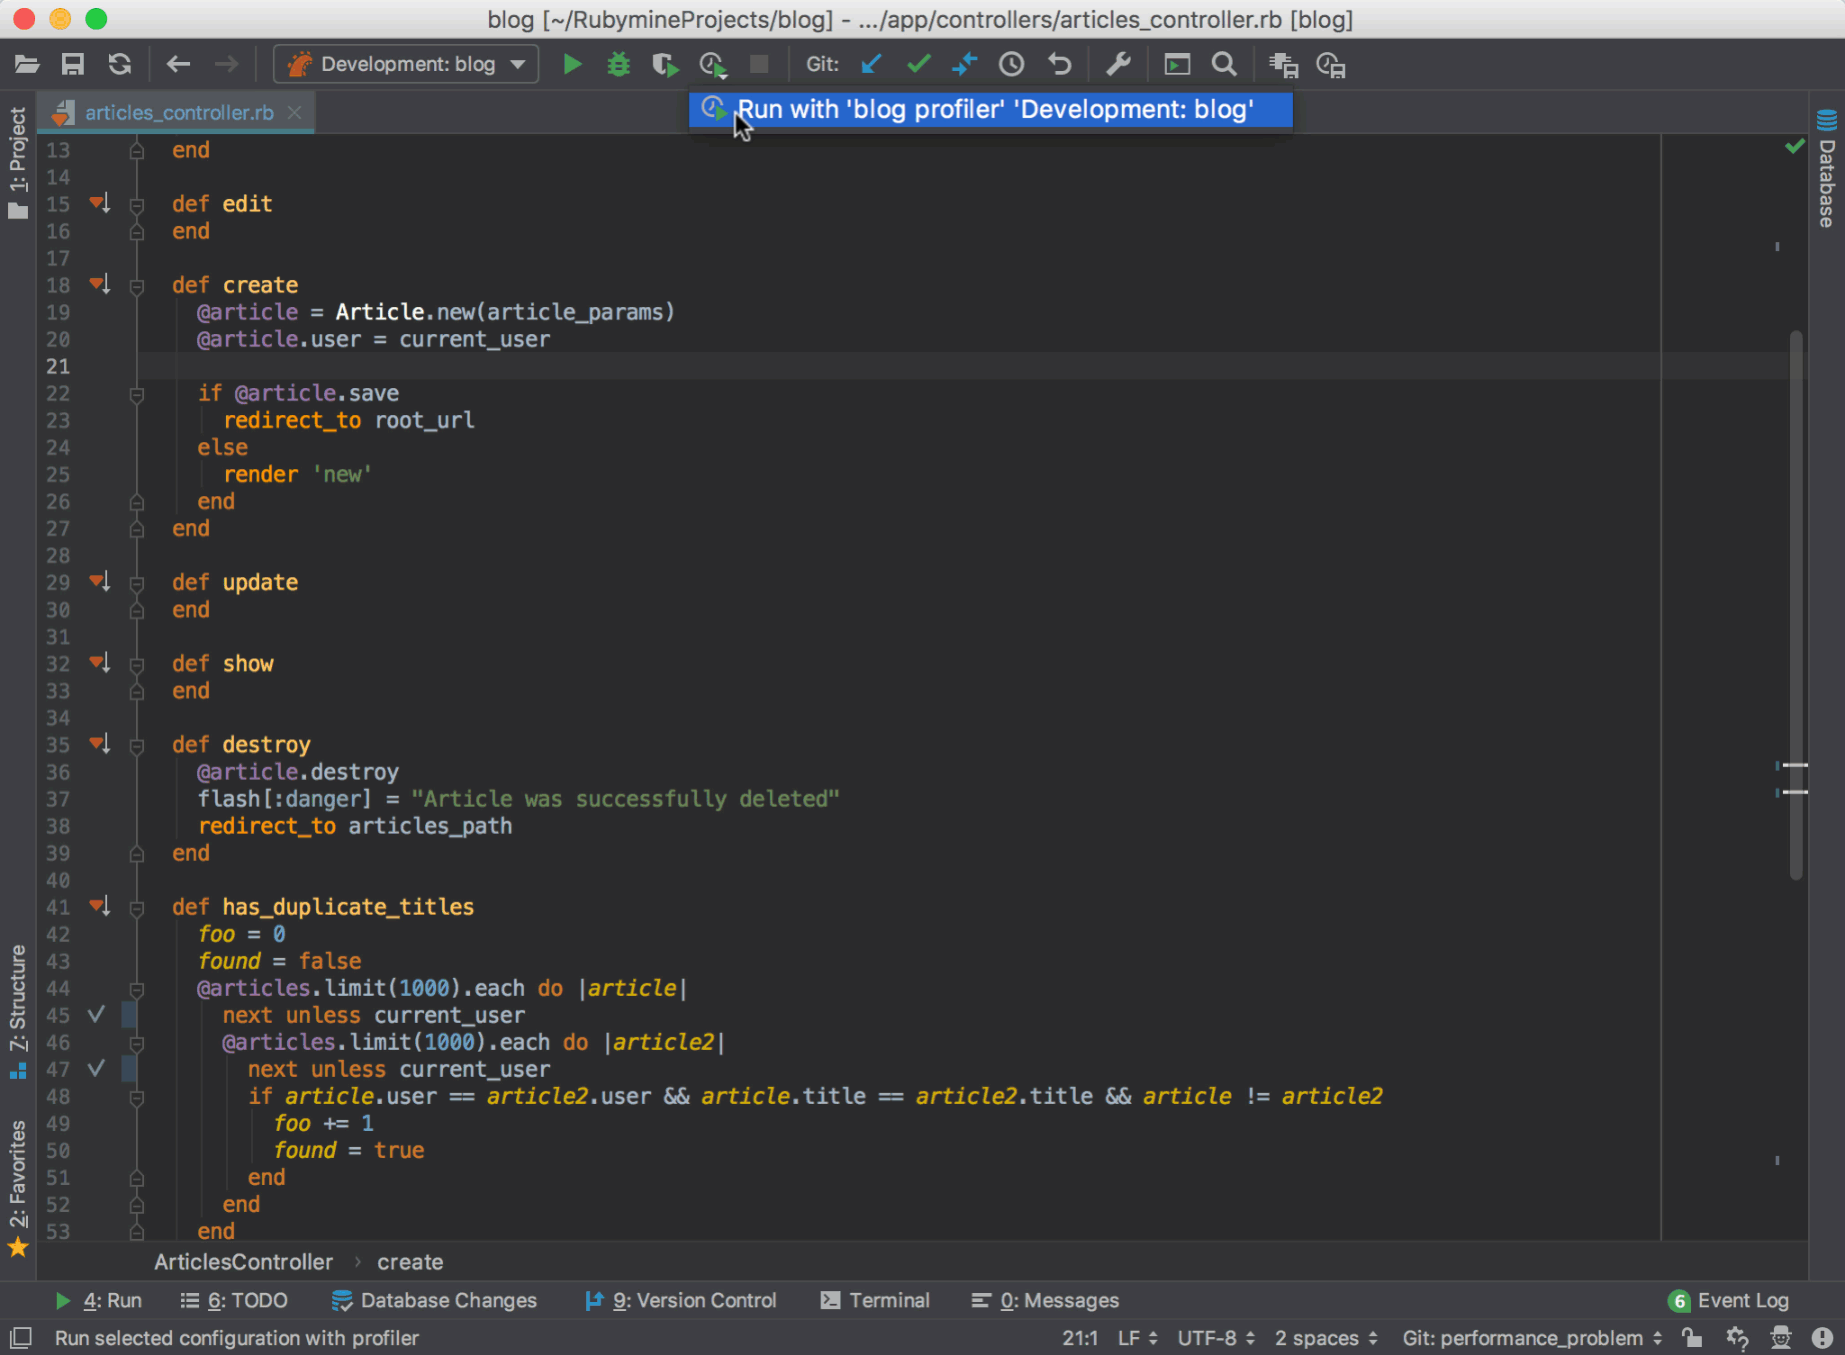
Run the program with the profiler attached
This can be done with Navigate to action, or by clicking the Run with Profiler icon on the Run toolbar:

The application will run and the profiler will start collecting data. We want to find the source of the slow page generation which bothers us, so we will reproduce the problem (we’ll open the slow page in the browser) while the profiler is running. After reproducing the problem, we’ll click the Stop icon so that the profiler stops collecting data, and navigates us to the profiling tool window.
Here’s a 30-second gif that depicts these steps:
Analyze the profiled data
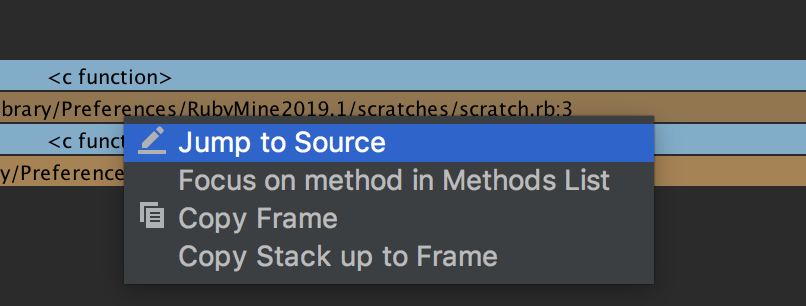
By surfing through different threads and their flame charts, we will eventually encounter a method `has_duplicate_titles` that takes 754 samples to complete, and, consequently, slows our application down. If we look it up in the method list, we will find out why: the current algorithm for finding duplicate titles is inefficient, as it requires loading from the database too often. But fixing this issue is out of scope of this blog post :)
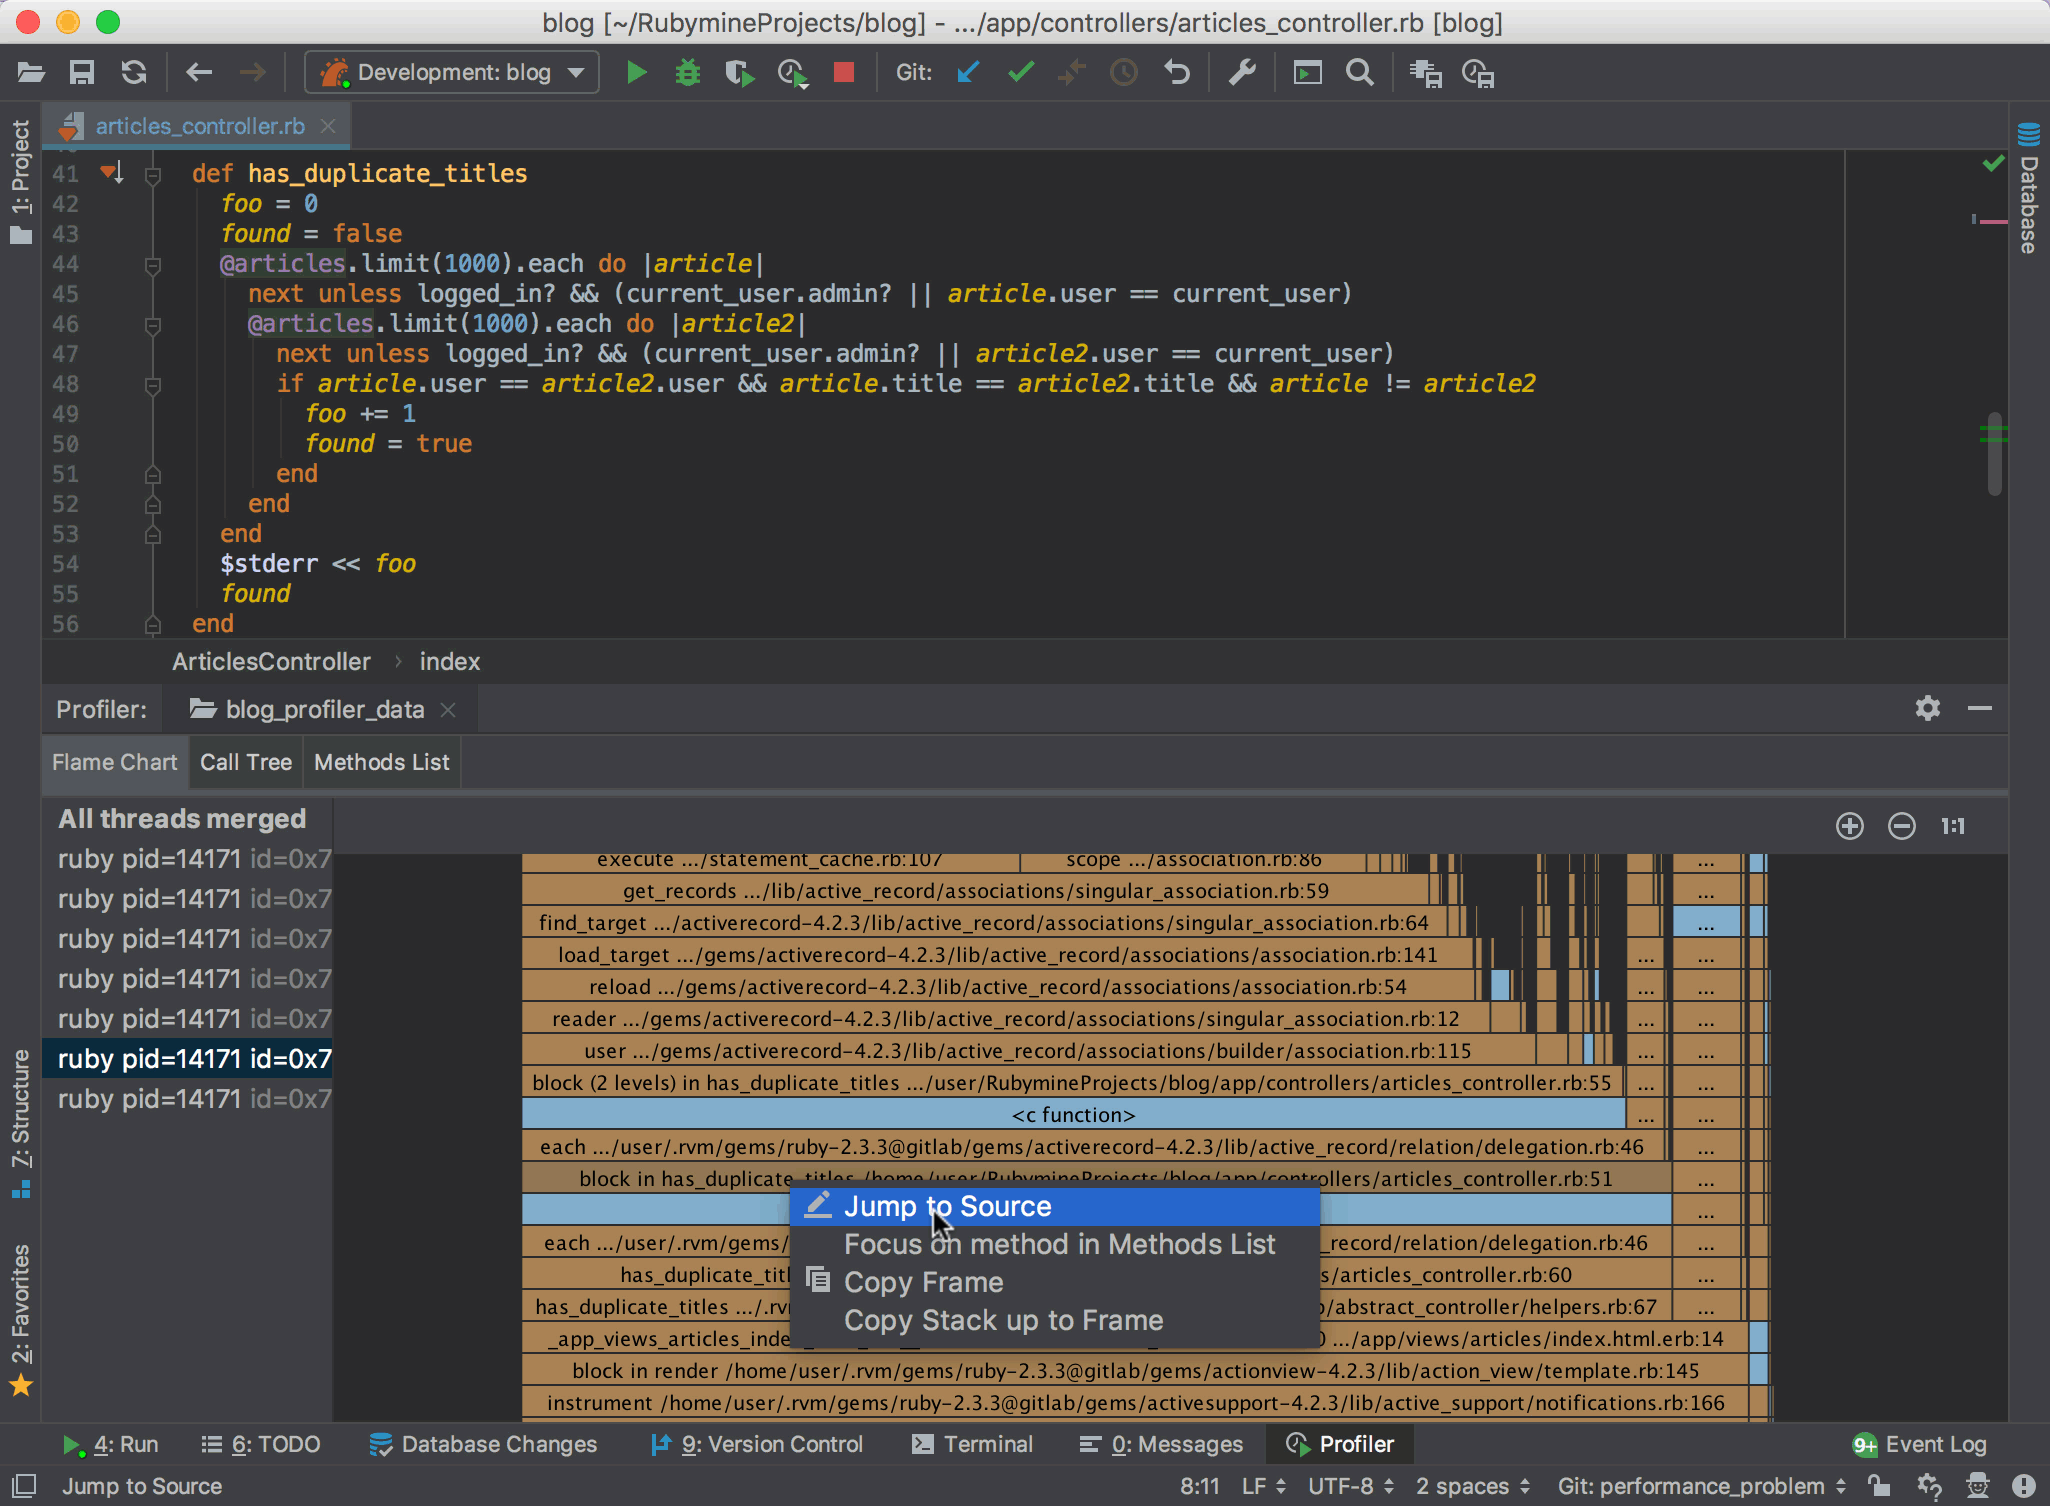
Note that you can invoke Jump to Source from the context menu to quickly navigate to the definition of the desired method:
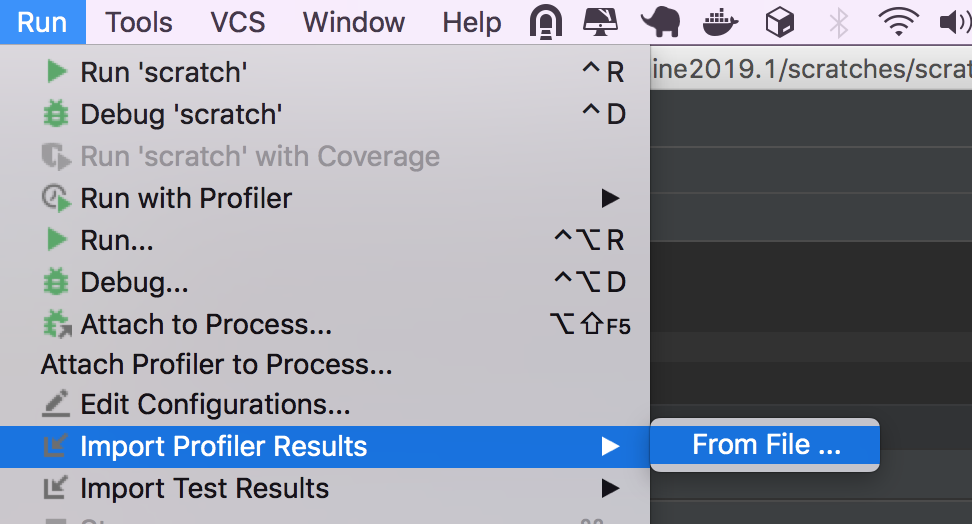
Export/Import the profiled data
Exporting/importing allows you to send the data to your colleagues or analyze it later (Run | Export / Import Profiler Results):
Other options
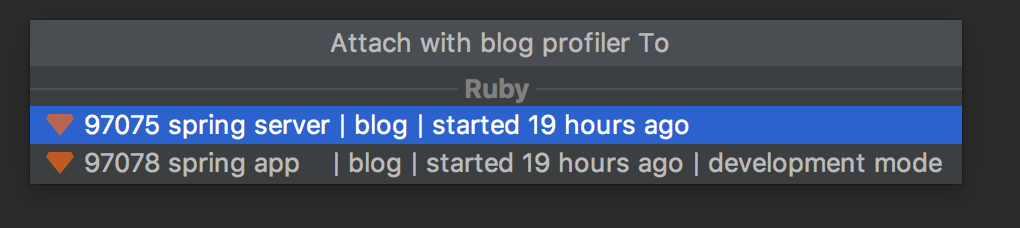
Finally, you can attach to a running process with the profiler on Linux and MacOS (For Windows, see RUBY-23795):
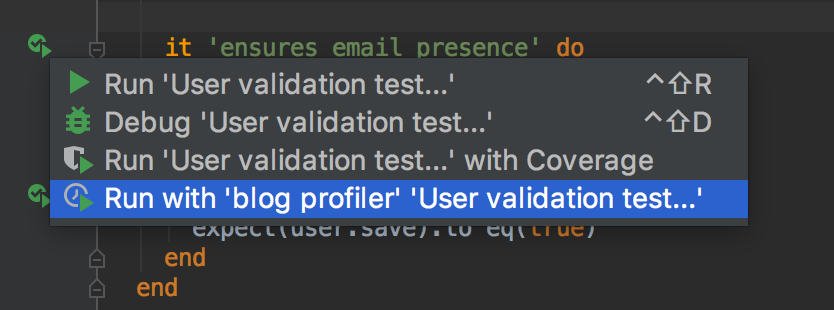
And profile tests:
This profiler is one of the major features in RubyMine 2019.1 We’ll highly appreciate it if you try it and let us know about any issues in the comments section. You can also submit an issue in YouTrack. Thank you!
As usual, check out our release notes for the full list of improvements inside this build.
*Check out the rbspy documentation to learn more about profiling Ruby/Rails apps.
*Thanks to the authors of Alpha Blog which our sample blog is based on.
Cheers,
Your RubyMine Team
Subscribe to RubyMine Blog updates