TeamCity
Powerful CI/CD for DevOps-centric teams
How to Achieve Significant Build Performance Gains With TeamCity

This article is brought to you by Mdu Sibisi, draft.dev.
Long build times interfere with developer momentum, disrupt flow states, and negatively impact productivity. While seemingly minor gaps in work rate may appear negligible in the moment, they quickly accumulate into significant increases in release cycle times and infrastructure costs. (There’s a reason high-performance development teams run their CI/CD pipelines several times a day).
While it’s tempting to reach for the latest software or methodology that promises to maximize your engineering team’s output, carelessly swapping tools with a trial-and-error-like approach isn’t a good idea: Premature adoption can often do more harm than good. It’s far more effective to adopt a strategy informed by data, where you first identify leaks and performance bottlenecks and remedy them accordingly.
After all, you must ensure your team is using the most optimal tools and that they’re using those tools optimally.
This guide offers a three-phase blueprint for achieving significant CI/CD pipeline performance boosts that will stick around even as you scale:
- Identify: Pinpoint pipeline flaws.
- Optimize: Apply effective solutions.
- Continuously improve: Apply long-term strategies to avert future faults.
Phase 1: Assess performance and identify bottlenecks
Before attempting any optimization, first assess the current performance of your pipeline and identify the causes of poor performance. This allows you to make informed improvements and prove their value.
Time is one of the most reliable and straightforward metrics to start with, particularly in the early stages of your pipeline audit:
- How long does full pipeline completion take (from commit to production)?
- What is the average duration of each pipeline stage (build, test, and deploy)?
- Which steps consistently take the longest?
Also, it’s important to survey or speak to developers about their time perception of the pipeline, and observe their behavior. They may be batching work or avoiding commits due to long feedback cycles.
They might even be avoiding experimentation based on unhealthy cultures centered around “waiting for the build”.
Use the data gathered from these sources to set and adjust your benchmarks and service-level agreements, such as build duration (time) and CPU cores or memory usage (resource utilization).
You don’t necessarily have to start with granular benchmarks and monitoring criteria per stage or process. You can keep it as broad as measuring overall pipeline completion time for the sake of simplicity.
While legacy platforms might hide away data in text logs, modern CI/CD platforms provide you with the visibility you need to assess performance out of the box.
In TeamCity, the Statistics dashboard provides deeper insights into the performance of each build:
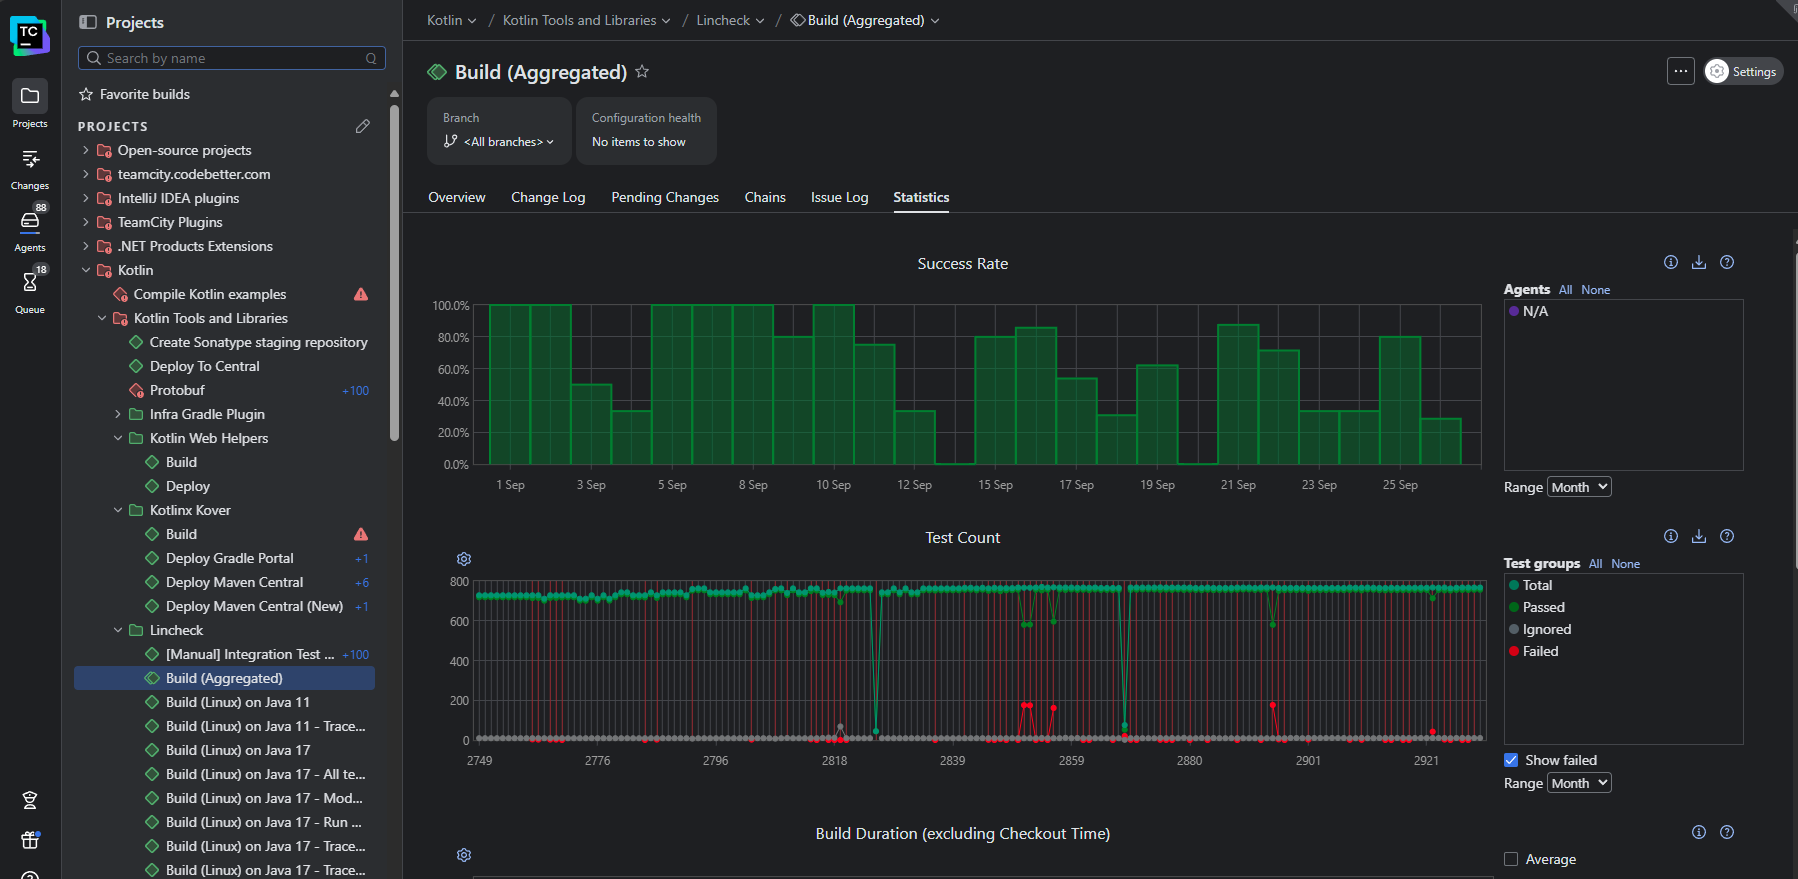
This view visualizes recent and historical build data using key metrics like build duration, success rate, test count, artifact size, and queue time. You can also create custom charts to track the metrics that matter the most to your business.
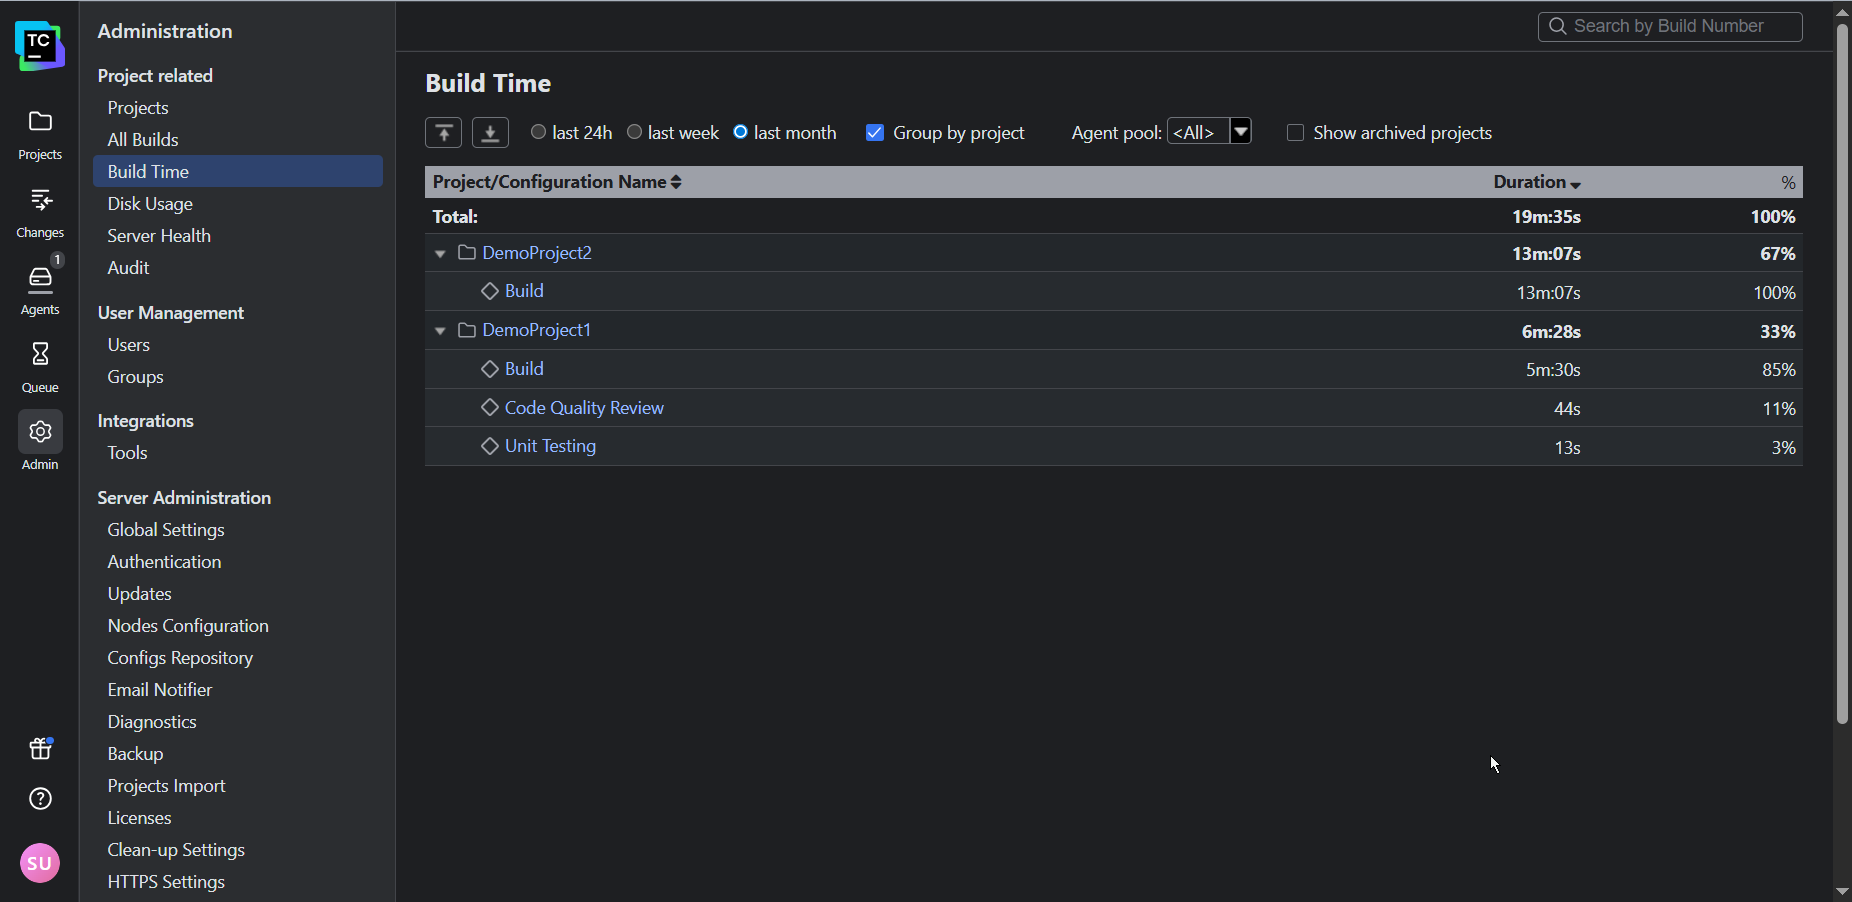
For a more granular view, the Build Time report shows the time taken by each stage of your pipeline so you can pinpoint the most significant bottlenecks:
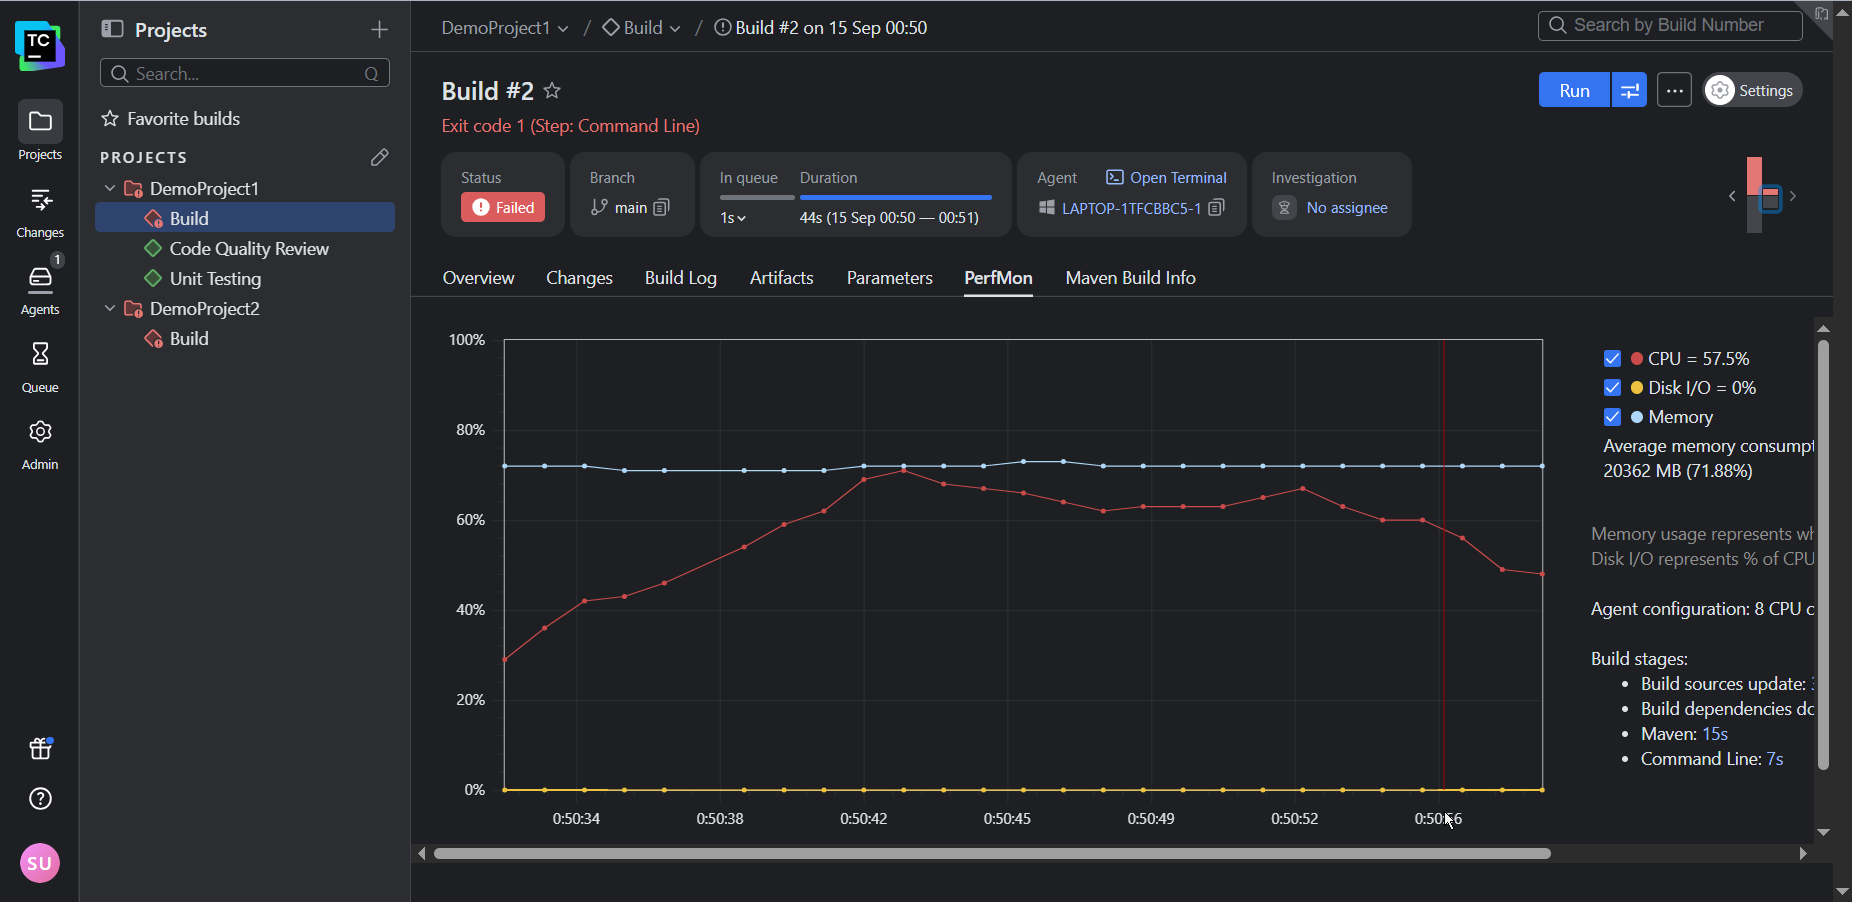
By default, TeamCity attaches its Performance Monitor to each of your build configurations created from a URL. This provides you with a handy way of tracking resource utilization:
In addition to the Performance Monitor (and a host of other build features), TeamCity’s notifier can trigger real-time alerts for any important build events (such as fails, successful completions, or hangs) via email or Slack.
Phase 2: Optimize performance
Once you know what’s not working, you want to identify the highest-impact changes your team can make to boost performance.
Avoid initiatives that may break the system or result in widespread interruptions, like upgrading build tools without validating downstream dependencies or switching shell or OS environments. Small incremental changes that can be isolated are the least likely to disrupt your team’s productivity and the easiest to trace and roll back if something goes wrong.
Some sure-fire techniques that are usually relatively simple to apply include the following:
- Build caches: Cache external (package manager) dependencies and build artifacts.
- Parallelization: Run tests in parallel across agents or containers, splitting test suites by file, type, or historical timing data. You can also build microservices or modules concurrently.
- Modularization: Break monolithic pipelines into modular build configurations.
- Selective and incremental building: Use VCS triggers and path filters to build only affected modules. Use build fingerprint or checksums to avoid rebuilding unchanged components.
TeamCity’s built-in features can help your team achieve several quick wins.For example, the build caches can be enabled to intelligently reuse compiled artifacts and dependencies:
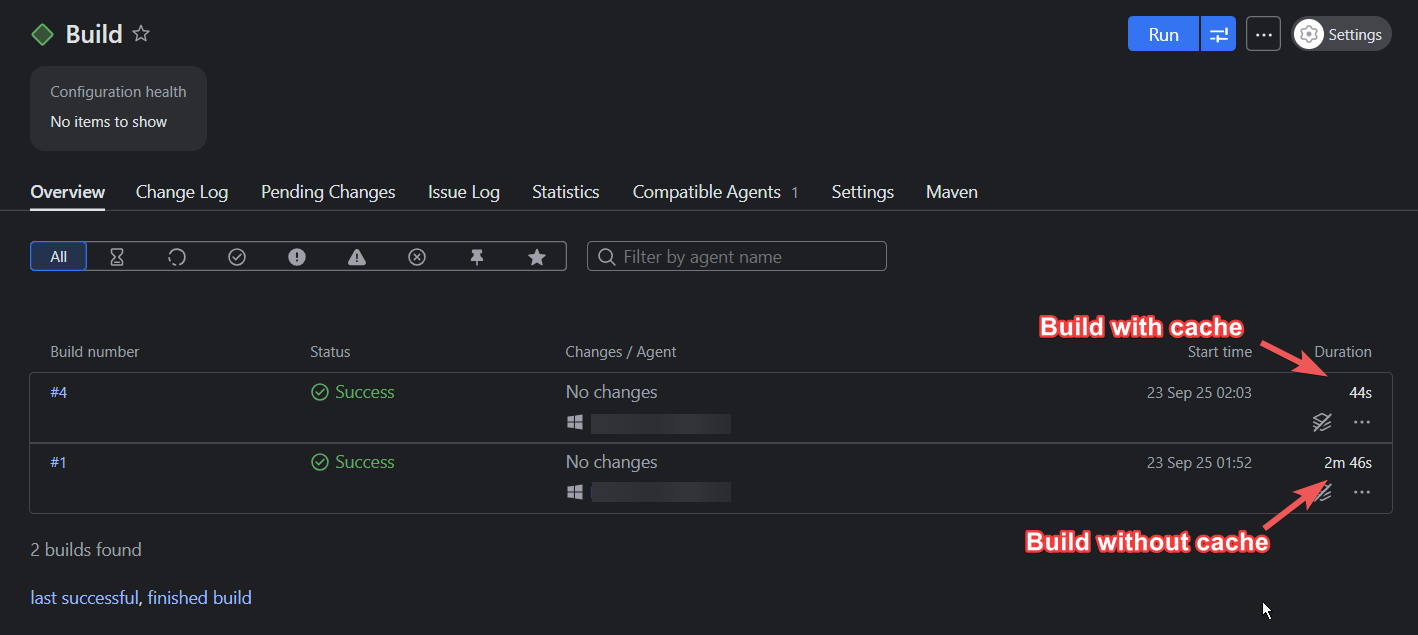
In the example above, using a build cache reduced the build time by 73 percent. (Keep in mind that the time you’ll save depends on the complexity of your build and which files you choose to cache.)
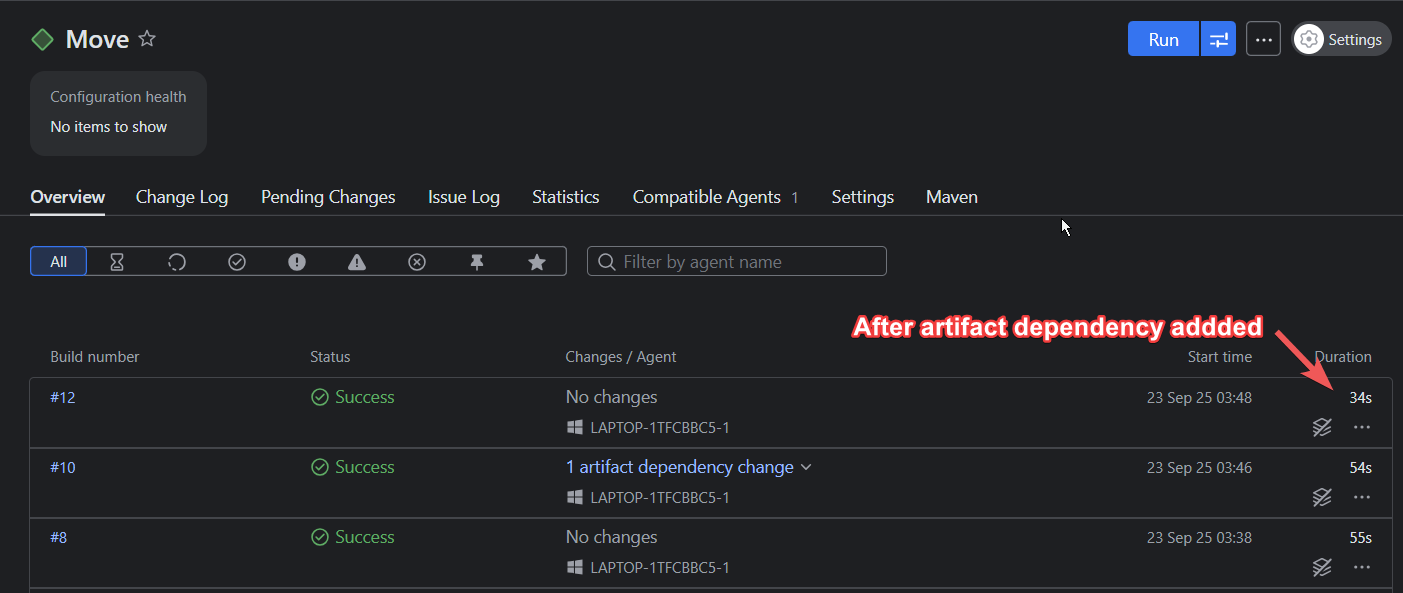
Artifact dependencies let you reuse files and curb any redundant compilation or build steps, allowing for pipeline modularization and faster executions:
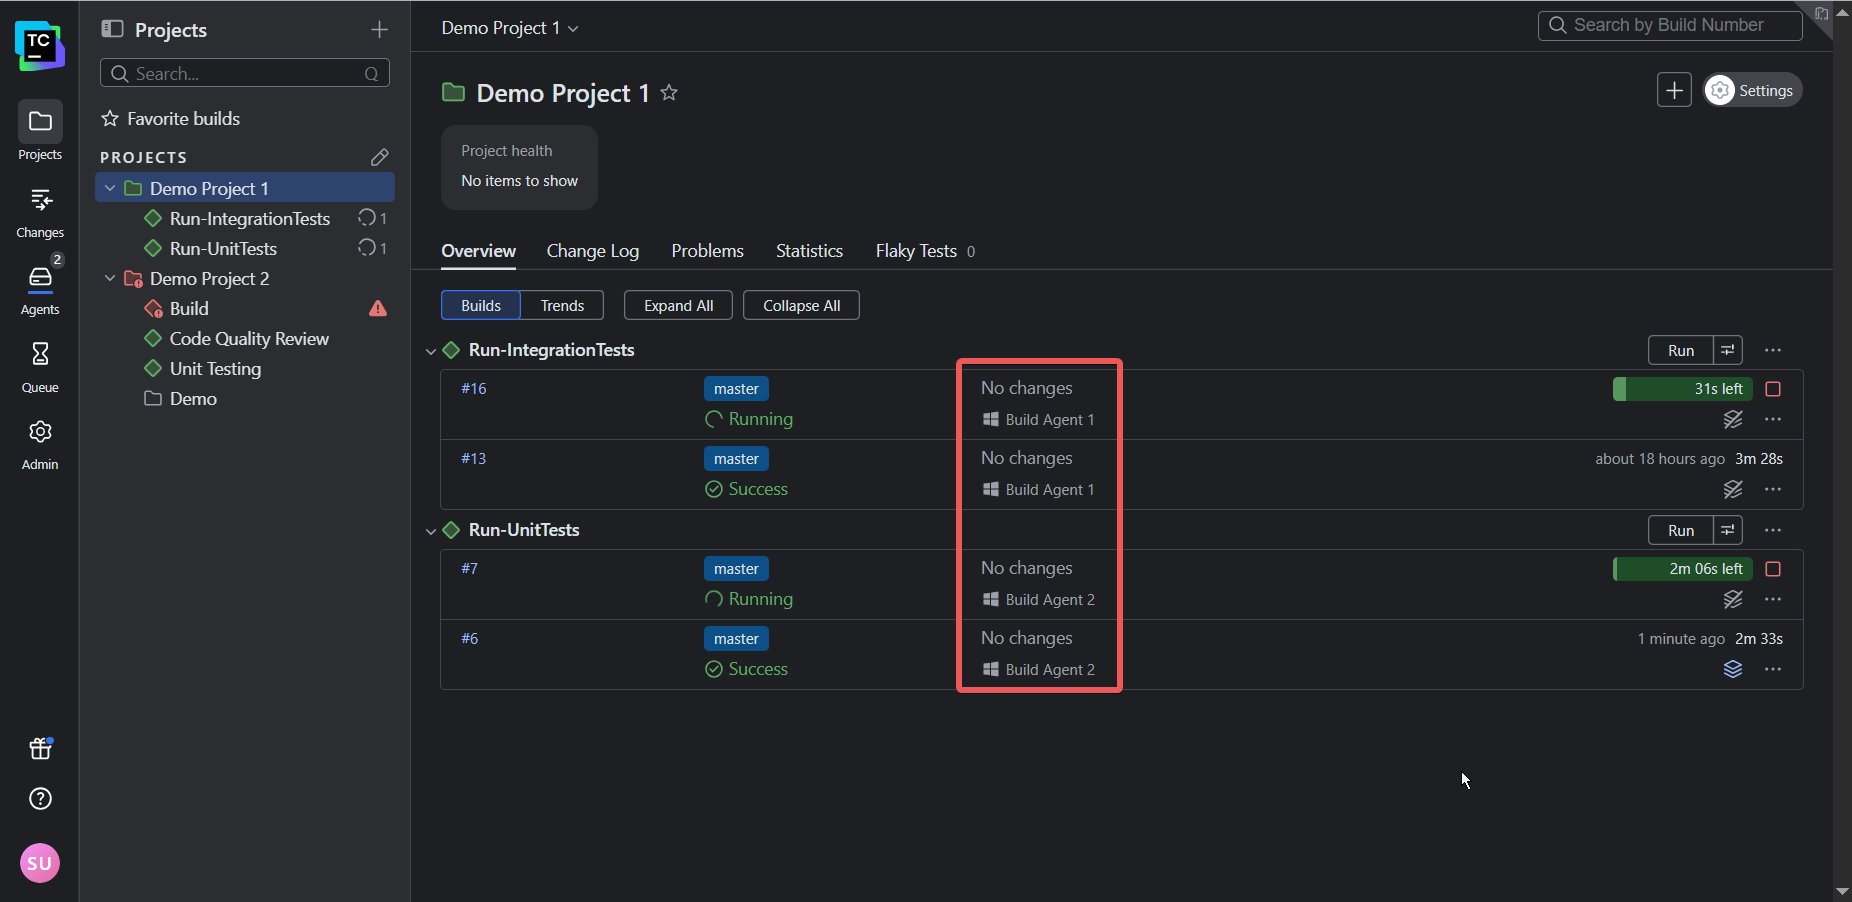
TeamCity’s architecture allows tests to run in parallel using separate build agents. So instead of two (or more) builds running consecutively, they’ll run simultaneously, providing faster feedback to developers and thus shortening the release cycle:
Phase 3: Continuously improve
Performance is not a one-off fix; it must be continually monitored and sustained as your team and codebase scale.
Keep the following three considerations in mind to ensure continuous improvement:
- Use elastic infrastructure that can scale up to meet peak demand and scale down to save costs.
- Design pipelines that only build what has changed to speed up builds.
- Create a culture of performance: Empower your team with the necessary visibility and tools to track trends, catch regressions, and implement improvements.
TeamCity supports continuous improvement, regardless of your scale. Its cloud profiles let you manage cloud agents on AWS, Azure, or GCP so you can scale infrastructure up and down to meet demand.
When it comes to orchestration, you can use features like snapshot dependencies to create build chains that only build the components impacted by change, which is crucial for managing microservices architecture and speeding up builds. Build templates, on the other hand, allow your team to define a configuration once and apply it across multiple projects, which simplifies updates and maintenance.
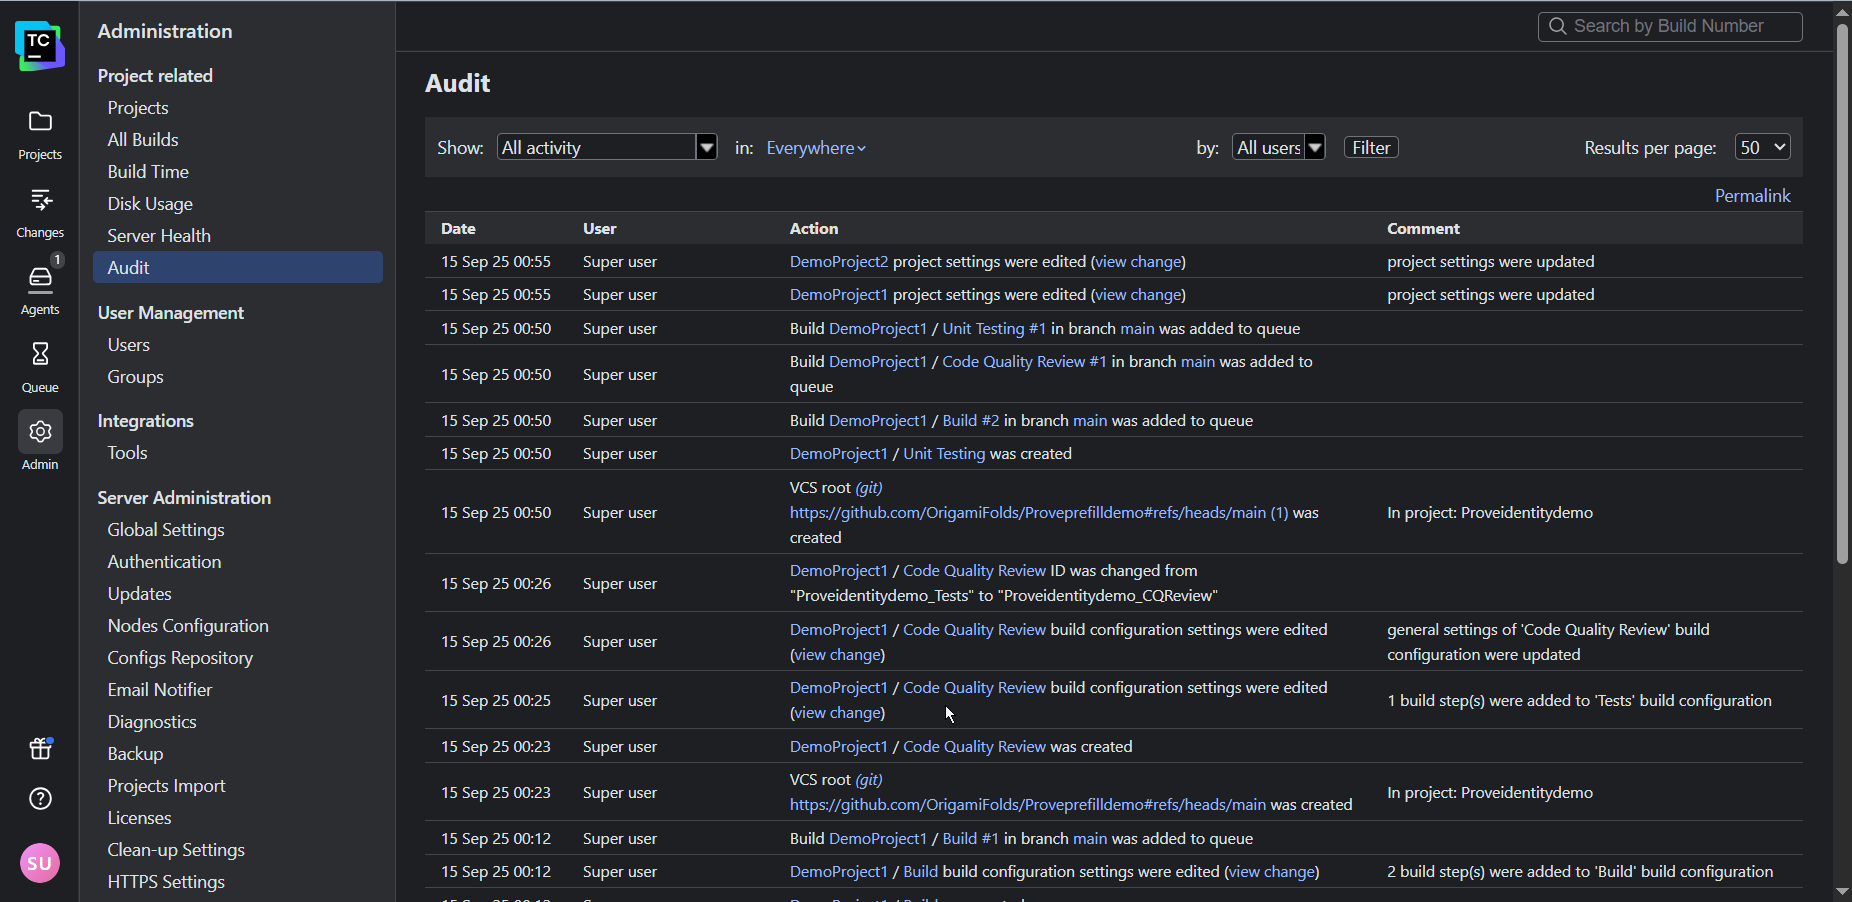
Finally, TeamCity’s audit log and historical performance reports offer the transparency and accountability needed for a performance-oriented culture by letting you track changes and share successes with stakeholders.
You can even use TeamCity’s REST API to export data into external tools such as Grafana and Excel to present to stakeholders.
Conclusion
Implementing meaningful change is not always easy. However, by identifying and addressing performance bottlenecks and measuring progress, you and your team will be rewarded with visible improvements in product output and quality. Use this positive feedback to maintain your momentum.
While addressing process bottlenecks is crucial to improving performance, the tools your team uses also shape the way they work. Legacy CI/CD tools that require extensive customization, external plugins, and specialized expertise often hinder performance because they keep teams stuck in ineffective workloads.
If you’re secretly wondering whether your CI/CD setup is holding back your team, be sure to check out the following resources:
- Is your CI/CD tool helping or hindering performance?
- The migration decision framework: Quantify the risk of your legacy system to determine whether migration is worth consideration or not.