TeamCity
Powerful CI/CD for DevOps-centric teams
Is Your CI/CD Tool Helping or Hindering Performance?

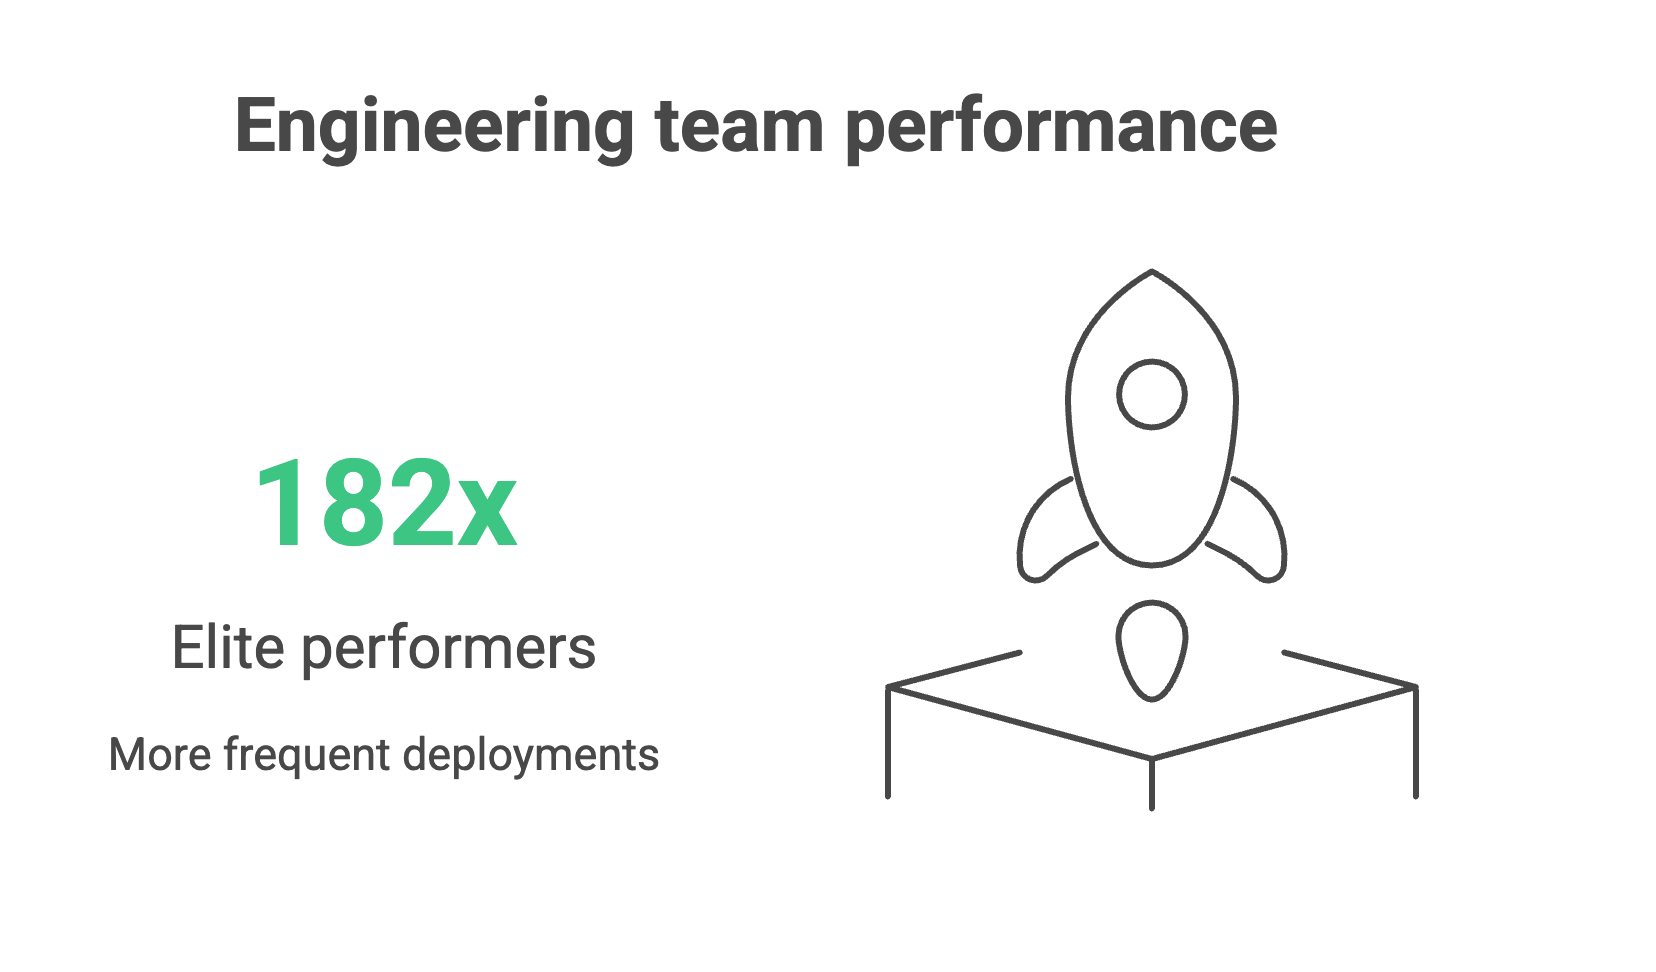
Every engineering leader would love to work with a team of elite performers who deploy 182x more frequently, recover from failures 2,293x faster, and achieve 127x faster lead times than low performers. (Yes, that’s the actual difference in performance of real teams from the 2024 DORA research report).
But how do you improve your team’s performance if you’re nowhere near the elite?
If you’re benchmarking against the four DORA metrics – deployment frequency, lead time for changes, change failure rate, and mean time to recovery – you’ll notice that bottlenecks tend to come from a combination of three things: people, processes, and tooling.
While teams tend to tackle process issues first, and rightly so, engineering leaders should ask whether their teams have the right tools to do their job well.
In fact, the root cause of several process and culture issues often stems from your tooling.
Your CI/CD platform shapes how teams work and how they feel about that work, which in turn affects your organization’s capacity for innovation and risk management. Manual configurations, brittle plugin ecosystems, and limited observability make it difficult to achieve strong DORA scores, regardless of how talented or motivated your teams are.
Teams can spend up to half of their effort maintaining tooling instead of delivering value, creating a “technical debt tax” that grows with every release cycle.
Modern CI/CD platforms with built-in automation, intelligent resource management, and comprehensive observability free engineers to focus on business logic and innovation, creating a compound advantage over time.
This article unpacks how your tooling affects each of the DORA metrics to help you determine whether your CI/CD setup is helping or hindering your team’s performance.
Deployment frequency: The velocity indicator
Deployment frequency measures how often application changes are deployed to production. In other words, how quickly can your teams get value into the hands of customers?
Why it matters
Elite performers deploy to production multiple times per day, while low performers manage only once a month or even less.
Organizations deploying multiple times per day can respond to customer feedback in hours, not quarters. They can experiment with features, validate market hypotheses, and pivot based on real user behavior while competitors plan their next monthly release.
Even if you don’t deploy daily, small, frequent deployments also reduce risk and build customer trust through continuous improvement rather than disruptive “big bang” releases.
Tooling’s impact on deployment
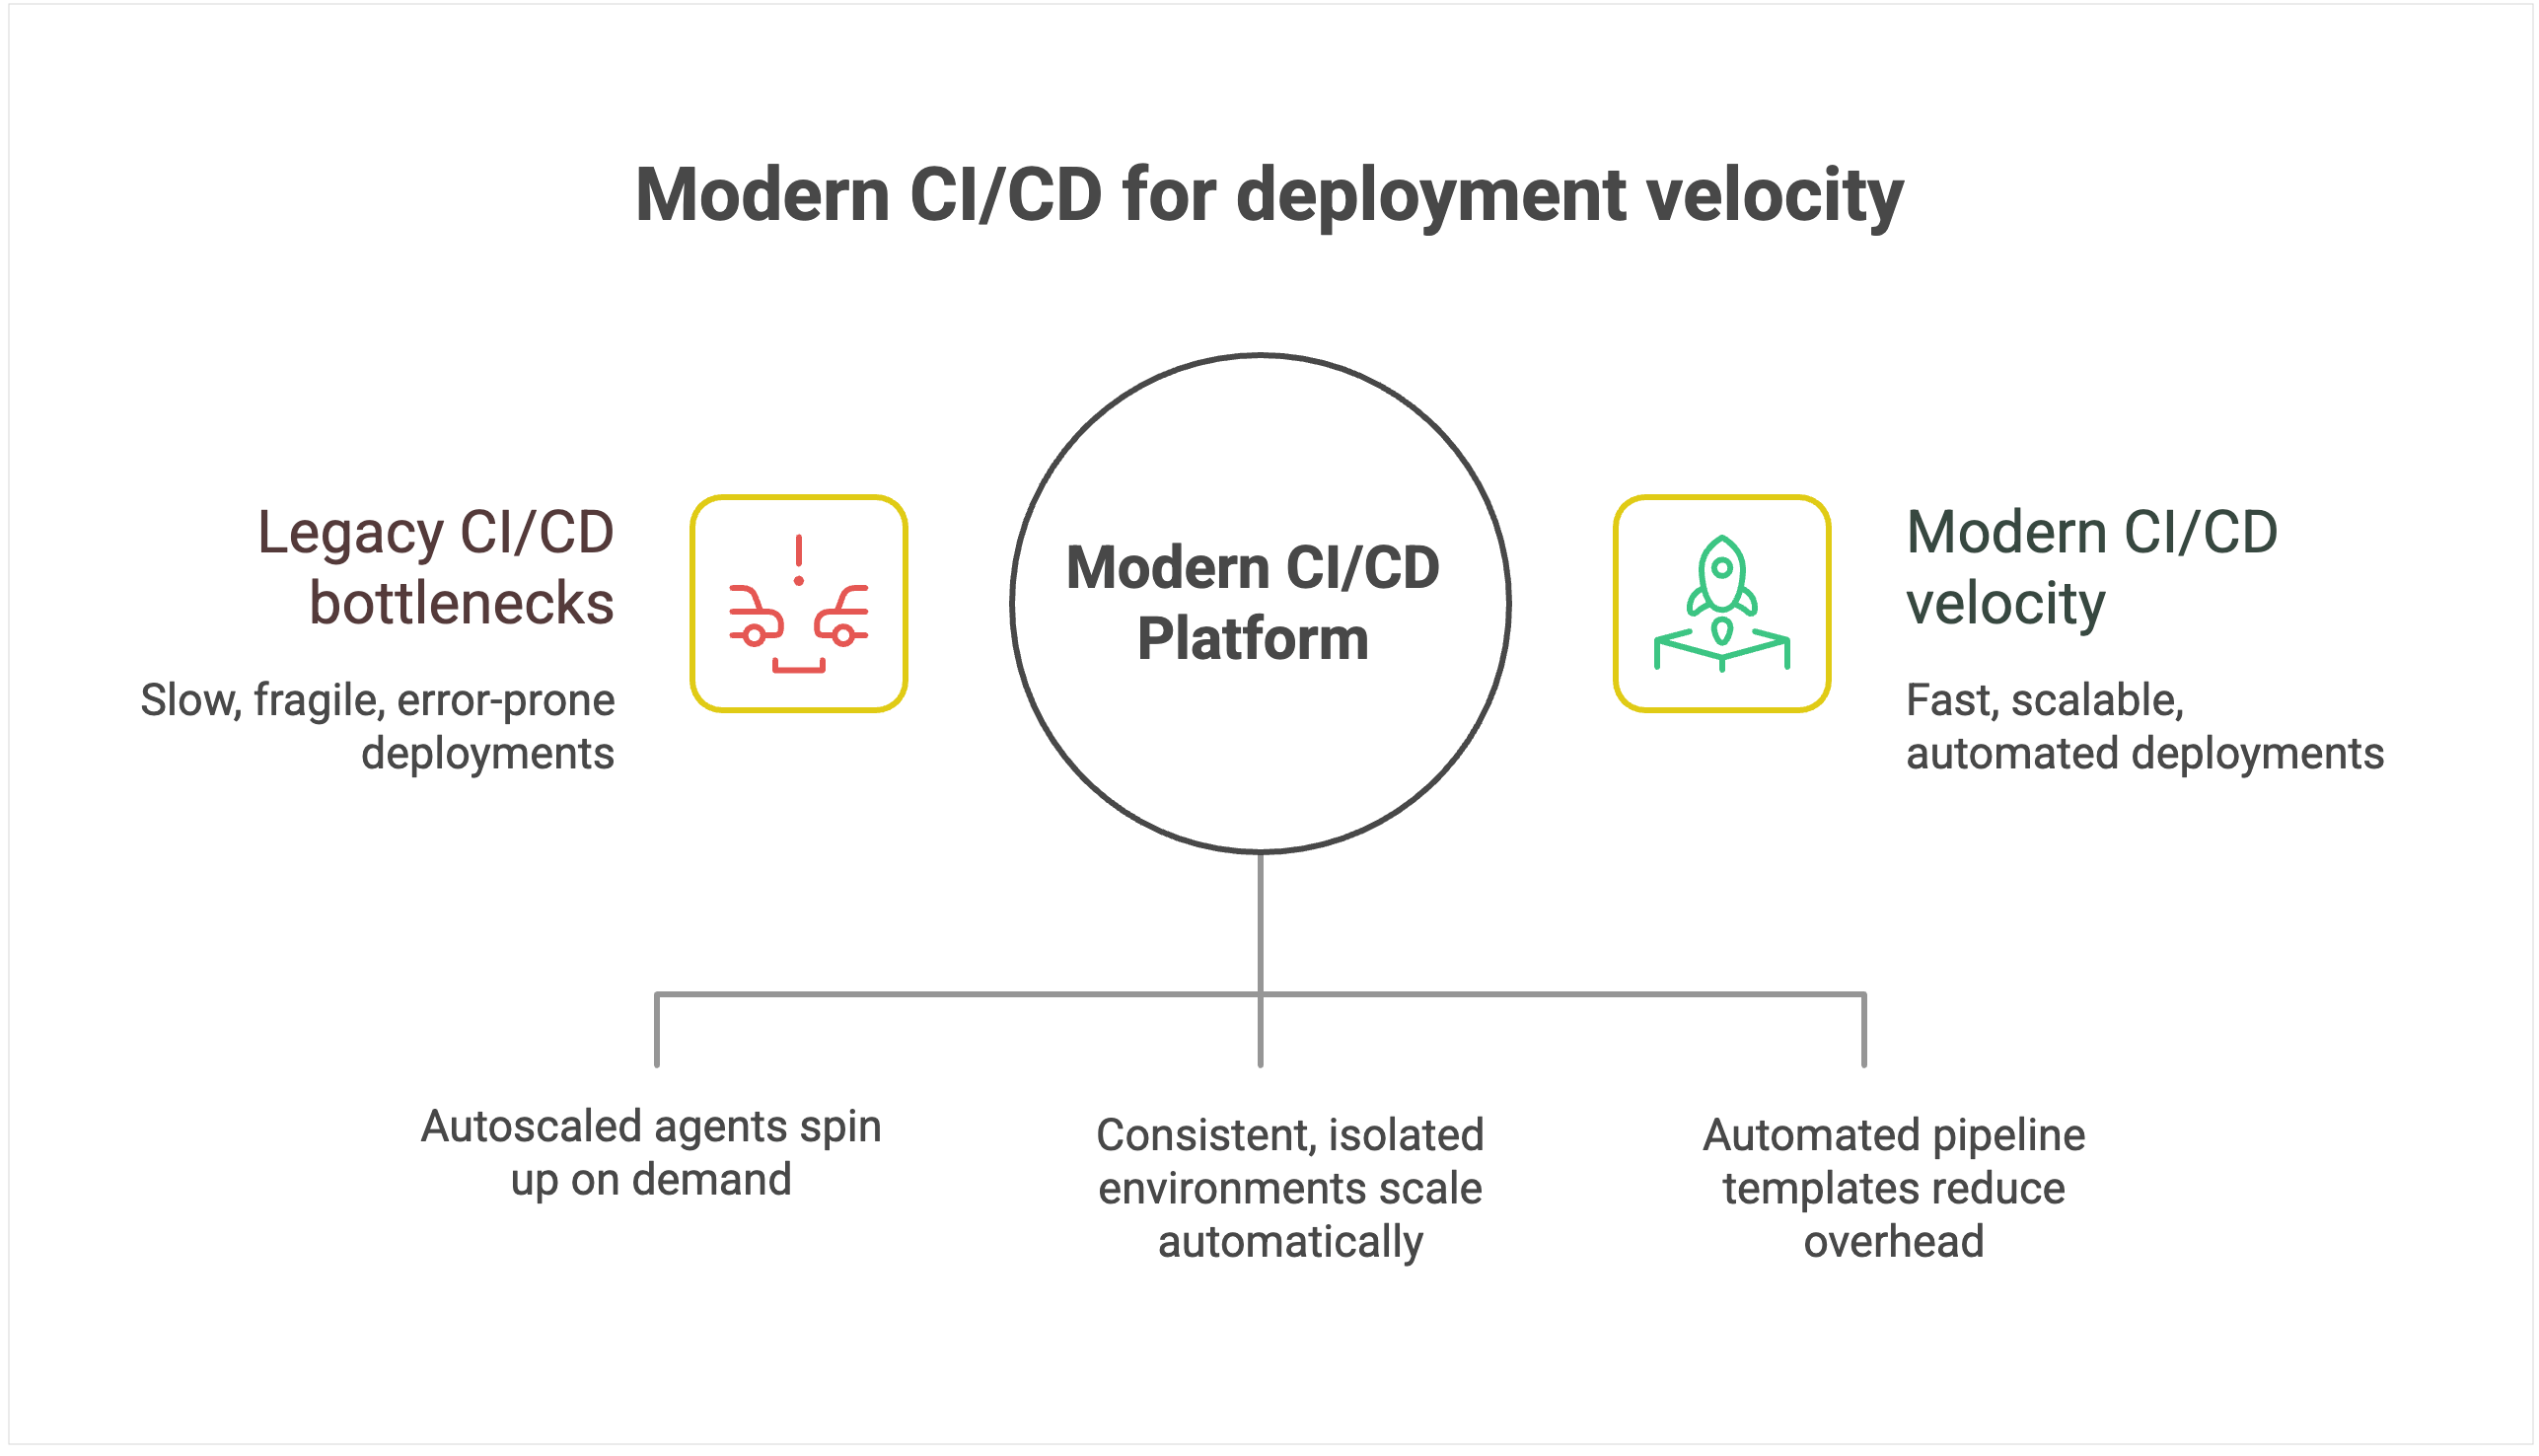
Legacy CI/CD systems create an invisible ceiling on deployment velocity because their architecture introduces scaling bottlenecks. They were designed around static servers, long-lived agents, and plugin ecosystems, which is fine for a handful of apps but fragile when hundreds of pipelines and contributors pile on.
As you scale, build jobs start queuing behind overloaded agents, plugin dependencies break under version mismatches, and pipelines stall while engineers debug infrastructure instead of shipping code. Even as you add more developers, deployment throughput plateaus because the underlying tool can’t keep pace.
Environmental management limitations amplify the problem. Legacy systems typically operate on static environments, which suffer from configuration drift and resource contention as more teams share them.
Conflicts that should be isolated instead spill across projects, forcing serialized releases and rework. What should be a smooth, automated pipeline turns into an error-prone coordination exercise.
Modern CI/CD platforms with configuration as code and automated pipeline templates dramatically reduce maintenance overhead, allowing teams to provision new deployment pipelines in minutes rather than days.
For instance, TeamCity offers ephemeral, autoscaled build agents that spin up on demand in containers or cloud instances, then shut down cleanly when idle.
💡 Read more: Hosting Build Agents in Cloud
Intelligent environment orchestration with containerization support eliminates resource contention. Teams get on-demand access to consistent, isolated environments that scale automatically.
For example, TeamCity runs each build in an isolated container, with configuration declared in version-controlled Kotlin DSL, eliminating drift and ensuring consistency across runs.
Furthermore, smart resource allocation and parallel processing can optimize utilization during peak periods, while built-in scalability handles enterprise growth without degrading performance. This enables the platform to scale transparently while maintaining deployment velocity.
Lead time for changes: From code to customer value
While deployment frequency tells you how often you deliver, lead time for changes shows you how fast. It measures the duration from the moment the code is committed to when it’s running in production.
Why it matters
Elite performers achieve lead times of less than one hour, while low performers require between one week and one month to get code from commit to production.
Reduced lead time means faster time to market for new features and immediate response to competitive pressures. When a critical bug is discovered or a market opportunity emerges, organizations with hourlong lead times can respond the same day, while those with weeklong lead times watch opportunities pass by.
For development teams, shorter lead times create a virtuous cycle of productivity. Developers get faster feedback on their changes, can iterate more quickly, and spend less time context-switching between different features.
Tooling’s impact on lead time
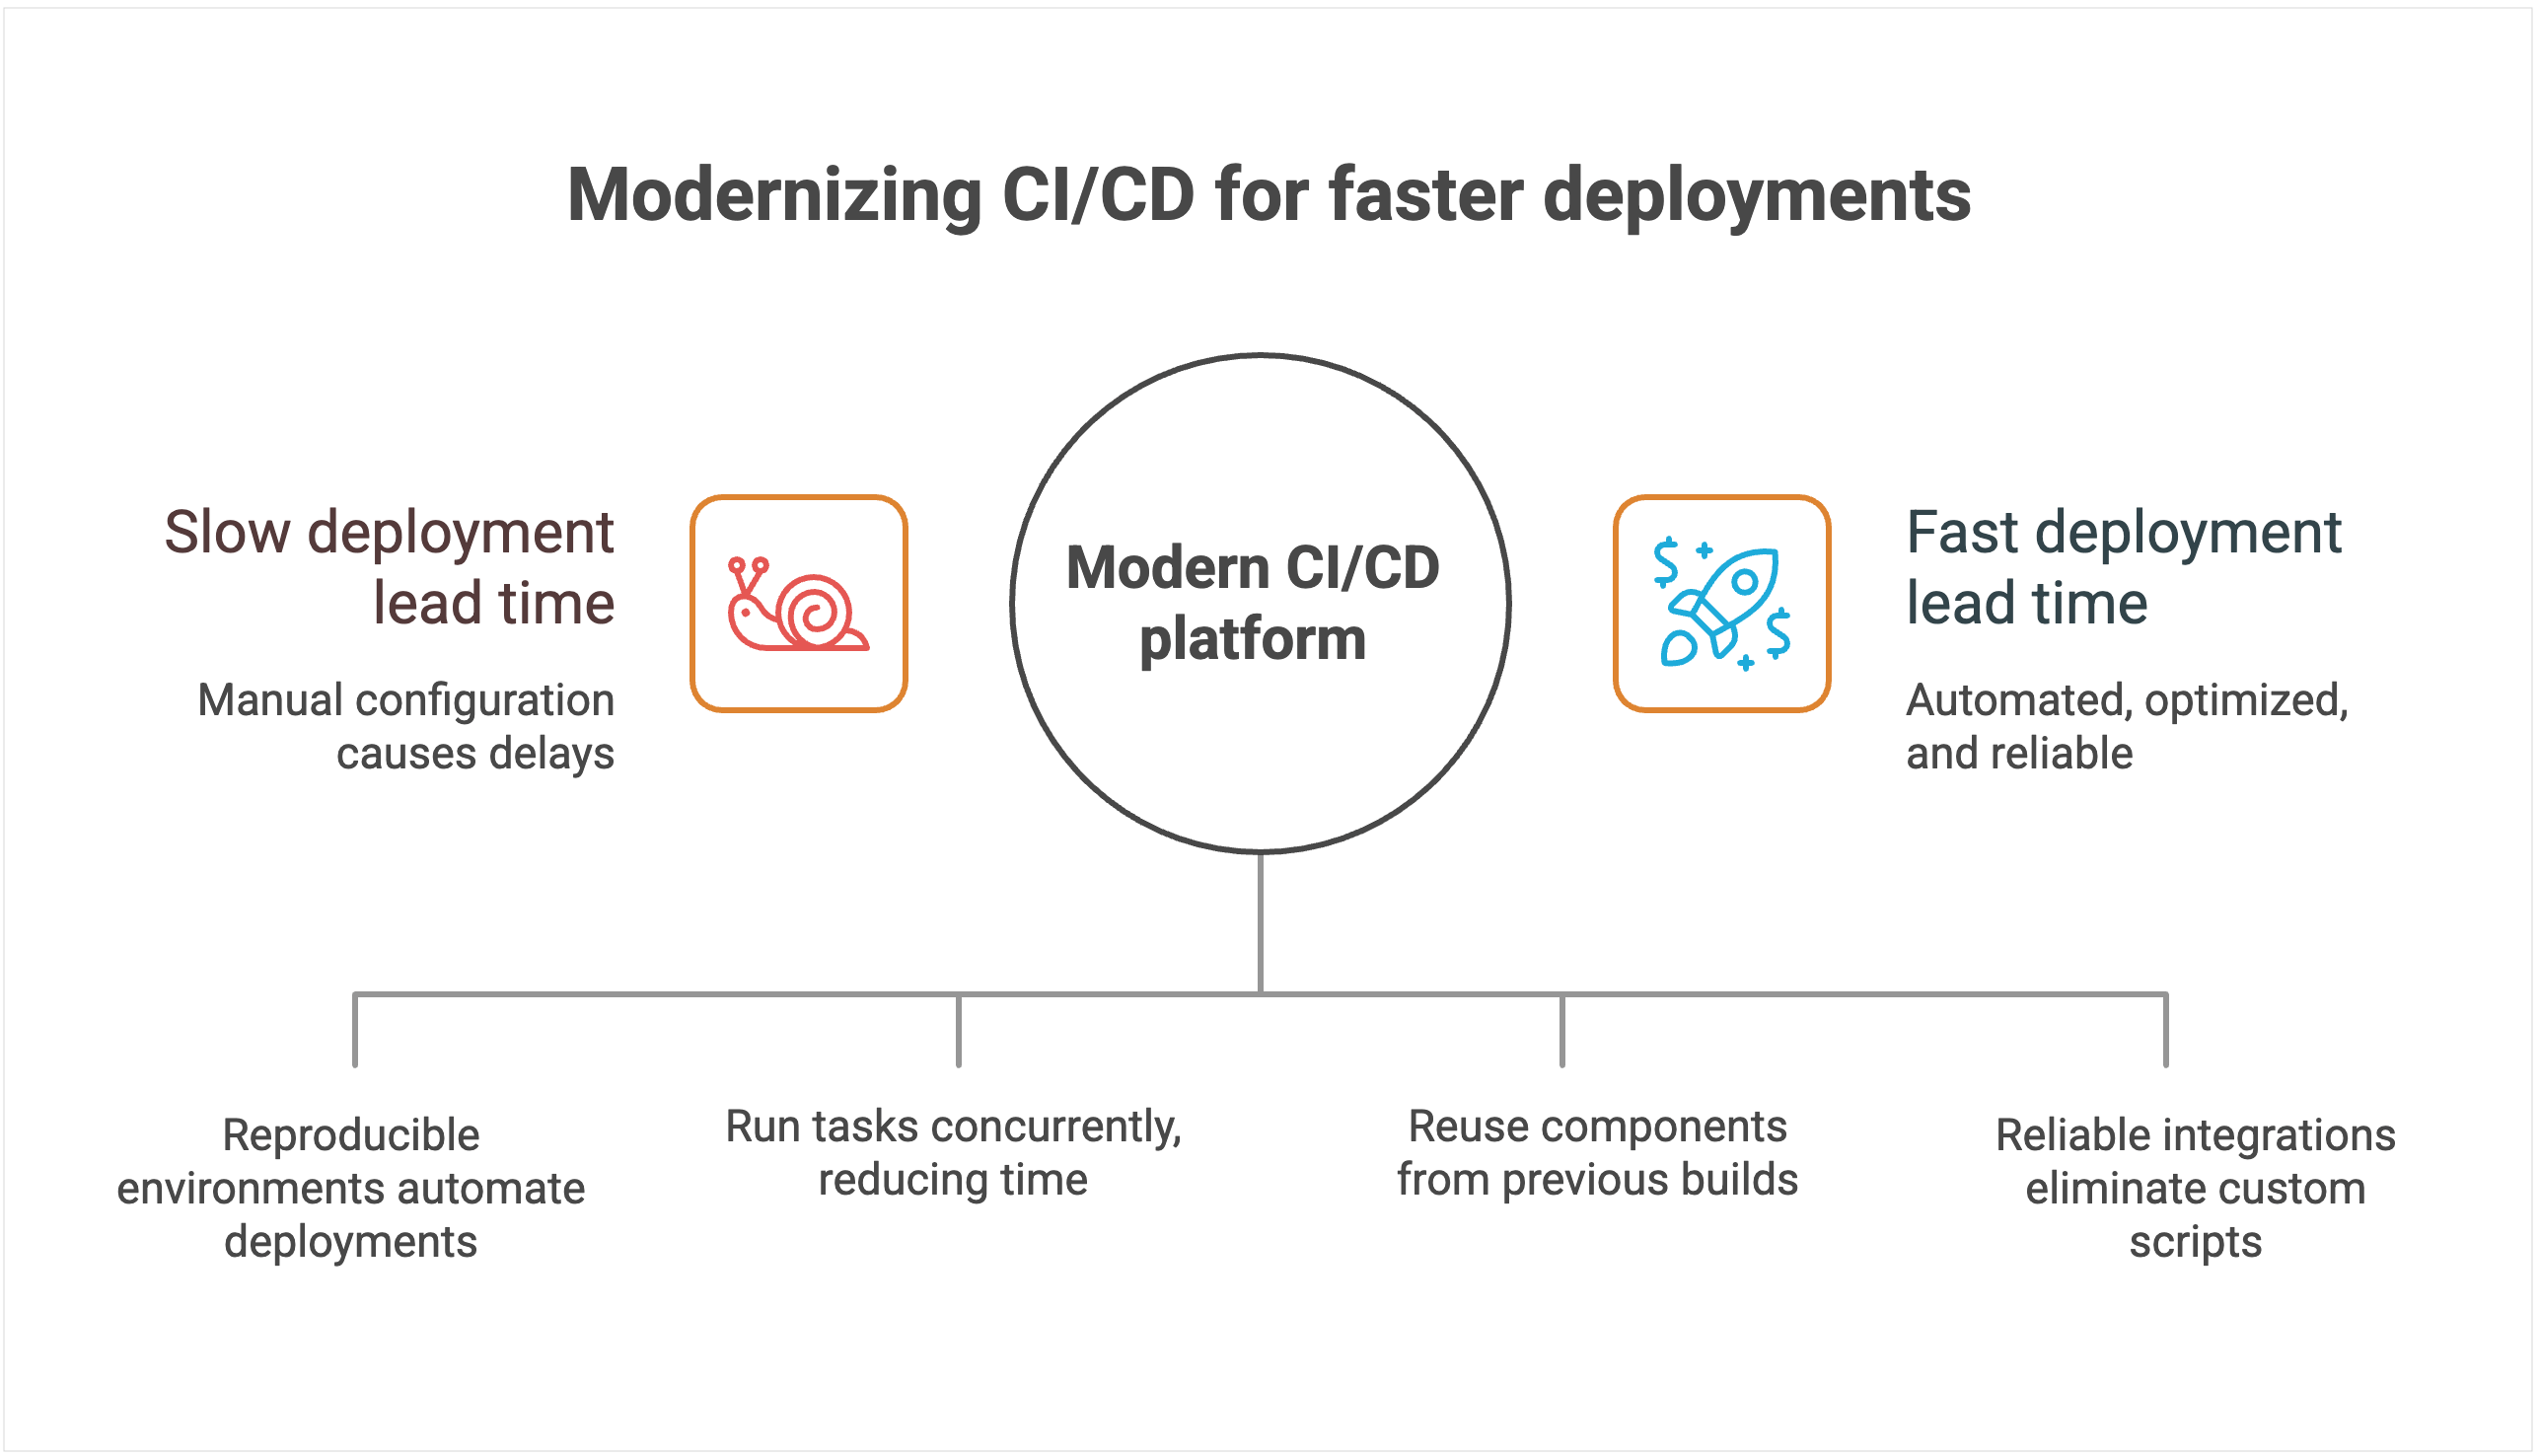
CI/CD systems with manual configuration management create delays and increase the chances of human error. Each deployment often requires someone to manually verify settings, update configurations, and troubleshoot inevitable issues that arise from inconsistent environments.
Heavy reliance on custom scripts and plugins stretches lead time even further. New features or compliance requirements often demand bespoke scripts, which then have to be debugged, reviewed, and maintained.
Pipelines break whenever dependencies change or plugins fall out of sync, forcing developers to stop feature work and fix tooling instead. Instead of commits flowing quickly into production, changes queue up behind brittle automation, extending lead time and making delivery unpredictable.
The lack of intelligent resource allocation compounds these problems. Build queues grow during peak usage periods, forcing teams to wait for available resources. Without smart scheduling and parallel processing capabilities, even simple changes can sit idle for hours while the system processes other jobs sequentially.
💡Read more: Solving the CI/CD Build Queue Bottleneck Problem
By contrast, modern platforms use declarative configuration and environment-as-code principles. Deployments land in reproducible environments automatically, cutting out manual checks and accelerating lead time.
Modern platforms are also architected to minimize lead time through intelligent automation and resource optimization.
For instance, TeamCity’s advanced parallel processing capabilities automatically identify opportunities to run tasks concurrently, dramatically reducing total pipeline execution time. Instead of waiting for sequential steps to complete, multiple processes run simultaneously whenever dependencies allow.
Native dependency management and intelligent caching eliminate redundant work. The platform automatically identifies which components have changed and which can be reused from previous builds, significantly reducing build times for incremental changes. This intelligence extends to test execution, where only relevant test suites run based on code changes.
Seamless integrations with modern development tools eliminate the custom scripting overhead. Instead of maintaining brittle connectors between disparate tools, teams get native integrations that work reliably without needing ongoing maintenance. Smart resource allocation and cloud bursting capabilities prevent queue delays by automatically scaling compute resources during peak usage periods.
Change failure rate: Quality under pressure
Shipping faster is only an advantage if your releases are reliable. Change failure rate measures the percentage of deployments that require immediate remediation, whether through hotfixes, rollbacks, or patches. It captures both engineering quality and business risk.
Why it matters
Elite performers achieve change failure rates of 0–15 percent, while low performers experience 30 percent or higher failure rates.
Each deployment failure carries significant business costs beyond the immediate technical impact. Industry estimates suggest that application downtime costs IT enterprises an average of $5,600 per minute. Beyond direct revenue loss, each failed deployment results in lost customer trust.
The operational costs of failed deployments also compound quickly. Engineering teams must context-switch from planned work to emergency remediation. Customer support teams field complaints and escalations.
Sales teams face difficult conversations with prospects and existing customers. The ripple effects of a single deployment failure can impact organizational productivity for days.
Also, high change failure rates create a culture of fear around deployment. Teams become risk-averse, deploy less frequently, and accumulate technical debt. This defensive approach makes the system more fragile and failures more catastrophic when they do occur.
Tooling’s impact on quality
CI/CD systems with limited native-testing-integration capabilities force teams to rely heavily on third-party plugins and custom integrations. Each plugin introduces potential failure points, version-compatibility issues, and maintenance overhead that can compromise testing reliability.
Manual testing orchestration creates dangerous gaps in coverage and consistency. Without automated test selection and execution based on code changes, teams either run exhaustive test suites that slow deployment, or they skip critical tests that could catch failures.
To add to that, the human element in test coordination introduces variability. What gets tested depends on who’s managing the deployment and how much time pressure they’re under.
Systems without sophisticated rollback mechanisms create further issues when failures do occur. For example, rolling back might require manual intervention, custom scripts, and coordination across multiple systems. In these cases, database rollbacks, infrastructure changes, and configuration updates must be handled separately, which extends recovery time and increases the risk of incomplete remediation.
Perhaps most importantly, poor observability makes it nearly impossible to predict and prevent deployment failures. Without comprehensive monitoring and intelligent alerting, teams operate blindly, discovering problems only after customers are affected.
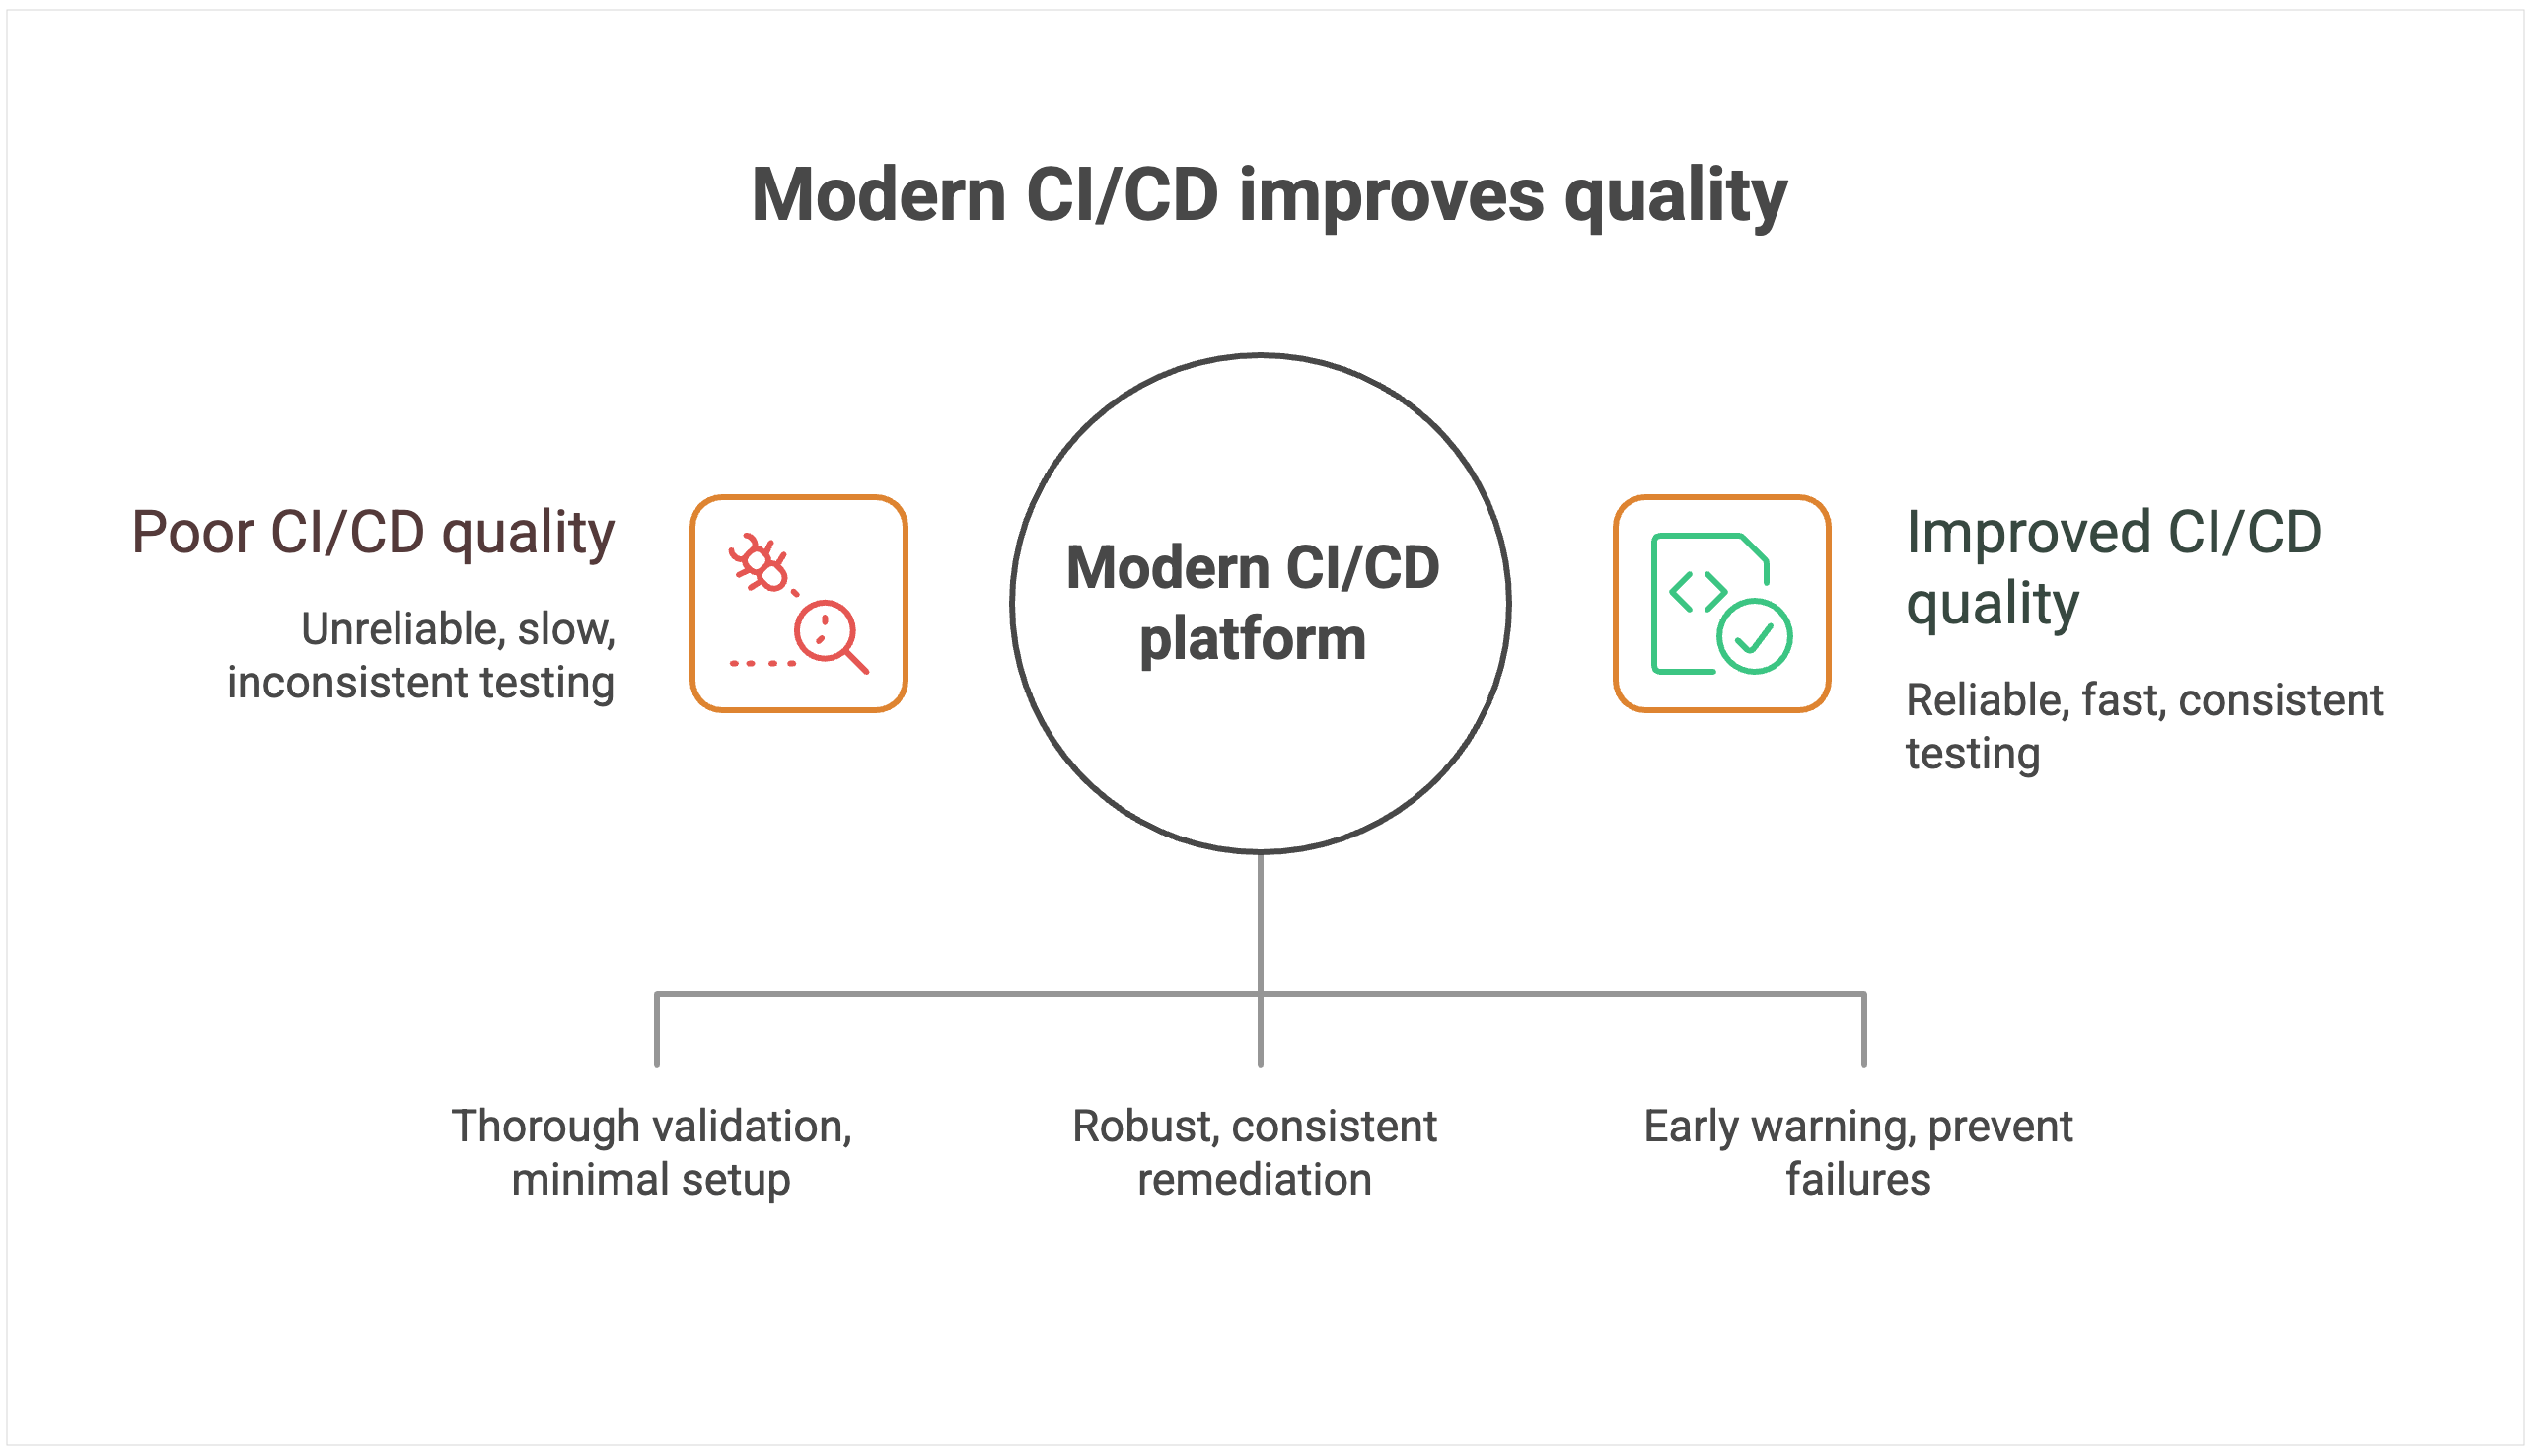
Modern CI/CD platforms treat quality as a first-class requirement, not an afterthought. Comprehensive testing-framework integration ensures thorough quality validation with minimal setup overhead. The platform is intelligent enough to automatically orchestrate appropriate test suites based on code changes, run tests in parallel to minimize time impact, and provide clear feedback on test results and coverage.
Instead of offering a one-size-fits-all rollback button, modern platforms provide the building blocks for creating robust, automated rollback workflows. That includes support for reverting not just code but also database schema changes and infrastructure configurations.
When failures occur, teams can wire these primitives into automated pipelines that trigger and coordinate rollbacks across all affected systems, ensuring complete and consistent remediation. This approach dramatically reduces mean time to recovery and minimizes the scope of customer impact.
Advanced monitoring and alerting systems provide early warning capabilities that can prevent failures from reaching production. By correlating deployment activities with system performance metrics, these platforms can detect anomalies and automatically halt deployments before they cause customer-facing issues.
Mean time to recovery: Resilience when things go wrong
Even the best teams know that failures are inevitable. What sets elite performers apart from the rest is how quickly they recover. Mean time to recovery (MTTR) measures the average duration required to restore service when a deployment goes wrong.
Why it matters
The difference in performance for MTTR is stark: Elite performers restore service in less than one hour, while low performers require between one week and one month to fully recover from deployment-related incidents.
MTTR capability determines your organization’s overall resilience and risk profile. Faster recovery protects revenue by minimizing downtime costs, preserves customer trust by demonstrating operational competence, and safeguards brand reputation by preventing minor incidents from becoming public relations disasters.
Organizations with elite MTTR performance can take calculated risks and deploy more frequently because they have confidence in their recovery capabilities.
Tooling’s impact on recovery
CI/CD systems that turn incident response into a manual, error-prone process extend downtime. Manual rollback calls for custom pipeline scripts and plugin coordination, which introduces complexity and risk precisely when teams need speed and reliability.
Limited visibility into pipeline execution makes root cause identification painfully slow. Without comprehensive logging, distributed tracing, and correlation between deployment activities and system performance, teams resort to guesswork and trial-and-error debugging. This blind troubleshooting results in extended recovery time and the increased likelihood of incomplete fixes that cause recurring issues.
The lack of automated recovery mechanisms forces organizations to rely entirely on human intervention during high-stress situations. Poor integration with monitoring and alerting systems compounds these problems by delaying incident detection. Teams often learn about failures from customers rather than proactive monitoring.
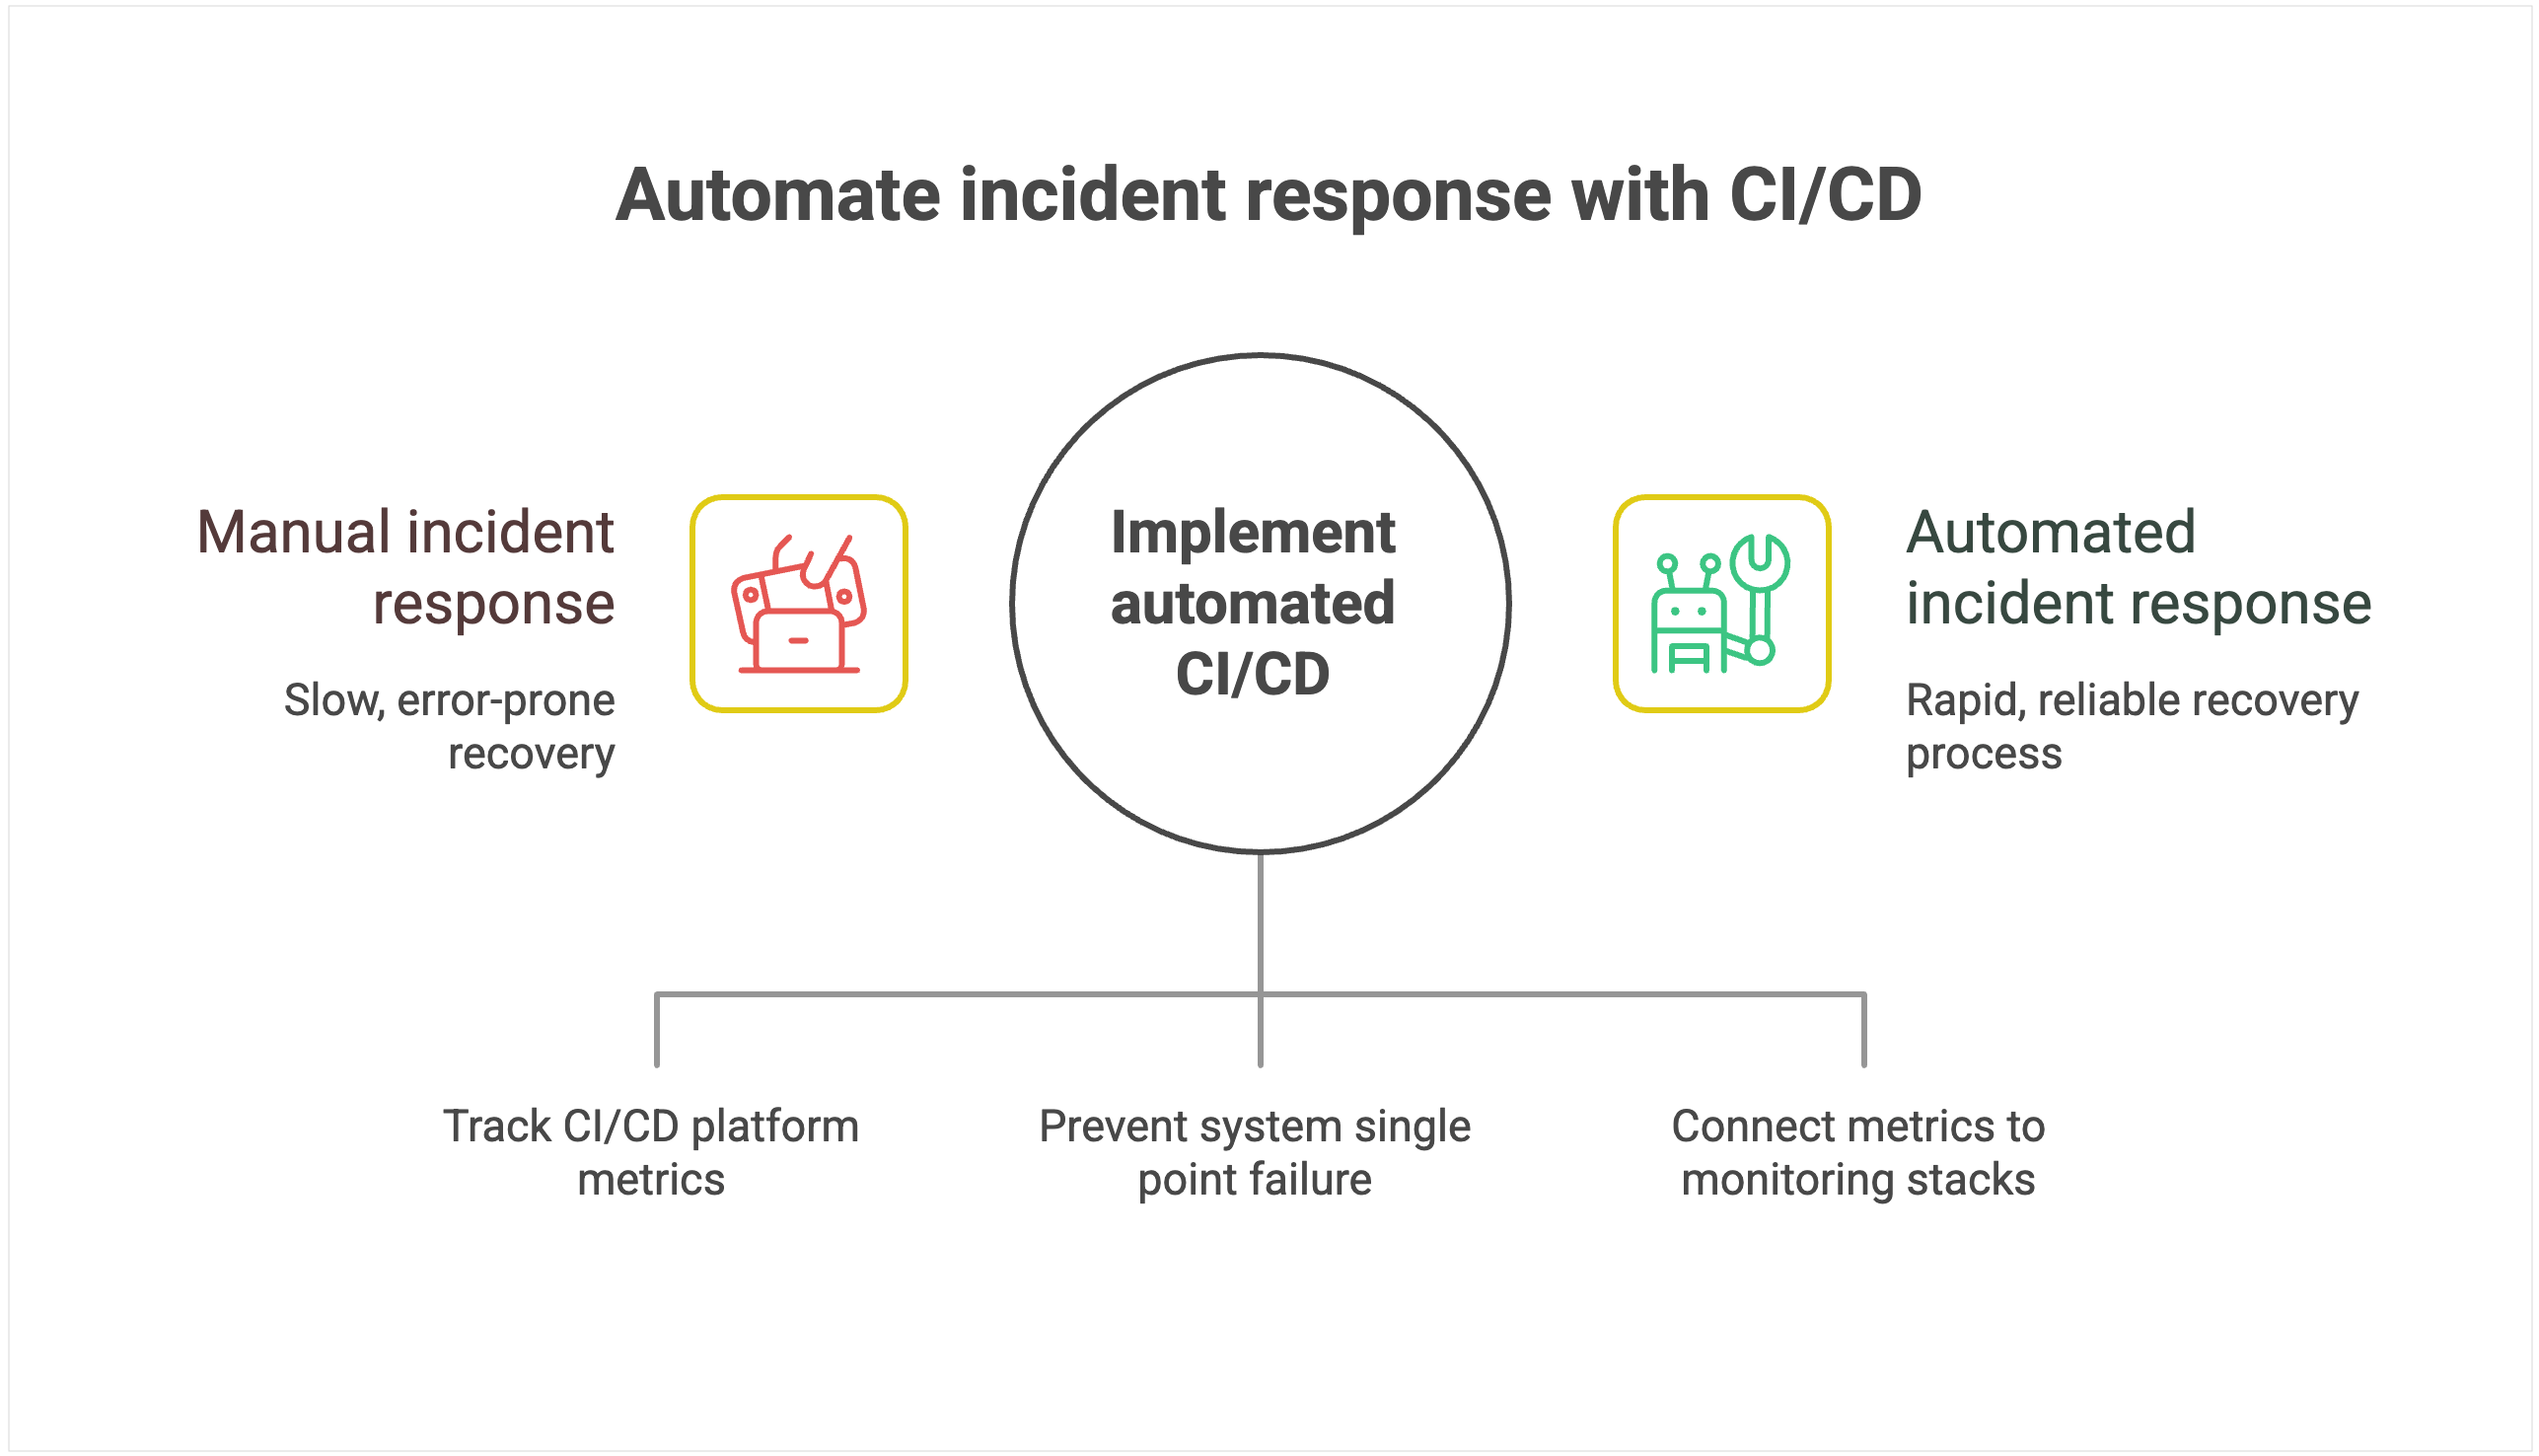
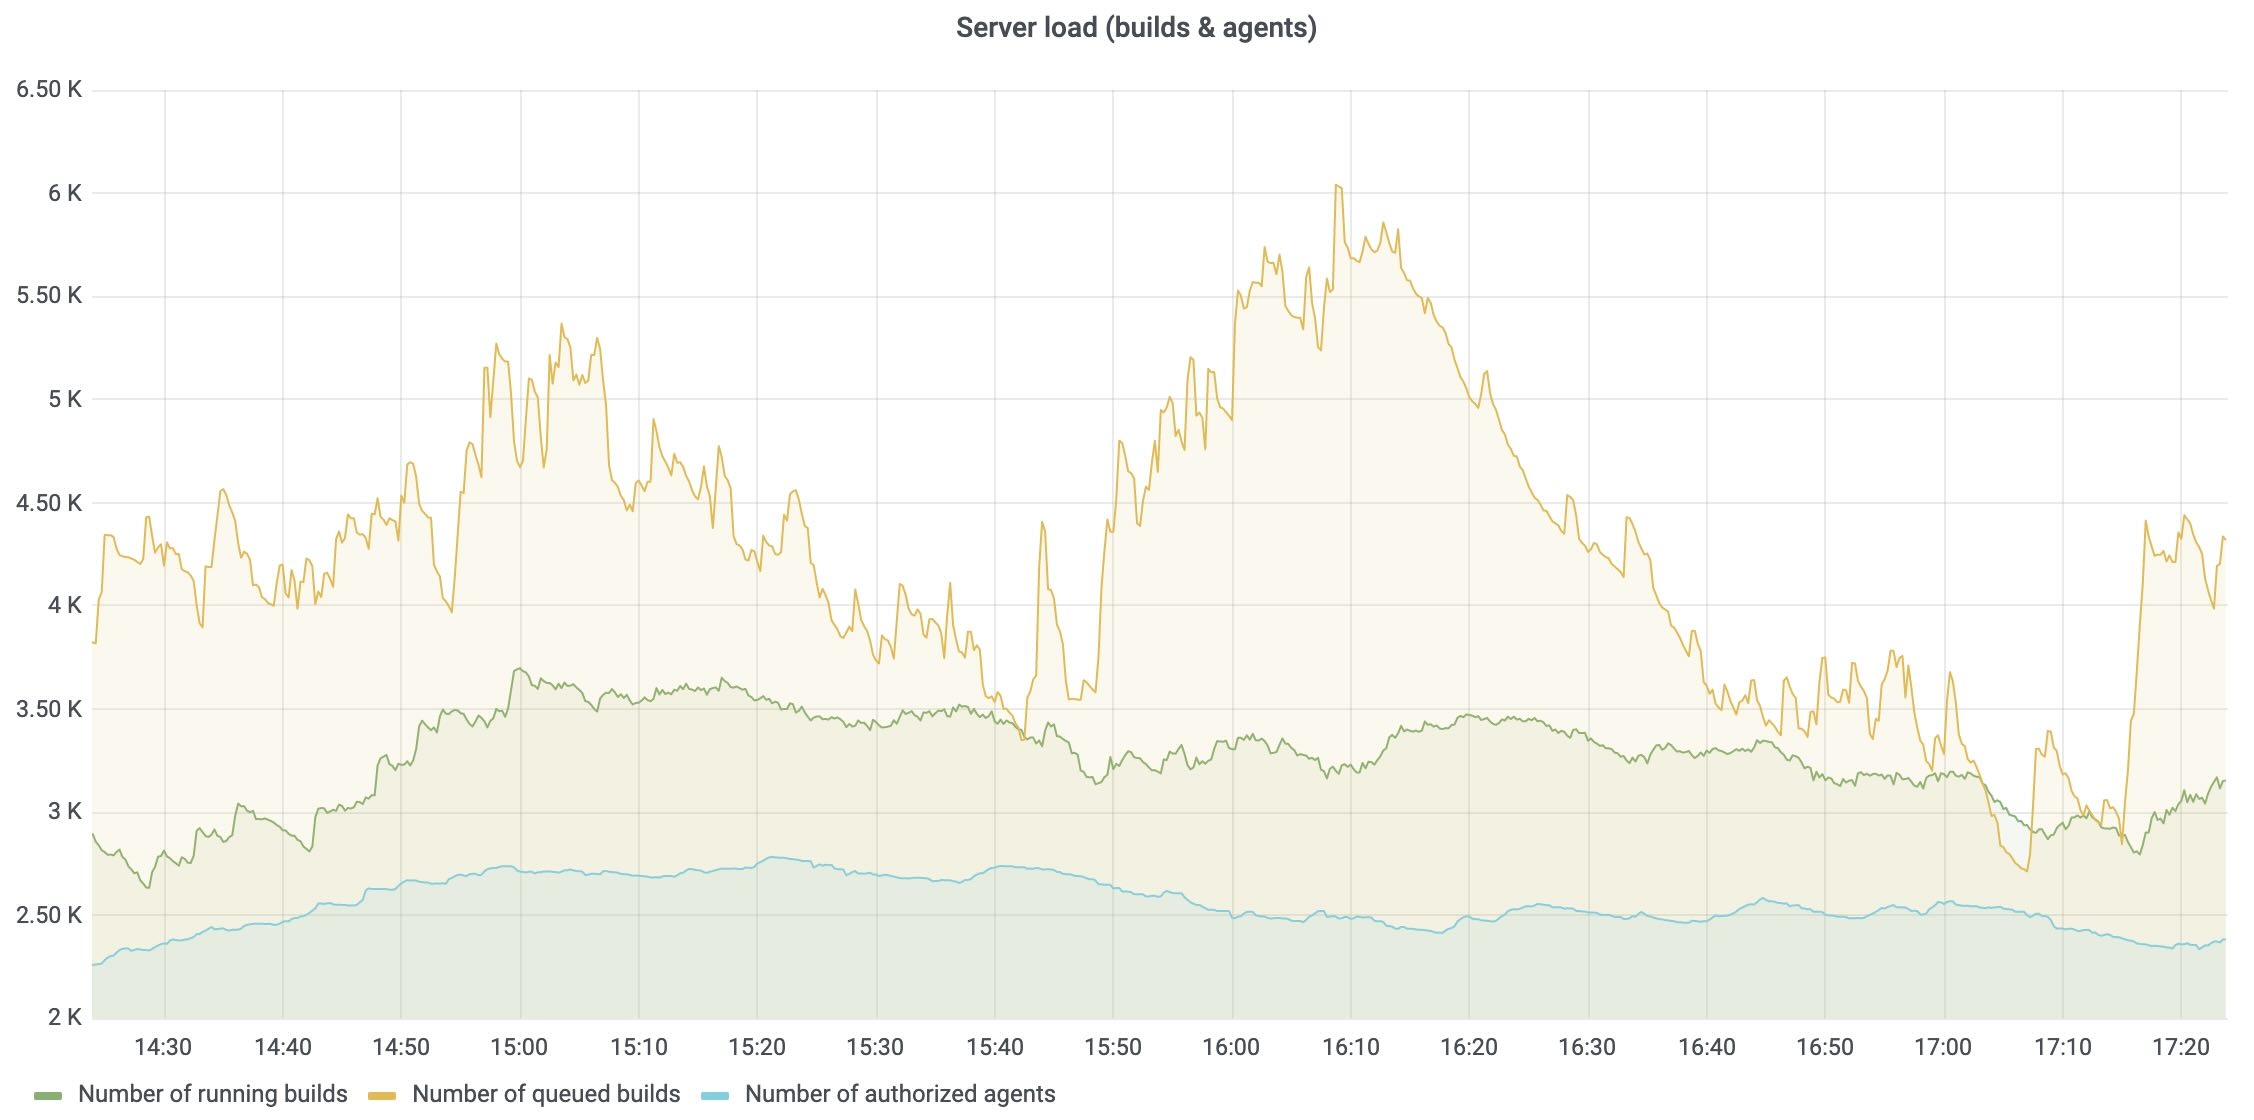
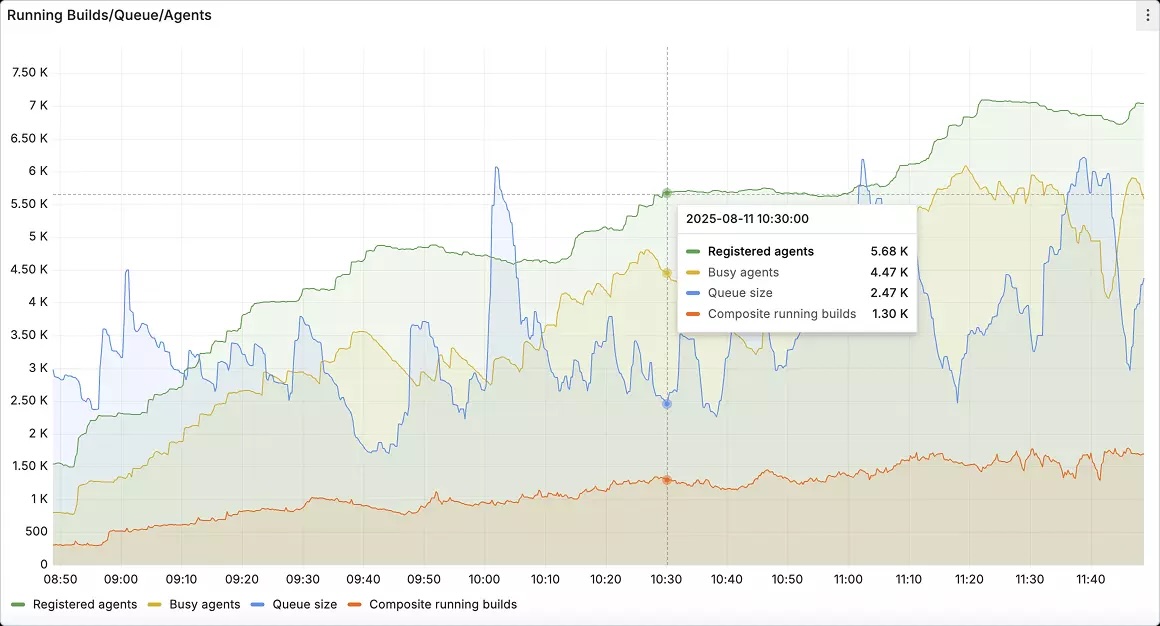
Instead, you want to use a CI/CD platform that offers automated, intelligent response capabilities. For instance, TeamCity’s built-in observability for the CI/CD platform itself tracks server load, agent utilization, build queue health, and pipeline performance. These metrics can be exported to Prometheus and visualized in Grafana so that platform teams can monitor their CI/CD backbone alongside application and infrastructure metrics.
Most modern CI/CD platforms are built with high availability in mind, using multinode configurations and automated failover mechanisms to prevent the system itself from becoming a single point of failure.
This resilience means that even during incidents, the deployment system remains operational, allowing teams to focus on recovery without worrying about the platform going down simultaneously.
Seamless integration with enterprise monitoring and alerting systems makes rapid incident detection and automated response workflows possible.
For instance, teams can connect TeamCity’s metrics to existing monitoring stacks so that anomaly detection triggers rollback procedures automatically, often before customers feel the impact.
Conclusion
CI/CD platforms that require extensive customization, external plugins, and specialized expertise increase operational overhead and introduce security risks, holding your team back.
The strategic advantage belongs to organizations that modernize their CI/CD approach with integrated platforms designed for enterprise scale and elite performance.
Even if you know your legacy solution is holding you back, at what point does it warrant the pain of migration? For some teams, the return on investment is not worth the effort.
To make an informed decision, you must quantify the risks of staying with your legacy system compared to the rewards of migration.
This article was brought to you by Kumar Harsh, draft.dev.