
Features

PHP Debugger News
Today we would like to share with you several improvements for PHP debugger we added recently. They are available in the latest Web IDE EAP build #445.
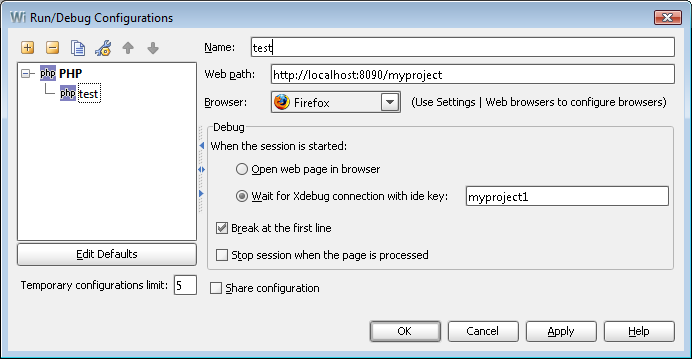
- Debug session start action. You can choose the action to be taken when debug session is started. Namely, to debug a single page, select ‘open page in browser’. Alternatively, you may want Web IDE just to listen to the incoming connection from Xdebug while you open the page manually or via script. Don’t forget to specify correct ide key (see http://xdebug.org/docs/remote#browser_session for details).
- Concurrent debugging sessions. You can even debug a page in two sessions simultaneously.
- Break at first line. You might want debugger to break on the first line of code, there’s now an option for this in debug configuration settings.
- Stop/keep session. There’s also an option to keep debug session alive after a PHP page is processed. This is useful if your main page produces links to auxiliary pages and you’d like to debug these, too.
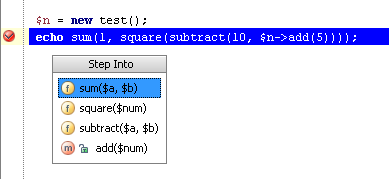
- Step into selection. PHP debugger got smart step into feature. If you have several calls in a single line you can easily select which one you want to step in!
This functionality is available in Web IDE EAP builds starting from build 445.
Happy debugging!
-JetBrains Web IDE Team
