spy-js TypeScript, CoffeeScript, ES6 Support, Advanced Search and Navigation
While WebStorm celebrates its 10th version anniversary, spy-js is proud of its third major release within this awesome IDE. Here’s a quick sneak peek at the new spy-js features available in WebStorm 10.
Source maps, TypeScript, CoffeeScript, ES6 via Babel/Traceur/etc tracing support
From day one, spy-js was capable of tracing JavaScript code execution. Later on we added ES6/ES2015 support for engines that can execute it. Now it’s time to bring some of its love to other languages compiled to JavaScript! Today I am happy to announce that the newest spy-js can trace TypeScript, CoffeeScript and ES6 code transpiled to JavaScript with Traceur/Babel (former 6to5) or any other transpiler (given it can produce the source map).
Let’s see how this can be done. I’ll use TypeScript for the example, but you can use CoffeeScript or ES6 just as easily.
First, I’ll create a simple .ts file in my empty project.
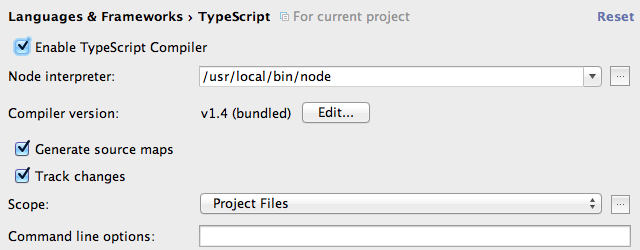
Then I will enable a new built-in TypeScript compiler (Settings | Languages & Frameworks | TypeScript), which will compile my TypeScript file to JavaScript on the fly and generate a source map as well. Please note that spy-js also works with your own file watcher/transpiler solution as long as it generates source maps.
Now, I will add index.html page and include the generated index.js as a script there.
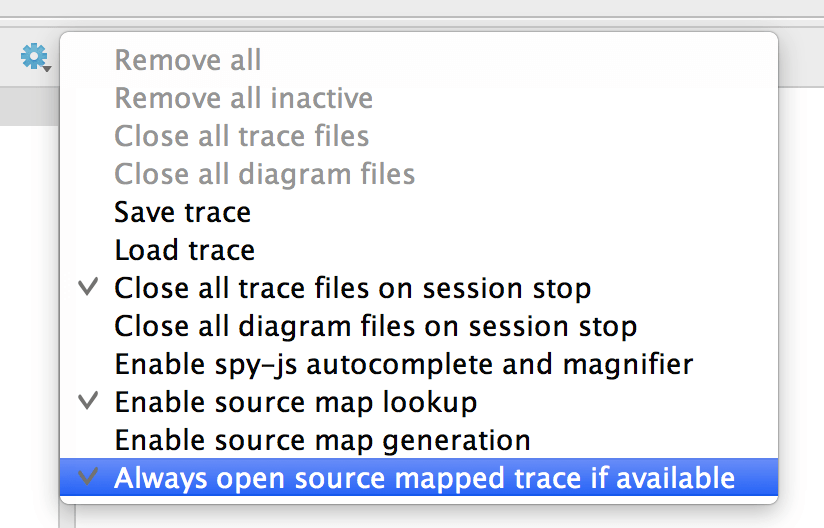
Let’s start spy-js and see the trace. After starting it, but before hitting the page in the browser, we will need to modify a couple of spy-js settings just once. The first one is to enable source maps lookup during tracing. It’s off by default to avoid impacting your tracing if you are not using source maps and are tracing just plain JavaScript. The second one (“Always open source mapped trace if available”) is optional. It’s useful when you always want to inspect the opened trace file in TypeScript and not in the generated JavaScript by default.
We are now ready to open our index.html page in the browser and inspect the recorded trace.
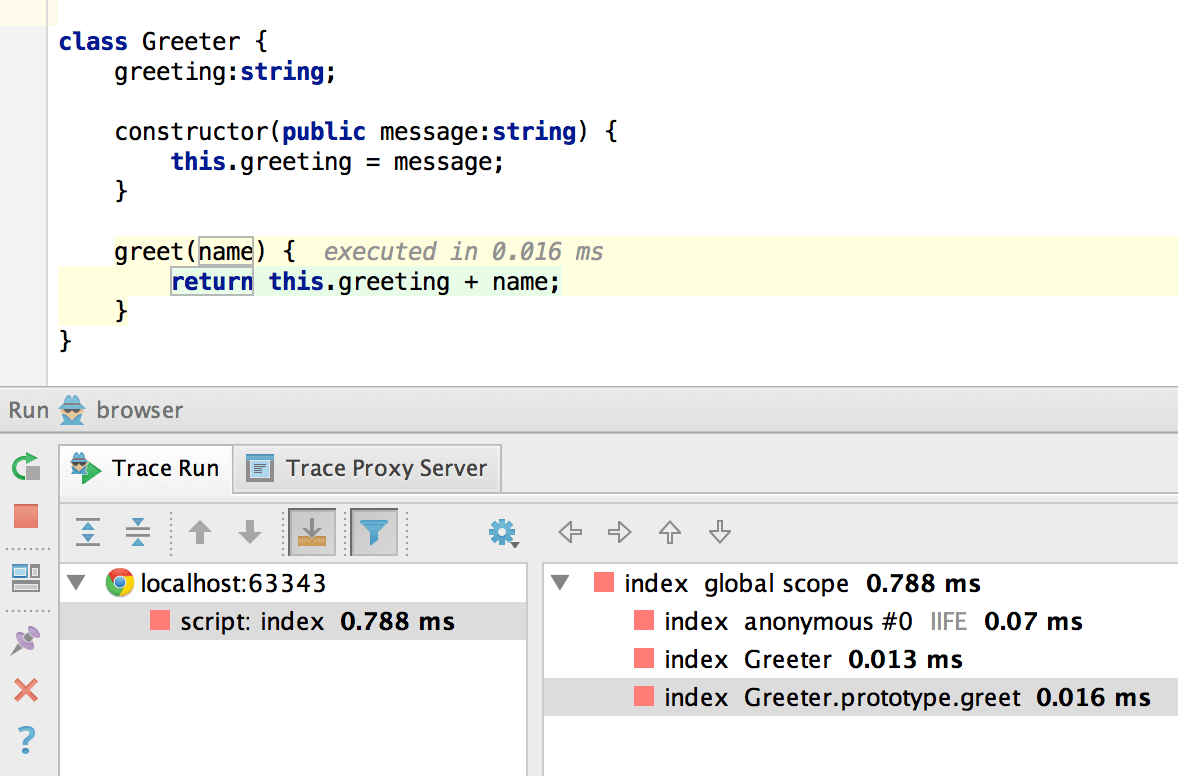
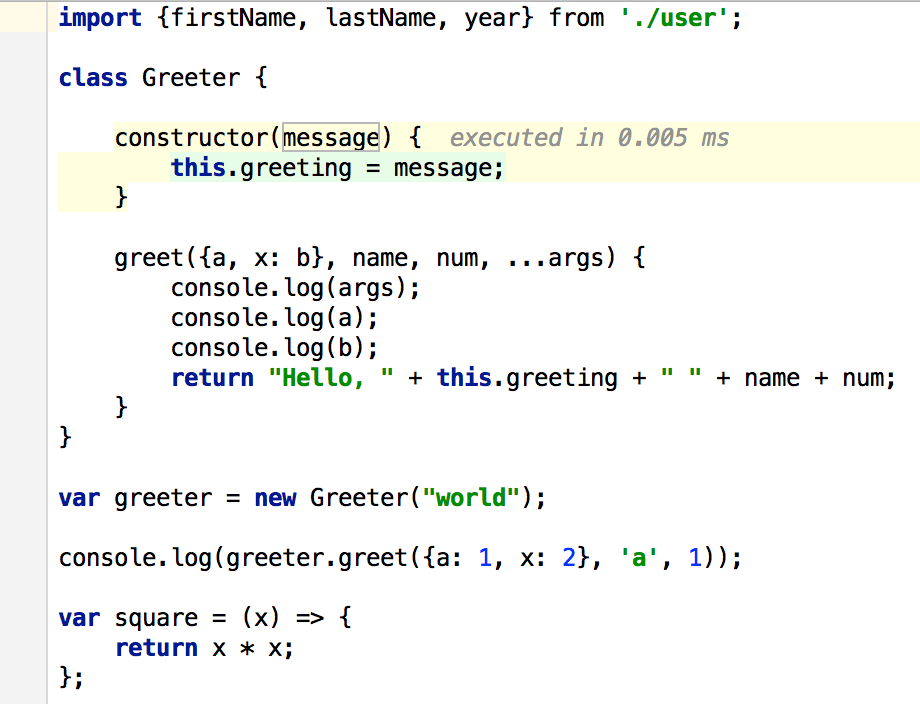
When we jump to the execution stack and select one of the entries, the opened trace file is our original TypeScript file. We can still see all the highlighted execution paths, inspect object values and so on, just as we would be tracing normal JavaScript. Amazing, isn’t it?
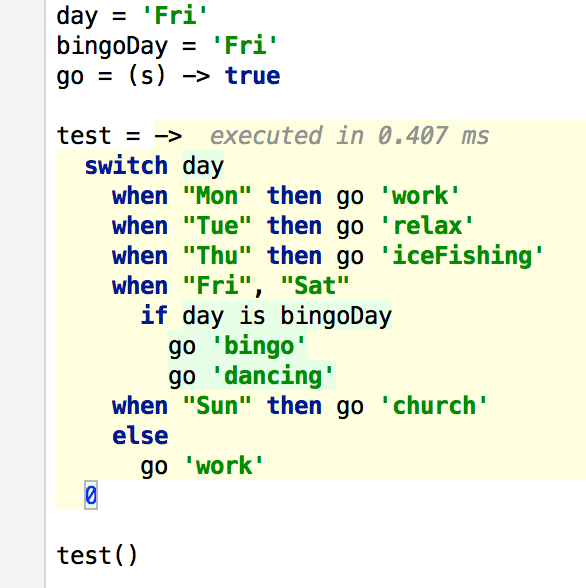
Similarly, you can use CoffeeScript watcher or Babel/Traceur one to trace the original executed code:
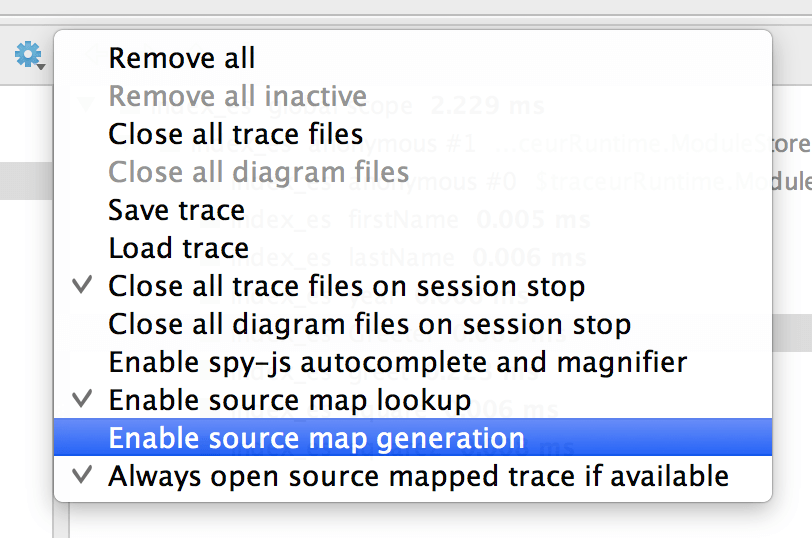
Source maps support comes with one more bonus: You can now debug code in Chrome DevTools while it’s being traced by spy-js. In other words, tracing and debugging at the same time. To turn the feature on, go to spy-js settings and select “Enable source map generation”. Please note that this may significantly slow down your tracing, so try only using it when needed and turning it back off.
Advanced trace search
As you probably know, spy-js event tree and opened stack are easily searchable. After the tree gets focus, you can start typing and using quick search to find what you need. It works nicely for searching certain function calls when you are within the stack tree and know that your function call is inside it.
But what if you don’t know where your function is called from, not even the event, but still would like to search across the whole trace? spy-js to the rescue! When spy-js session is running, you can use the context menu for any function in your source code to quickly initiate the search, and then navigate through the results. Feel free to assign some shortcuts to make the process completely keyboard-friendly.
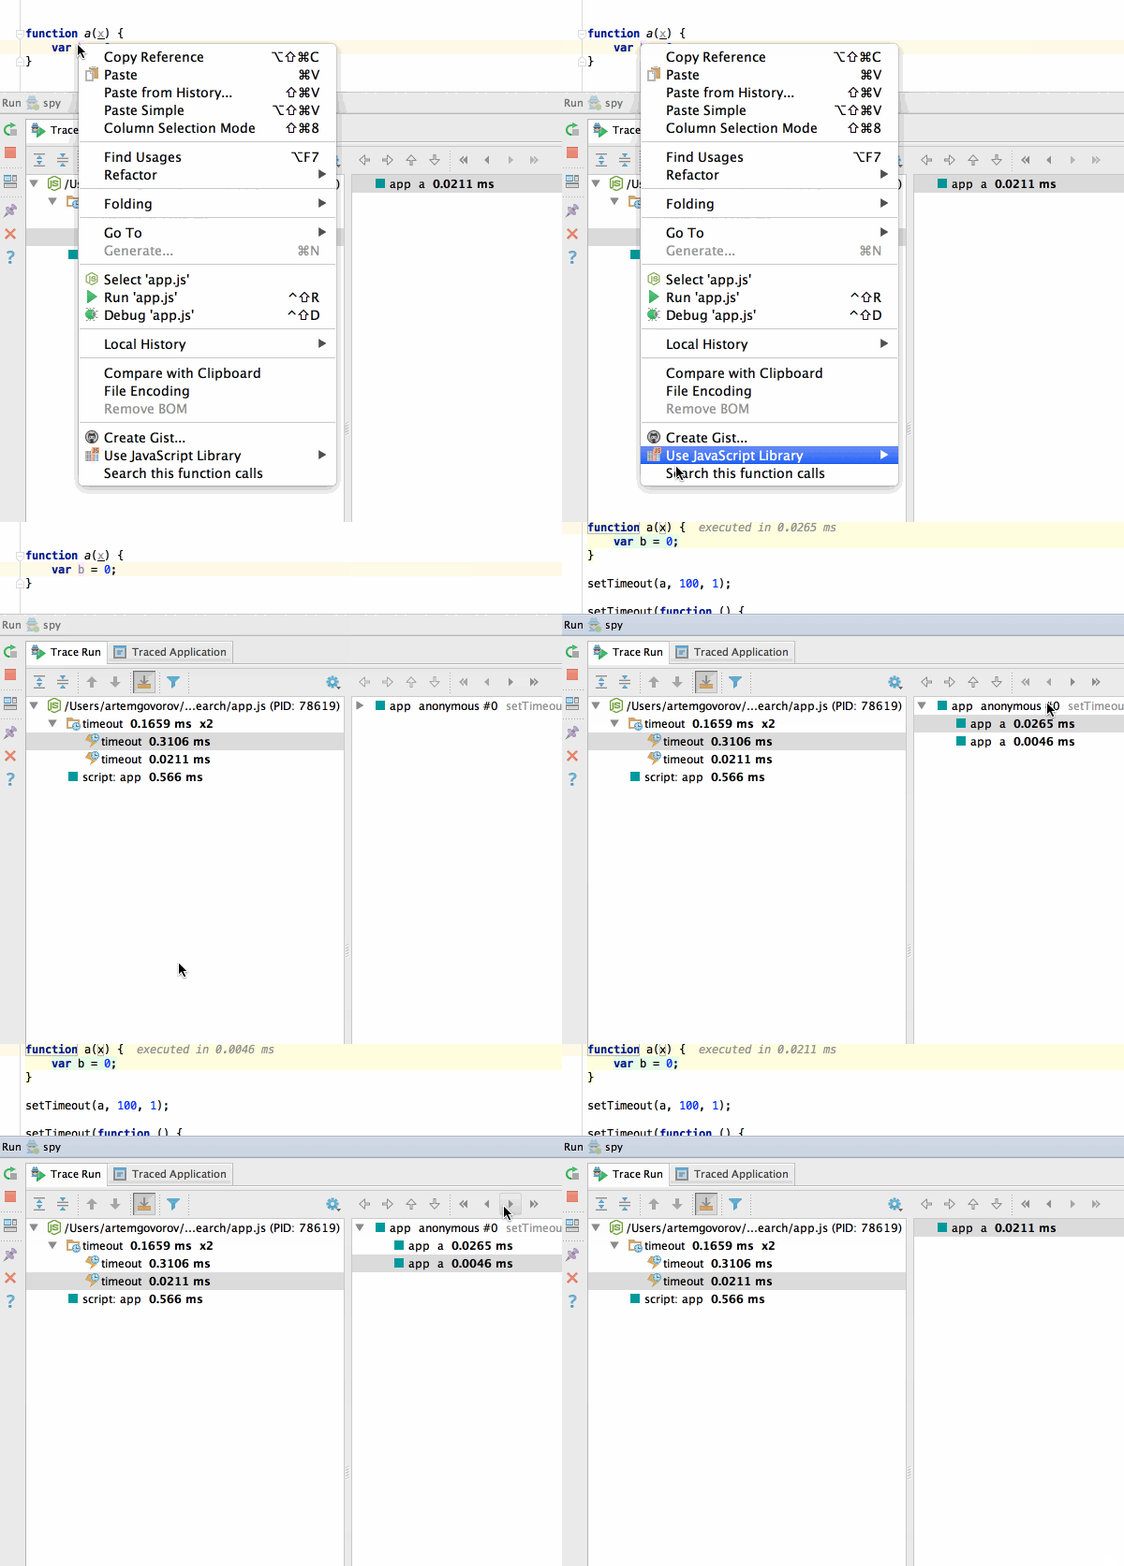
The search can also be initiated for any function inside any opened trace file, or from the context menu of the stack tree nodes (select “Search this function calls across all events”).
Advanced trace navigation
One more useful feature is the new way to navigate spy-js traces. When tracing some synchronously executed code, you can open the event you are interested in and start exploring its stack tree. But what if you are tracing some async code with a few callbacks or a chain of promises? In this case you will have multiple events and opening them one by one just to find the call of the next function in the file is not much fun.
spy-js now addresses this issue in a simple and elegant way: you can now just jump to the next or previous function in the file that you are inspecting. It means that if you have a chain of promises or a callback defined within the function that you are tracing, and you can easily jump to the next promise or the callback function call.
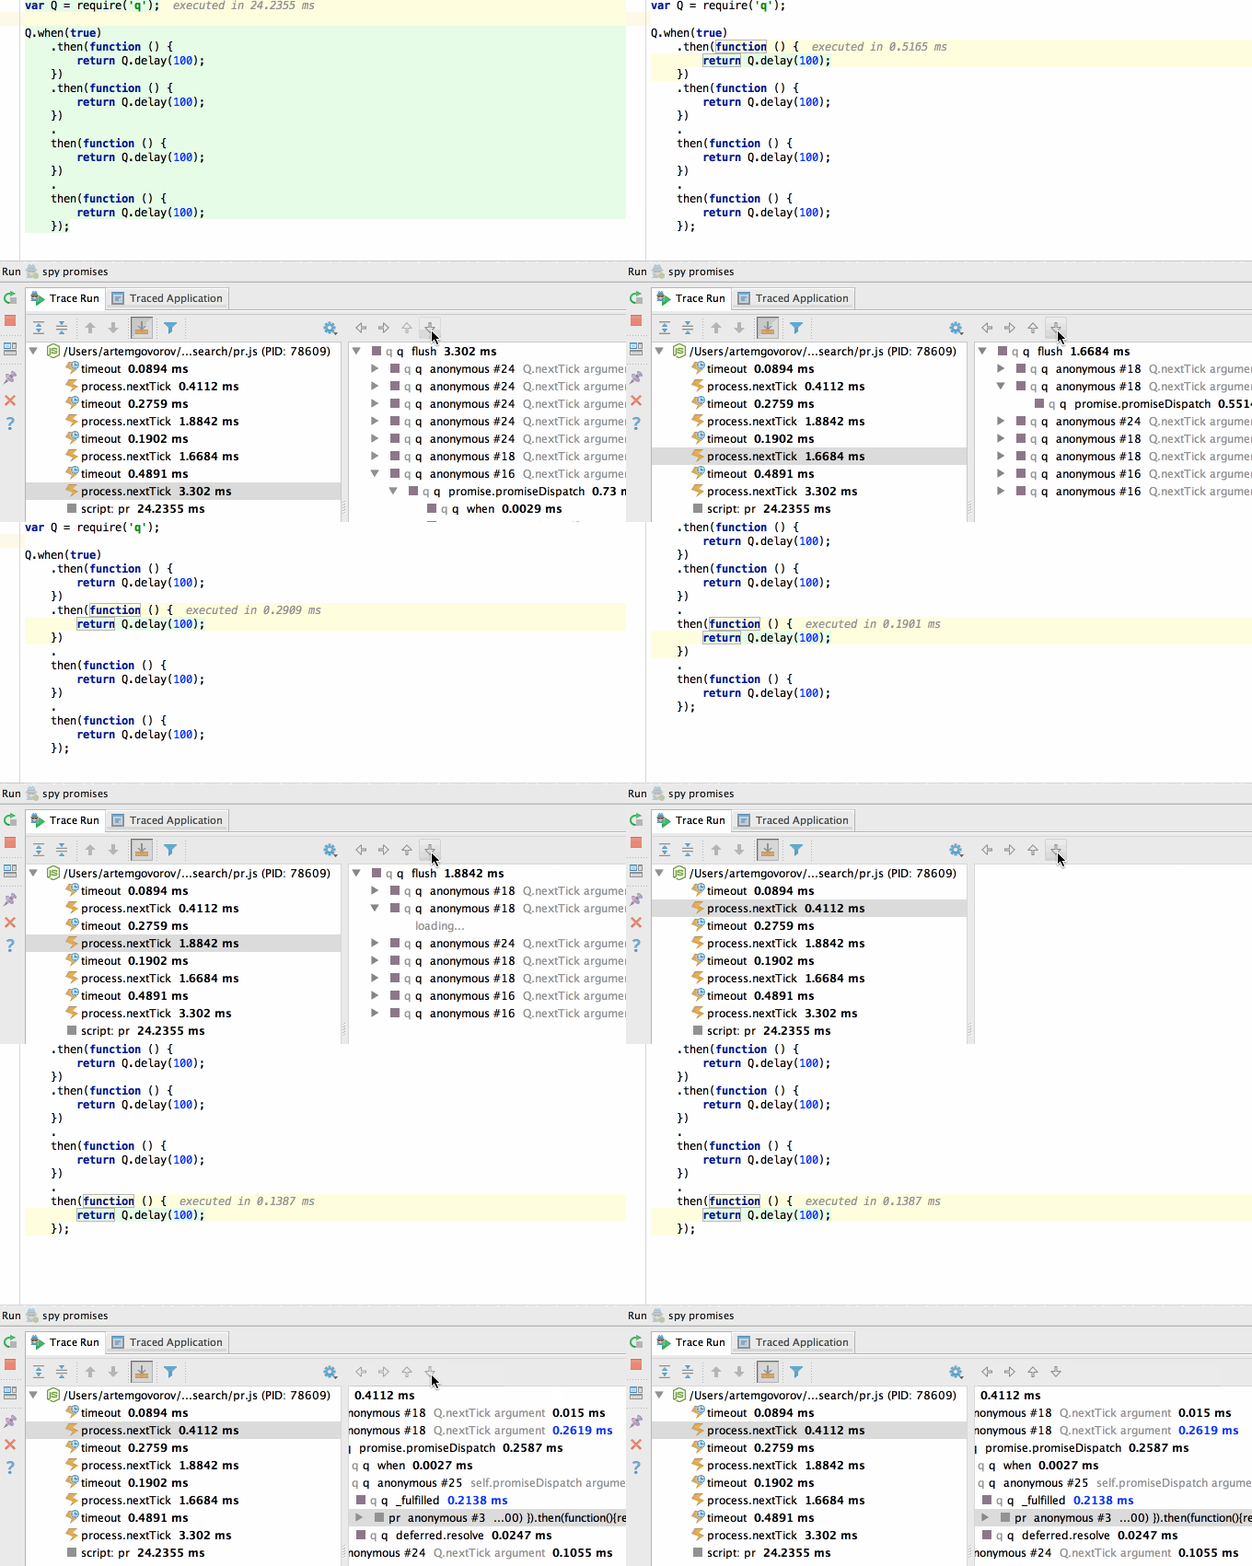
More actions are available in the stack tree toolbar menu and the stack tree node context menu under the “Navigate” item.
That’s it for this blog post, but I have more new and exciting spy-js features to share with you, so stay tuned!

