Electron allows you to build cross platform applications using only JavaScript, HTML and CSS (or ECMAScript 6, TypeScript, CoffeeScript or any language that compiles to JavaScript). It provides lots of native OS APIs for things like OS notifications or automatic updates.
There are several well-known apps that use Electron, for example Slack and Atom, as well as a great number of open-source apps built on Electron that you can learn from.
Let’s have a look at how you can set up your workflow with the Electron app in WebStorm: how to enable the coding assistance and how to run and debug Electron application.
Configuring code completion
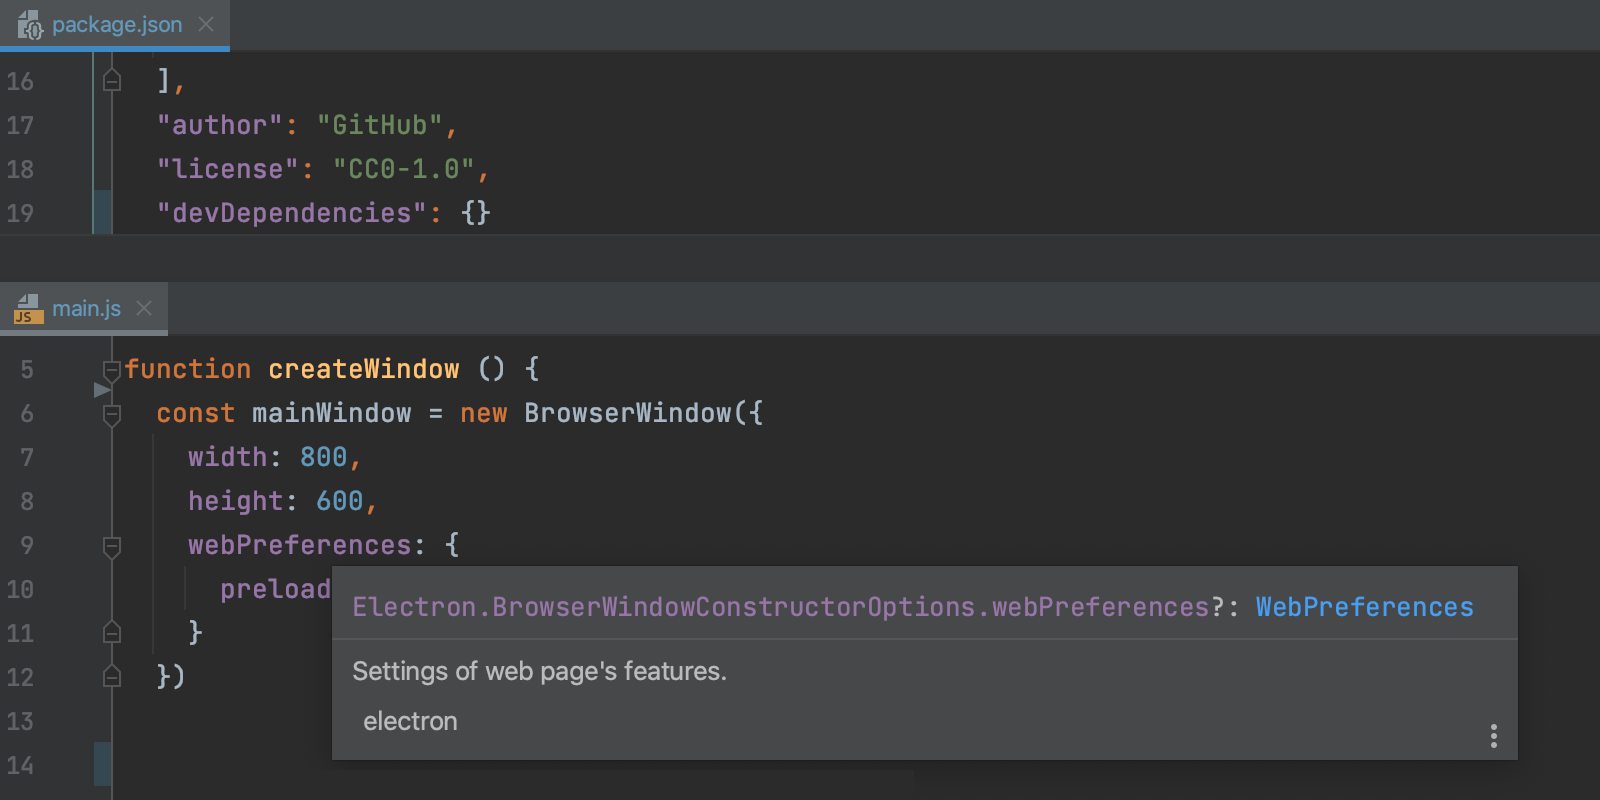
The coding assistance for the Electron APIs is provided via the electron.d.ts TypeScript definition file. Starting with Electron v1.6.9 this file is included in the electron node module.
If you have electron listed as a project dependency, WebStorm can automatically locate this file in the node_modules folder.
But if electron is installed as a global dependency, to get the proper code completion you need to add electron.d.ts as a JavaScript library. For that go to Preferences | Languages and Frameworks | JavaScript | Libraries, click Add… and specify the path to this file located in the global node_modules/electron folder. You can also download the file manually from the GitHub and link to it.
To get code completion for Node.js APIs, go to Preferences | Languages and Frameworks | Node.js and npm and click ‘Enable coding assistance’.
Running and debugging Electron app
In Electron, there are 2 types of processes: the main process, which manages the web pages of your application and handles system events, and the render process, which is related to every individual page of the app and hosts most of the application logic.
Running and debugging the main process
If you want to see what happens on application start, you need to debug the main process.
Updated on November, 26th 2018: Create a new Node.js run/debug configuration, specify the path to the Electron executable in the Node.js interpreter field and add .
as a Node.js option (because we need to run electron .
to start the app).
Save the configuration, put the breakpoints and press Debug. Or, press Run to simply start the app.
Electron executable is what you use to start your Electron app from the command line.
If you have installed Electron (the electron-prebuilt package) locally, it should be located in your project node_modules under .bin folder. On OS X and Linux that should be electron, while on Windows it’s electron.cmd. You can also specify the path to the globally installed Electron.
Debugging packaged apps
You can also debug packaged Electron apps – just make sure you specify the path to Electron inside the built app in the Node.js run/debug configuration. For example, for a built OS X app, that would be your_app.app/Contents/MacOS/your_app; for a built Windows app it’s your_app-win32-x64/your_app.exe.
Debugging the render process
With Electron < 1.6 or > 2, start the app with an additional option --remote-debugging-port=9222
(select any port you like).
You can either add this option in the Application parameters field in the previously created Node.js configuration for the main process and use it to start the app, or run the app from the command line with this option.
With Electron 1.6-2, you need to add app.commandLine.appendSwitch('remote-debugging-port', '9222')
to the app’s main.js file and then start your app.
Then create a new debug configuration of the Attach to Node.js/Chrome type (in WebStorm 2017.2 or earlier it’s called Chromuim Remote) and specify the port number – 9222 (or a different port you’ve used).
Once the app is running, start this new configuration to attach to the render process.
If you want to debug both render and main processes at the same time, start both configurations in debug mode.
Debugging TypeScript Electron apps
If you’re writing your app in TypeScript (or actually any language that you then compile to JavaScript) and want to debug it, make sure that the compiler generates source maps. For example, for TypeScript, add "inlineSources": true, "sourceMap": true
in the project tsconfig.json file.
Debugging apps with Webpack
Please don’t forget to add devtool: 'source-map'
option to your webpack.config.js file, when you want to debug Electron apps built using Webpack.
– JetBrains WebStorm Team
Thank you for providing this. I have been playing with Electron recently and wondered how to import and test an Electron project in Webstorm.
Thanks! You can find a bit more info on testing with electron-mocha here: https://youtrack.jetbrains.com/issue/WEB-21636 This is supported in WebStorm 2016.2 EAP: http://blog.jetbrains.com/webstorm/2016/05/webstorm-2016-2-eap-162-232/
How do you debug the main and renderer at the same time, like you mentioned?
You just start the debug session for the main process and the debug session for the render process.
Can you elaborate please with an example?
Please do the steps described in the blog post in sections ‘Running and debugging the main process’ and
Debugging the render process
. Start the first configuration and then start the second configuration (do no stop the first one). That’s it.Once small typo: the “dash dash” has been replaced by one “long dash”: see below. This stops debugging working
To debug the render process of the app in WebStorm, first start the app with an additional option –remote-debugging-port=9222
should be
–remote-debugging-port=9222
Same thing happening in my comment but not that you need “dash dash” not “long dash” before remote-debugging-port – thanks
Thank you, fixed!
How does this work in Intellij 16: When clicking on Add… there is no way to download anything. What am I missing?
Sorry, my bad, it’s the Download… button. Fixed in the post.
Hi Ekaterina
Thanks. Interestingly, I do not see a github-electron entry in the downloads list. What am I doing wrong?
Hmm, that’s quite weird. It should look like this:
.
Thanks. It works now.
Don’t know what the problem was. I restarted IntelliJ , deleted jsLibraryMappings.xml in .idea folder of the project, and after that: voilà!
Regarding using TypeScript; I had webstorm insert the default tsconfig.json file for me and also went into Preferences-> Lang & Frameworks > TypeScript and checked Enable TS Compiler and Use tsconfig.json.
Do I also need to add typescript to my package.json as shown below? Thanks!
“devDependencies”: {
“electron-packager”: “^7.3.0”,
“electron-prebuilt”: “^1.2.7”,
“concurrently”: “^2.0.0”,
“lite-server”: “^2.2.0”,
“typescript”: “^1.8.10”,
“typings”:”^1.0.4″
}
You can use either a built-in TypeScript compiler, then you don’t need to have TypeScript installed in node_modules, or set up some other build tool like Gulp, then you do need it.
I’m having some problems running the process. All I get is “CreateProccess failed with error 193 (no message available).
My settings:
Node interpreter: C:\Code\Webstorm\Electron\Lab\node_modules\.bin\electron
Working directory: C:\Code\Webstorm\Electron\Lab
JavaScript file: app.js
I’m running Windows 10
Any one know what I can do to get around this problem?
I just found out that I had to use the electron.cmd, it works now.
Thanks Marius, that is very helpful.
It seems that the path to Electron is incorrect, please try C:\Code\Webstorm\Electron\Lab\node_modules\.bin\electron.cmd
The main process works for me, but no breakpoints are hit in the renderer.
I’m using typescript and I’m using the latest EAP version (WebStorm 2016.3 EAP
Build #WS-163.4396.14, built on September 14, 2016)
Do you have “inlineSources”: true, “sourceMap”: true options in your tsconfig.json?
Did that work in WebStorm 2016.2? Can you please send us more details on our project configuration and breakpoints location via https://youtrack.jetbrains.com/issues/WEB Thanks!
I found an issue which has the same problem as me but hasn’t been answered since posted in March https://youtrack.jetbrains.com/issue/WEB-20976
Can you please inform someone to answer the question please?
Thanks!
Is developing with Electron also supported with PHPStorm or is there a difference between Webstorm vs PHPStorm for node.js/Electron or Node Webkit?
Should work the same way in PhpStorm, just make sure you have the Node.js plugin installed.
Hello.
I try to use a Configuration:
node interpreter –
D:\workspace_webstorm\shn-elect-000\node_modules\.bin\electron.cmd
working directory –
D:\workspace_webstorm\shn-elect-000
javascript file –
main.js
_Run_ is fine.
But when I try to use _Debug_,
I take a error message:
“D:\Program Files (x86)\JetBrains\WebStorm 2016.2.3\bin\runnerw.exe” D:\workspace_webstorm\shn-elect-000\node_modules\.bin\electron.cmd –debug-brk=61115 –expose_debug_as=v8debug D:\workspace_webstorm\shn-elect-000\main.js
ReferenceError: v8debug is not defined
…
Ekaterina, can you possibly to help me ?
Please ignore this message (it’s related to the upcoming changes in the Node.js debugging protocol), it should not affect debugging your app. Sorry for confusion.
Hello.
My typescript module(which i use in render process) is required as usual module and it contains only ./out directory with js files, but I want debug it as ts code. I tried to add source map to files in ./out dir, where source is my local ./src dir, but
Chromium remote
does not see them.Chromium remote
use only js files from ./out dir :(How can i fix it?
I also tried add tsconfig with something like this but it also does not work
"outDir": "./node_modules/myTSmodule/out/",
"sourceRoot": "../myTSmodule/src/",
"mapRoot": "../myTSmodule/out/",
"inlineSources": true,
"sourceMap": true
},
"include": [
"../myTSmodule/src/**/*.ts"
]
Unfortunately, we found out that only the main process debug works for apps in TypeScript. Here’s a link to the issue: https://youtrack.jetbrains.com/issue/WEB-23687 We hope to get it fixed soon. Sorry for inconvenience!
Did something change in WS 2016.2? I cant find “Preferences | Languages and Frameworks | JavaScript | Libraries, click Download”
sorry, my bad 2016.3 is the new version… my comment can be deleted thanks. :))
Should be the same in all versions, nothing has changed in that configuration dialog.
Create NodeJS run\debug configuration for the Main process and Chromium remote configuration for the Render process.
Run NodeJS configuration, then Chromium remote configuration.
Main process is OK.
Chromium remote successfully connected, but nothing happens – breakpoints are not hit, console.log message are not shown.
Why? How to fix it?
Thx.
Could you please enable logging by setting js.debugger.wip.log property in Registry (Help|Find Action|Registry) to some file path like ~/wip.json, start debugging and attach resulted file? Feel free to create a support request for it, it will be more convenient to continue the investigation there.
I have some similar situation like Kevin.
I could debug in Main process and Render process.And the breakpoints are hit in render process, but console.log messages were not shown too!
I have changed the setting js.debugger.wip.log property for “~/wip.json”,so i got the file . but the console of chromium remote debug
still empty.
For anyone who had trouble getting the webstorm interpreter dialog to find the .bin folder or the /usr directory on a mac. A workaround is to create a symlink to the .bin or /usr/local folder and then select the electron binary.
For example in my home directory ~/ I did:
ln -s /usr/local/ ~/usr_local_symlink
After that I was able to access the electron binary from the dialog. There must be a better way to accomplish this but in the short term this is for anyone who is stuck.
You can hit Shift-Cmd-G (it’s a default shortcut on macOS in Finder for Go to folder) when you see a file chooser in WebStorm and type the path you need to get to, e.g. /usr.
Good tip, though I’ve oddly had mixed results with it. Worked for me once, then it locked up the open dialog the next time I tried it. In the end I found hitting Cmd-Shift-. (period) will cause hidden files like .bin to be shown in the dialog box. Just another option if anyone runs into problems with Shift-Cmd-G like I did.
I’m attempting to debug the main process of my electron app according to this https://blog.jetbrains.com/webstorm/2016/05/getting-started-with-electron-in-webstorm/
I’ve set up everything as described, but am getting an error when attempting to debug.
/Users/robertferentz/Work/connect-admin/node_modules/electron-prebuilt-compile/lib/cli.js –debug-brk=56546 –expose_debug_as=v8debug /Users/robertferentz/Work/connect-admin/src/index.js App threw an error during load Error: Cannot find module ‘/Users/robertferentz/Work/connect-admin/–debug-brk=56546’ at Module._resolveFilename (module.js:455:15) at Function.Module._resolveFilename (/Users/robertferentz/Work/connect-admin/node_modules/electron/dist/Electron.app/Contents/Resources/electron.asar/common/reset-search-paths.js:35:12) at Function.Module._load (module.js:403:25) at Module.require (module.js:483:17) at init (/Users/robertferentz/Work/connect-admin/node_modules/electron-compile/lib/config-parser.js:279:16) at main (/Users/robertferentz/Work/connect-admin/node_modules/electron-prebuilt-compile/lib/es6-init.js:38:29) at Object. (/Users/robertferentz/Work/connect-admin/node_modules/electron-prebuilt-compile/lib/es6-init.js:41:1) at Module._compile (module.js:556:32) at Object.Module._extensions..js (module.js:565:10) at Module.load (module.js:473:32)
I’ve made sure all the settings are correct. Could be because I’m using electron-forge or does it not have anything to do with it?
Hi Robert,
What WebStorm version do you use? Can you please send us a screenshot of your Debug configuration? Thanks!
Here it is:
https://drive.google.com/open?id=0B-GgcD8w7YGRVi1DTTJqeUtyWFk
Thanks! It seems that the electron-prebuilt-compile doesn’t handle the flags we pass to initiate debugging properly. See:
https://github.com/electron-userland/electron-prebuilt-compile/blob/master/src/cli.js#L6
As a result the debug flag is concatenated to the project path instead of the file name.
Here’s a related issue on their tracker: https://github.com/electron-userland/electron-prebuilt-compile/issues/23
Unfortunately, I can’t come up with any workaround on WebStorm side.
I have one Electron main.js process and TWO (2) render processes. How do I point my debugger to a specific render process that I want to debug?
You should do the steps described in Debugging the render process section of the blog post. The only difference is that when you start the Chromium remote configuration, WebStorm will ask you what render process out of two you’d like to debug.
I’m on IntelliJ 2016.1 Ultimate and I can’t find “Preferences | Languages and Frameworks | JavaScript | Libraries, Download”. I cannot locate “Libraries.” Is this a new feature in 2016.2 and onwards?
Please make sure you have JavaScript support enabled in Preferences | Plugins.
I was meaning to say I was using WebStorm 2016.1. Sorry about that.
I do see that Javascript support is checked. I just updated WebStorm and I still can’t see the Libraries.
It seems that you’re looking at the default settings instead of project settings. Libraries are only available in project settings.
Ah. I made an empty test project and now I see Libraries and I could see the downloads. Thanks for the help!
I can’t find github-electron in the list. I tried Sascha’s solution but I couldn’t find the referenced file.
I updated to WebStorm 2017.1.
Here’s a link to a screenshot: http://imgur.com/a/gVTyc
However, I see a choice called electron and electron-* where * is any word. Is electron the new name for it?
It seems that it was renamed to
electron
. Please install it.I will update the blog post. Sorry for confusion.
Ah no worries. Thanks for maintaining this article! It’s really helpful!
Hello,
I’ve something weird with downloading the Electron library, there a re only 3 items in the list…
Here’s a screenshot : https://gyazo.com/613ac45f27f004e5761c1a8b4faef804
Do you have any idea why ?
Thanks in advance
Sorry for the inconvenience. The structure of the DefinitelyTyped repo has changed a couple of days ago, WebStorm will support this new structure in the WebStorm 2017.1.1 bug-fix update. Here’s an issue on our tracker: https://youtrack.jetbrains.com/issue/WEB-26160
Thanks, I’ve been to the repo and downloaded manually the ones I needed then added them in “Javascript” | “Library” | “Add”.
Works perfectly
To spare anyone else the sadness and insanity I had to go through:
1) Currently, when you click on “Download…” and choose “TypeScript Community Stubs” you will get bupkiss. That is because the TS repository has apparently been restructured.
You can read about it here (which also details how to manually add self-downloaded libraries as a workaround): https://intellij-support.jetbrains.com/hc/en-us/community/posts/115000140384/comments/115000165650
It’s been fixed in (not yet available) 2017.1.1. Unfortunately, it does not appear that they plan to push this fix to older versions? (https://youtrack.jetbrains.com/issue/WEB-26160)
2) (Probably less relevant) The “Libraries” option will not show up at all if your Git executable is not configured correctly.
Thank you for your update. We are considering to backport the changes to WebStorm 2016.3 and probably WebStorm 2016.2, but it’s not final decision yet.
I’m new to Electron development, I’m just about to start setting up my Electron development environment and I find this post makes a lot of assumptions about what is already installed.
Is there an article that completely describes the whole Electron/IntelliJ setup steps?
This post only describes the steps you need to perform to configure Electron support in WebStorm. It’s assumed that you’re already familiar with Electron and/or read Electron Quick Start.
Please let me know what specific issues you had following this tutorial. I will try to answer your questions.
I’m working with an electron scala.js app and I am unsure how I would configure that in IntelliJ.
Do you know any open-source Electron-Scala.js apps we can have a look at?
Has anyone had experience debugging with webstorm and electron-vue?
https://github.com/SimulatedGREG/electron-vue
The dev script runs this: https://github.com/SimulatedGREG/electron-vue/blob/master/template/tasks/runner.js
We haven’t tried that ourselves. Did you experience any issues?
I have not really been able to get it to work. I tried to follow the instructions here as an example and sorta had the main process work, but it lost it as I stepped. I had to run the dev task and also run the node configuration pointing at the index.dev.js. I have not been able to get the render process to work at all.
I gave it a try and was able to debug the render process. All I did was adding ‘–remote-debugging-port=9222’ to the runner.js at line 38 like this:
run('cross-env NODE_ENV=development electron app/src/main/index.dev.js --remote-debugging-port=9222', BLUE, 'electron')
.Then I started the dev task and created and started a Chromium remote configuration as described in the blog post.
I haven’t tested anything complex. I added a button to the CurrentPage.vue and was able to stop on the method once I clicked it.
I’ll give that a try. Thank you.
Be careful not to mistakenly select the Electron binary located in
node_modules/electron/dist/electron
, otherwise Webstorm won’t be able to connect (it will show a “Connection refused” message after a few seconds). Webstorm needs to run your app via the link located innode_modules/.bin/electron
(which actually points to a Node.js script that will ultimately invoke Electron itself), as Ekaterina explained.Thanks for your comment! :)
I’m trying to download the Electron TypeScript definition files, but I don’t see one simply called “electron.” There are files named “electron-config,” “electron-debug,” “electron-devtools-installer,” “electron-json-storage,” “electron-notifications,” “electron-notify,” “electron-packager,” “electron-settings,” and “electron-window-state.” Do I want some or all of those or am I missing something? Thanks.
Screenshot: http://imgur.com/a/0AZrO
It seems that they’ve been removed from the DefinitelyTyped repo 4 days ago because the Electron team is going to publish them with every Electron release.
To use the Electron.d.ts file in WebStrom, download it from this page https://github.com/electron/electron/releases, then in Preferences | Languages & Frameworks | JavaScript | Libraries click Add…, then click the “+” button and specify the path to the downloaded electron.d.ts file.
We’ll update the blog post.
Thanks, that did the trick! When I add the file, does WebStorm copy it to some internal preferences folder or is it linking to the original file I downloaded?
It will link to the original file.
Thanks for posting this. Very helpful.
I added electron.d.ts to libraries, but still the documentation not working.
Any ideas why?
http://i.imgur.com/8MgcAIi.png
http://i.imgur.com/bUNdRFU.png
Sorry, but the URL you’ve specified is the link to the External documentation meaning that the IDE will open this URL in the browser when you call the External documentation action. The docs shown on the screenshot in the blog post are the docs provided in the electron.d.ts file. Unfortunately, they are not available for every symbol. And actually, in the more latest versions of this file, the amount of docs has decreased. You can see that if you open electron.d.ts and go through it.
I have WebStorm 2017.2.2; but the code completion does not work for Electron.
The Electron package is installed as a Node module in my project and run well. For a known API, after I complete the typing of its name, I can traverse into the electron.d.ts to see the details of its parameters.
However, during coding like typing the first part of the API name, the API in the electron.d.ts file is not shown in the popup dialog.
I have followed the instructions given above to enable Node.js and NPM. I also have Node.js Core and /node_modules checkboxes selected in the Preferences > Languages & Frameworks > JavaScript > Libraries panel; but the APIs from electron.d.ts are still not shown in the popup dialog during coding.
Could you please check it out?
Thanks very much in advance for your kind help and support.
Can you please add a small code sample that shows the case when completion doesn’t show up. Please include the line where Electron is imported in that file. Thank you!
Sample code and comments are added as requested. Please review.
Thanks.
const electron = require(‘electron’);
const { Tray, app, Menu } = electron;
class AppTray extends Tray {
constructor(iconPath, mainWindow) {
super(iconPath);
this.mainWindow = mainWindow;
this.on(‘right-click’, this.onRightClick.bind(this));
}
onRightClick() {
const menuConfig = Menu.buildFromTemplate([
{
label: ‘Quit’,
click: () => app.quit()
}
]);
// In particular, the following function does not
// have auto-completion in the popup, i.e. typing
// ‘this.pop’ does not have auto-completion. But
// we can traverse to its declaration in the file
// ‘electron.d.ts’.
this.popUpContextMenu(menuConfig);
}
}
module.exports = AppTray;
Thanks for the code sample, that was very helpful! I’ve reported an issue: https://youtrack.jetbrains.com/issue/WEB-28471 You can add a star to it to get a notification when it’s fixed.
When trying to debug after setting up as this doc describes, the process closes with this error:
“core/node_modules/.bin/electron –debug-brk=54135 –expose_debug_as=v8debug core/main.js –remote-debugging-port=9222
Process finished with exit code 130 (interrupted by signal 2: SIGINT)”
When Run instead of Debug, the app stays open like usual until manual close.
In either case, when main.js is running, breakpoints do not hit.
Any idea what could be going wrong?
Can you please tell what WebStorm, Node.ks and Electron versions do you use? Thanks
Hi Ekaterina,
I tried following your instruction to setup a renderer debugger and failed. Here is my configuration:
Node interpreter: C:\Projects\edop-studio\node_modules\.bin\electron.cmd
Node parameters: –remote-debugging-port=9222
Working directory: C:\Projects\dedop-studio
Application parameters: app –config=dedop-config.js
I have placed a few breakpoints but all of them were ignored. Note that I am using TS. I have set “inlineSources” and “sourceMap” in tsconfig.json to true.
This issue is probably similar to the one posted here https://youtrack.jetbrains.com/issue/WEB-23687#u=1499967259982
Any help would be much appreciated.
And I am using WebStorm 2017.2.3
We were not able to reproduce that issue with WebStorm 2017.2, so we just closed it. We would appreciate if you share a sample project with us to help us reproduce the problem. Thank you!
Thanks for the speedy reply. Here is the project that I was trying to debug: https://github.com/DeDop/dedop-studio
Quick update. We’re still trying to figure out what the right setup for debugging TypeScript Electron apps would be. Unfortunately, your project didn’t help us a lot – we couldn’t really start the app because of the environment setup it requires.
Hi,
have you found a setup for debugging TypeScript Electron apps?
@sebi What problem do you have? Please note — passing
--remote-debugging-port
in the NodeJS params doesn’t work anymore due to Electron bug (https://github.com/electron/electron/issues/10445).Hi,
I would like to know if a “hello world” tutorial is available from scratch: setting with Electron libraries until we are able to run our first Electron app made thanks to WebStorm.
Any help would be welcome.
Thanks and kindest regards,
Abelardo
Hi,
Do you mean: is there a sample Electron app preconfigured for WebStorm? Unfortunately, there isn’t.
Hi,
I tried debugging the electron-quickstart but the debugger of the main process do not stop at my breakpoints.
Idea 2017.2.4
Electron 1.8.0
Do you have the same problem?
Please see the Console output with configuration –inspect
C:\Projects\electron-quick-start\node_modules\.bin\electron.cmd --inspect-brk=51884 . C:\Projects\electron-quick-start\main.js
Debugger listening on ws://127.0.0.1:51884/da4451e9-06c9-48d0-b4f5-74bbab74f3e0
For help see https://nodejs.org/en/docs/inspector
Debugger attached.
Process finished with exit code 0
Without configuration –inspect
"C:\Program Files\JetBrains\IntelliJ IDEA 2017.2.1\bin\runnerw.exe" C:\Projects \electron-quick-start\node_modules\.bin\electron.cmd --debug-brk=51950 --expose_debug_as=v8debug C:\Projekte\Alarmmonitor\electron-quick-start\main.js
Process finished with exit code 0
Thanks Sebi
Hi,
We were able to debug the app when using Electron 1.7 in WebStorm/IntelliJ IDEA 2017.3 EAP and in WebStorm/IntelliJ IDEA 2017.2.4 (you need to add
--inspect
as an application parameter in the run/debug configuration.We tried debugging with Electron 1.8 beta, but no luck. It didn’t work in VS Code as well. We should investigate further to find out whether the issue is on the Electron side or on the IDE side.
Thanks, it works!
But I’m a little bit annoyed about electron, quickstart is for beginners, this is no good start.
Hi dear Ekaterina
I found a strange problem.
My webstrom version is ‘2016.2’, electron version is 1.7.9;
Debug the render process of the app in WebStorm is ok,
But can’t debug main process.
App runs correctly and the debugger of the main process do not stop at my breakpoints.
When I lowered the electron version to 1.4.13. debugger works.
Has this problem been met by anyone else?
Electron 1.7.9 doesn’t support
--debug-brk
option, it requires--inspect
, and thus there is no way to debug main process in WebStorm 2016.2. In 2017.3 (that is just around the corner)--inspect
will be used for Electron main process debuggingIntellij 2017.3.1 still doesn’t seem to support debugging Electron 1.7.9. The Github issue they reference doesn’t seem to have any progress
https://github.com/electron/electron/issues/10445
I have been unable to debug either the main or renderer process. I suppose Electron broke/removed ‘–debug-brk’ and Intellij hasn’t implemented support for ‘–inspect’? Or am I missing something?
I’m on a free trial of Intellij and new to Electron, this is a pretty disheartening start.
Hello,
As it was mentioned in the previous comment, IntelliJ IDEA and WebStorm 2017.3 use the
--inspect
flag for debugging Electron apps (here’s a related issue on our issue tracker: WEB-27784) so debug of the main process should work fine.Regarding the debug of the render process: the workaround suggested in the issue on GitHub should help. You need to add
app.commandLine.appendSwitch('remote-debugging-port', '9222')
to main.js and then create and use Attach to Node.js/Chrome configuration and specify this port number.Please let us know how it works for you! Thanks!
I apologize, I am unable to delete or edit my first comment.
Upon further experimentation, I was able to debug (set breakpoints) both the main and renderer processes of the electron-quickstart app with Intellij 2017.3.1 and Electron 1.7.9.
Creating an ‘Attach to Node.js/Chrome’ run config with the “–inspect” radio option selected and port 9222 along with the main node.js run config with electron as interpreter and application parameter ‘–remote-debugging-port=9222’ seems to work like a charm so far….. hope this helps someone (and that it keeps working!)
Great to hear that! :) Thanks!
I’ve also updated the blog post and described these steps.
Thank you for this article.
Just wanted to bring a typo to your attention.
GitHub is misspelled as GutHub. I am not sure if this was intentional.
“You can also download the file manually from the GutHub and link to it.”
Thanks for noticing! Will fix that.
hello, i follow your step by using webstorm 2018.1
but, i see some error:
App threw an error during load
Error: Cannot create BrowserWindow before app is ready
here is my run setting.
node interpreter: D:\MyProject\node_modules\.bin\electron.cmd
working directory: D:\MyProject
javascript file: main.js
and i also try by vscode, but it work fine.
how can i fix it?
best regards.
well, i’m resolved now this problem by recreate and resetting.
i don’t know exactly. why show error.
anyway thanks for article.
Hi,
with Electron v2.0.2, to debug a render process, are still valid these directives?
– Add this line to main.js: app.commandLine.appendSwitch(‘remote-debugging-port’, ‘9222’)
– Create a debug profile: “Attach to Node.js/Chrome”.
– start the Electron app
– start the debug profile
Because I’ve tried but the breakpoints don’t work.
Thank you
Hi,
Yes, I’ve double-checked the steps that with Electron 2.0.2 and all works fine for me. Please make sure that you’ve changed the port from the default 9229 to 9222 in the Attach to Node.js/Chrome configuration. We need more information about your app and what exactly happens when you start debugger to investigate further.
However I can debug the render process enablig the Chrome DevTools.
Hello.
I’m trying to use this template of Electron&Angular in WebStorm: https://github.com/maximegris/angular-electron
However I didn’t succeed to debug the Angular’s TS code with this setup.
Maybe you’ve experience with debugging Angular inside Electron app & can advise how it should be managed correctly?
Hello,
Please try the
electron:local
npm script to run your app. Don’t forget to pass the debug flag to it:"electron:local": "npm run build:dev && electron . --remote-debugging-port=9222"
. Then use this port in the Attach to Node.js/Chrome configuration, debug seems to work fine this way. If you have any other questions, don’t hesitate to contact our tech support: https://intellij-support.jetbrains.com/hc/en-us/requests/newAnd for debugging the app when using the start task, please follow this issue: https://youtrack.jetbrains.com/issue/WEB-34979
Hello,
I can’t seem to be able to debug the main process for electron: 2.0.13 in webstorm 2018.3.
I create a run/debug config as described with:
Node Intepreter: ~/myProject/node_modules/.bin/electron
Working Directory: ~/myProject
Javascript File: index.js
If I try to RUN then it works.
If I try to debug then I can read this in the console:
~/myProjects/node_modules/.bin/electron –inspect-brk=55469 ~/myProjects/index.js
Debugger listening on ws://127.0.0.1:55469/6d895f5b-8a9a-406d-8a6f-4022c0eda37f
For help see https://nodejs.org/en/docs/inspector
`
Nothing happens, no breakpoints are hit and and after 30 secs/1 Min this is printed to the console:
Process finished with exit code 0
Did something change in webstorom/Electron or it is a misconfiguration?
Hello,
Unfortunately, there’s a known issue with debugging the main process with Electron 2.x: https://youtrack.jetbrains.com/issue/WEB-34907
We will look into it and hopefully fix it soon.
Debugging does work with Electron 3.x, the current stable version.
Hi,
I have to spawn my electron app from a node script (that send data to it with an IPC), how should I configure my debugger to be able to put breakpoint in the child procress ?
Thanks !
Hello Yohan, please have a look at this issue and the workaround described in it: https://youtrack.jetbrains.com/issue/WEB-36401
Hope it helps. If it doesn’t, please leave a comment in the issue.
open-new project has cordova app but no electron, why is that? I thought electron is the most popular desktop suite for js/html/css these days
Hello, we are adding project templates when there’s an official project generator or template available for this technology. We don’t know about anything like that for Electron. If you know, it would be great if you submit us a feature request about that: https://youtrack.jetbrains.com/issues/WEB Thanks!
Hello, I am trying to make a web application with electron framework and some of the stages i was stack, I think i am new one that’s the main problem. I am more exploring about electron programming from https://hackr.io/tutorials/learn-electron Can anyone one provide me more references to make app with the help of electron.
Hello Shivam, sorry, we don’t really have a lot of knowledge in this field. We relied on the official Electron docs. Egghead.io is a good source of video tutorial, there’s also quite a lot of tutorials on hackernoon.com.