Debugging Client-Side JavaScript With WebStorm 2017.3

We have some good news for everyone who is using WebStorm to debug client-side JavaScript apps in Chrome!
The first big news is that starting with Chrome 63, you can now use Chrome DevTools and WebStorm debugger at the same time.
Second, with WebStorm 2017.3 you no longer need an additional Chrome extension to debug apps in WebStorm.
Debugging in WebStorm and in Chrome DevTools at the same time
If you’ve ever tried to open DevTools in the browser while having a debugger opened in WebStorm, or vice versa, you saw that the WebStorm debugger immediately disconnected.
That happened because both WebStorm and DevTools are using the same debug protocol that did not support multi-client debugging. For many years, this Chromium issue was one of the most popular on their tracker. Well, now it’s finally fixed in Chrome 63!
This means that now you can use both the DevTools debugger and the WebStorm debugger at the same time, having their best features at your command.
For example, you can debug your app using WebStorm where you can put the breakpoints right in the source code, and then use the DevTools Elements panel to inspect DOM and styles, or its powerful Network panel to get insights into network performance.
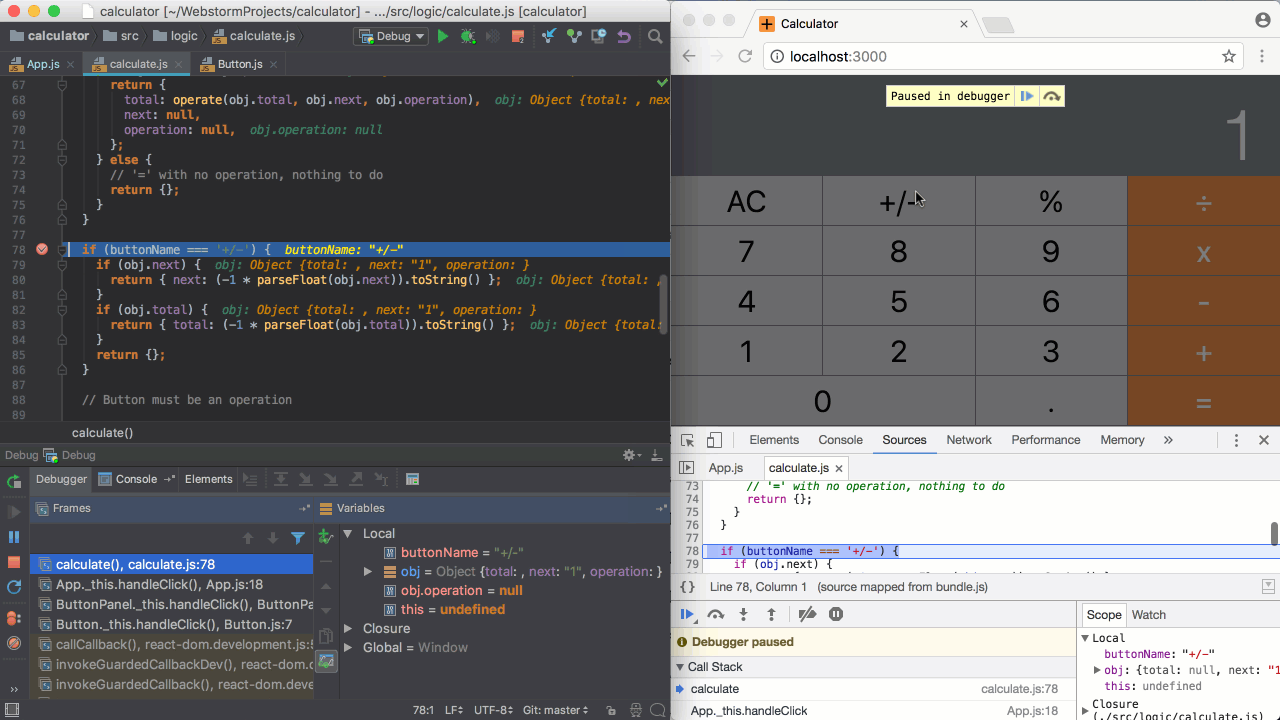
Stepping through the code is synchronized between DevTools and WebStorm. Once a breakpoint is hit, you can use the step and resume actions in either tool – both tools will show the execution point in the code and update the call stacks and the variables view.
Easy start with JavaScript debugger
As of WebStorm 2017.3, you no longer have to install JetBrains’ Chrome extension to debug your client-side apps in the IDE.
To debug the app, all you have to do now is create a new JavaScript debug configuration and specify the URL your app is running on. Then put the breakpoints in the code and start the debug configuration. WebStorm will open a new instance of Chrome (with the remote debugging on) and seamlessly attach to it.
The WebStorm team