

CLion 2018.3 EAP: profiling tools on Linux and macOS and multiline TODO

Hi,
The new CLion 2018.3 EAP (build 183.3647.14) is now available for download!
As usual, a patch-update will be available shortly for those using the previous EAP build, and you can also use Toolbox app or snap packages (in the case of Ubuntu) to get this build. No license is required and the build is free to use, but it will expire within 30 days of the build date.
CPU Profiler
Starting from this EAP, CLion comes with the CPU Profiler integration on Linux and macOS. With Perf on Linux and DTrace on macOS you can now analyze the performance of your application (both, kernel and user’s code) right in the IDE.
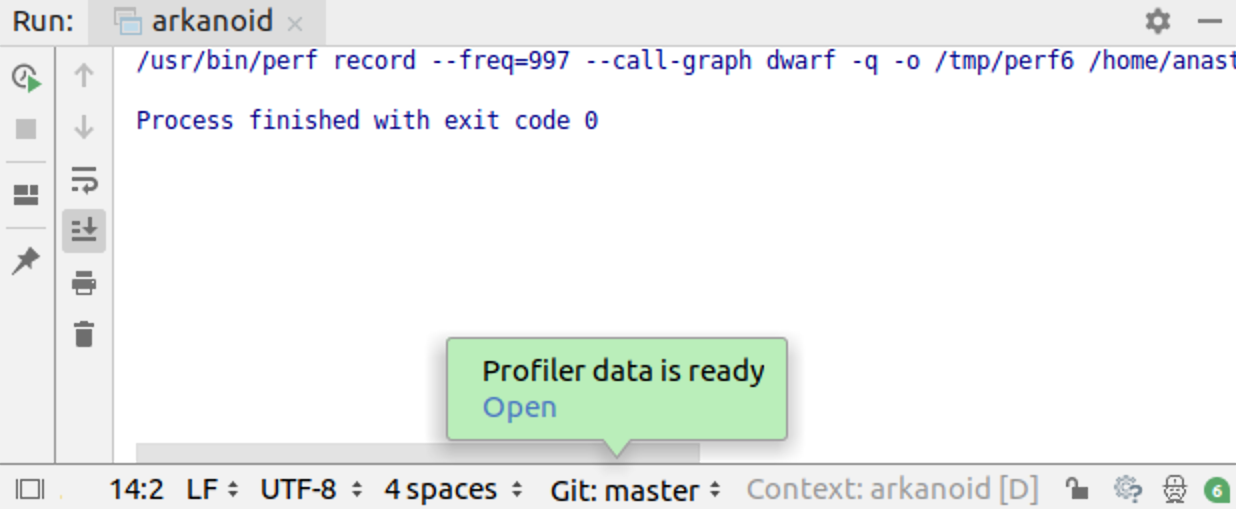
To run the profiler use a new button in the navigation toolbar or a new action in the run menu, which appears when you click on a run icon in the left gutter:

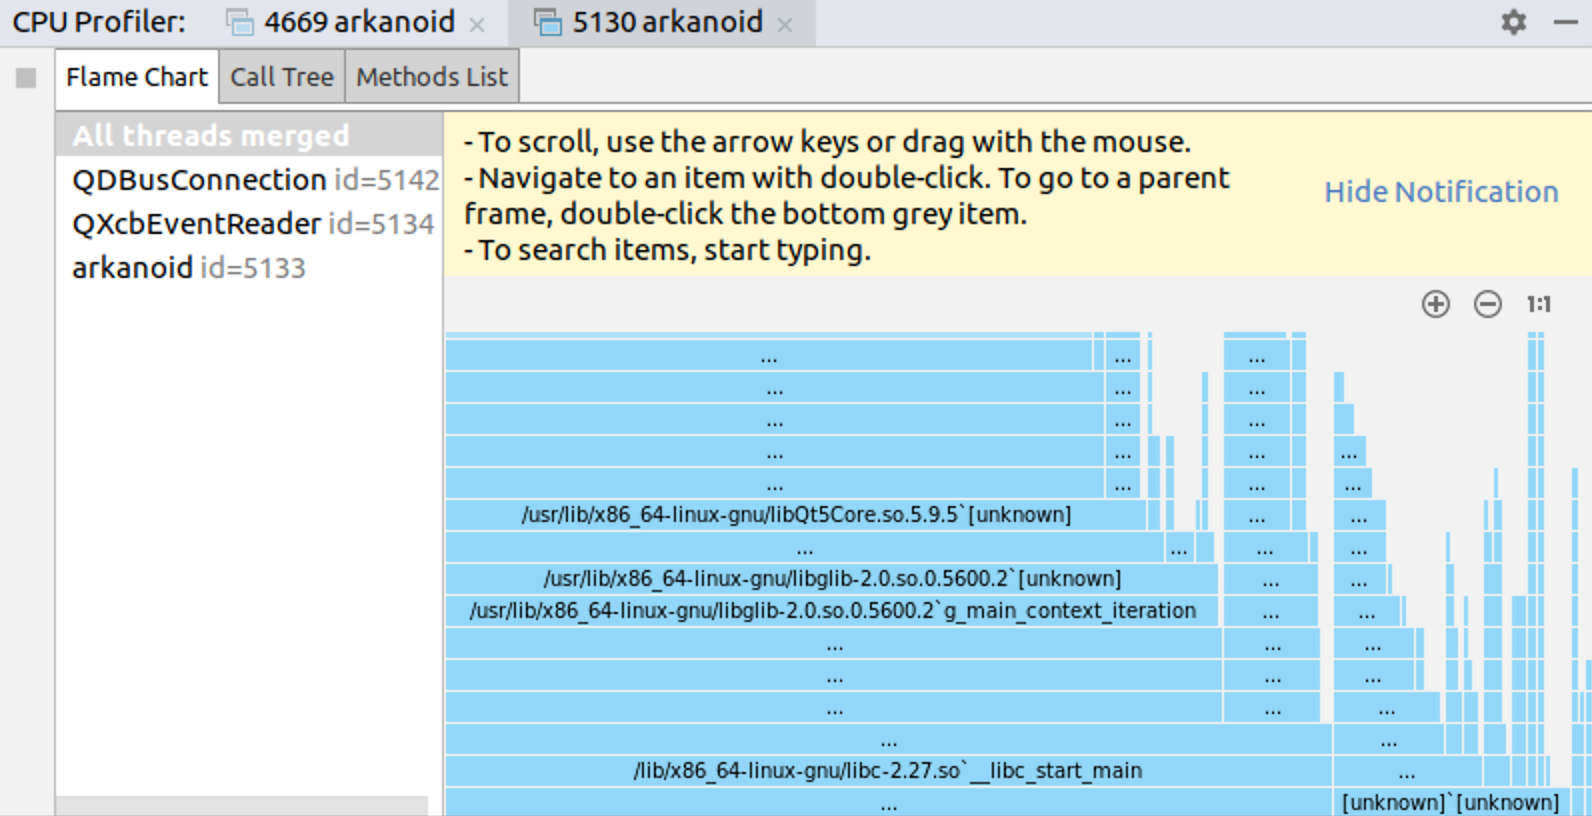
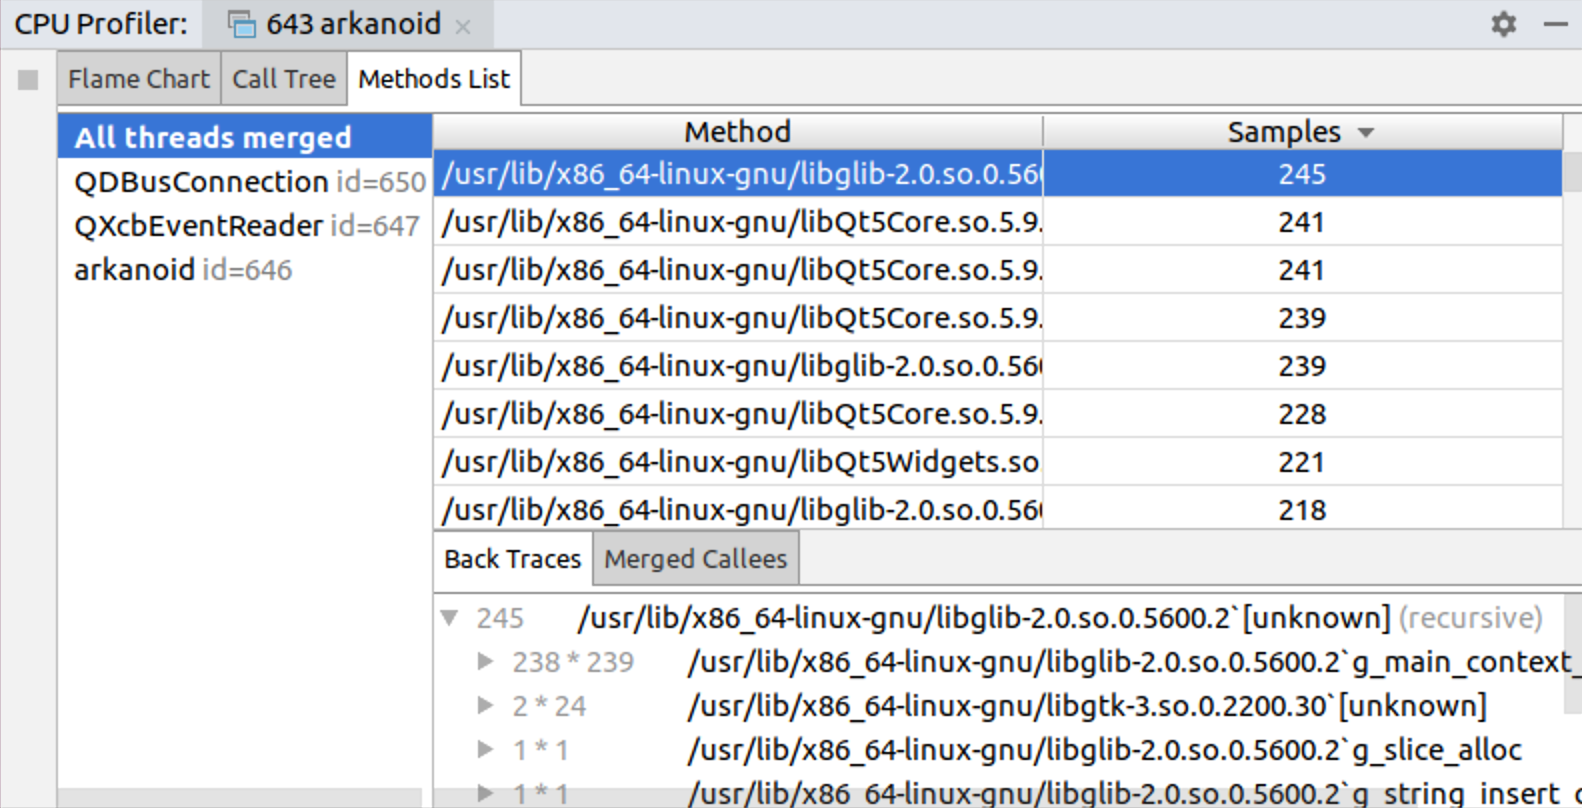
The results of the profiling is shown in the CPU Profiler tool window (View | Tool Windows | CPU Profiler):
How to start profiling the code?
Before you start profiling your app, please check and install, if missing, the following tools:
- On Linux:
- Perf is required to run profiling in CLion. Mind, you should install perf for the particular kernel version you have. For example, on Ubuntu you can check the kernel version via uname command and then install the linux-tools package for the particular kernel version:
anastasiak2512@ubuntu:~$ uname -a
Linux ubuntu 4.15.0-34-generic #37-Ubuntu SMP Mon Aug 27 15:21:48 UTC 2018 x86_64 x86_64 x86_64 GNU/Linux
anastasiak2512@ubuntu:~$ sudo apt-get install linux-tools-4.15.0-34-generic
- Besides, you have to allow perf collect information without root privileges. For that you have to tweak `/proc/sys/kernel/perf_event_paranoid` and update `/etc/sysctl.d/local.conf` if you want to keep the setting across system reboots:
sudo sh -c 'echo 1 >/proc/sys/kernel/perf_event_paranoid'
sudo sh -c 'echo kernel.perf_event_paranoid=1 > /etc/sysctl.d/local.conf'
- addr2line tool is also required to show human-readable (demangled) names in the output and to navigate to the source code. It’s part of the binutils package, so you likely have it by default. Otherwise, install binutils.
- Perf is required to run profiling in CLion. Mind, you should install perf for the particular kernel version you have. For example, on Ubuntu you can check the kernel version via uname command and then install the linux-tools package for the particular kernel version:
- On macOS:
- DTrace is required to profile on macOS. Most likely, you have it installed by default with your macOS. You can call `dtrace` command in the terminal to check it.
Perf and DTrace executables will be detected automatically by CLion. Or you can set the path in Settings/Preferences | Build, Execution, Deployment | Dynamic Analysis Tools | Profiler. Besides, you can configure sampling frequency there.
In order to get meaningful profiler data and ability to navigate through it properly, the application need to be build with debug info and without any optimizations, so we recommend using the Debug configuration with `-O0` compilation flag.
CPU Profiler tool window
When you start profiling the app, CLion notifies you if the profiler is successfully attached. When the profiling data is ready, CLion shows a balloon with a link to the CPU Profiler tool window with the results. Alternatively, you can open it via View | Tool Windows | CPU Profiler.
In the tool window you can find several useful tabs with the profiling information collected: flame chart, call tree and method lists.
Known issues and limitations
CPU profiler integration in CLion is implemented on Linux and macOS platforms. We’ll consider possible tools on Windows later in 2019. Besides, there are a few limitations in the current implementation:
- By default CLion runs the profiler with quite high sampling frequency, which might require a lot of disk space for long-running programs. Decrease this value in Settings/Preferences | Build, Execution, Deployment | Dynamic Analysis Tools | Profiler to avoid such situations.
- Profiler integration in CLion currently doesn’t support WSL toolchain or remote mode.
- Currently profiling works for CMake and Gradle projects. Projects with compilation database project model are not supported.
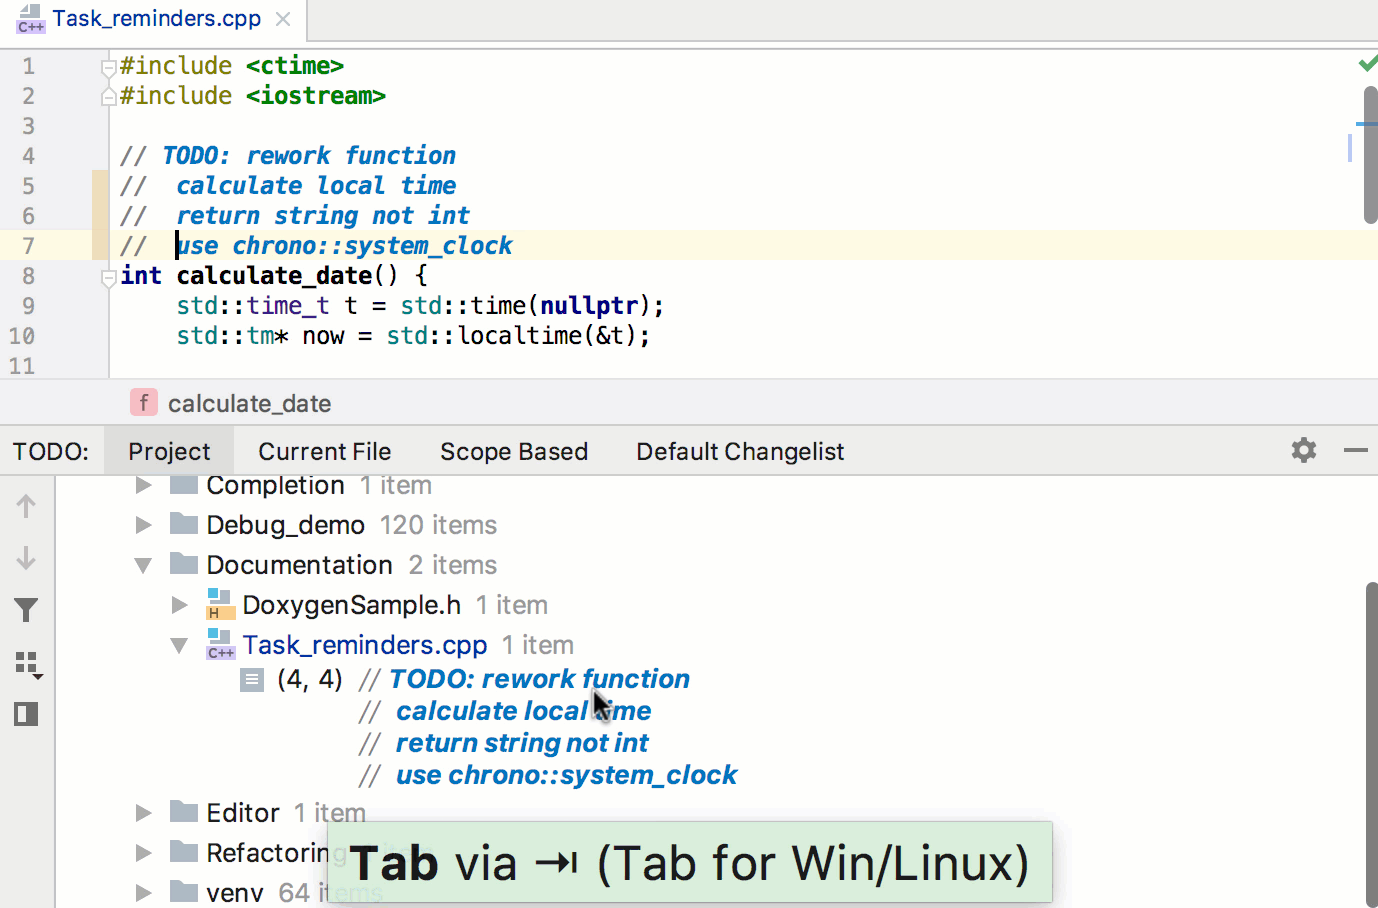
Multiline TODO comments
With this EAP we bring you multiline TODO comments, which means the first and all subsequent todo comment lines can be highlighted in the editor and listed in the TODO Tool Window (it was only the first line previously). Just add an indent starting from the second line of your multiline TODO comment so the IDE will differentiate it from an ordinary comment:
That’s it! Give this new CLion EAP a try and let us know what you think! Full release notes are available by the link.
Your CLion Team
JetBrains
The Drive to Develop
Subscribe to CLion Blog updates


