CLion 2019.2 EAP: Peripheral View for ARM Devices
Hi,
A new CLion 2019.2 EAP (build 192.5587.18) is now available. Download the full build from our site, install it via the Toolbox App, or use a snap package for Ubuntu. A patch-update for the previous EAP build will be available shortly.
This build introduces the Peripheral view for ARM embedded devices.
What do you need to start with it in CLion?
The Peripheral view in CLion is shown during debugging for two types of Run/Debug configurations: Embedded GDB Server and OpenOCD Download & Run. So, first, you need to have a configuration. When you run it, you’ll see the Peripherals tab in the Debug tool window with an invitation to load the .svd file:
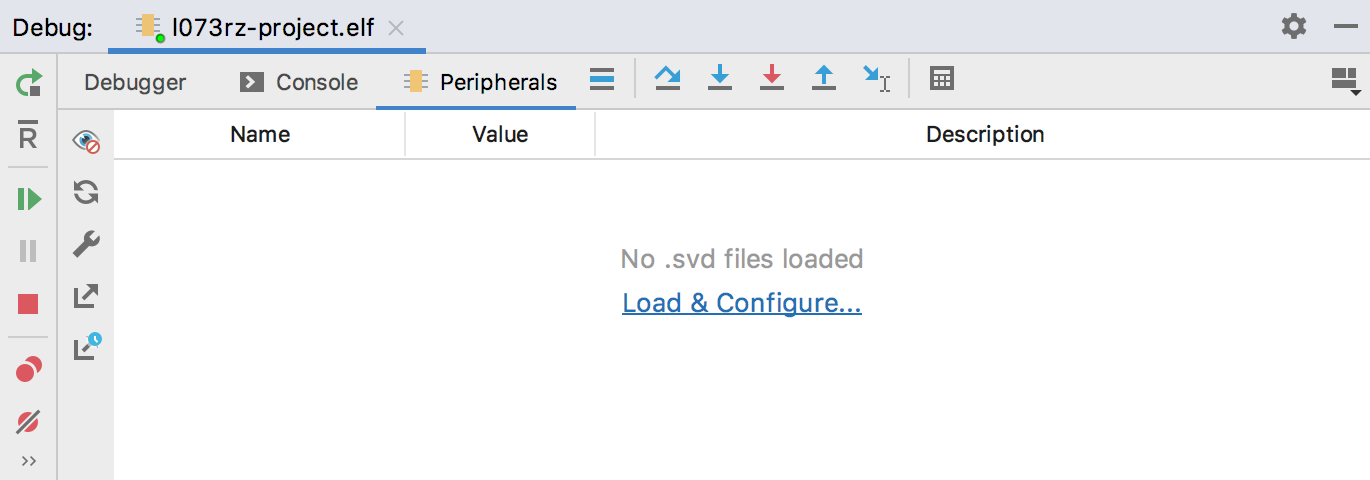
Second, you need is an .svd file, which is a standard ARM file with the definitions of peripheral registers. MCU vendors publish them along with the chip documentation, or you can find them inside various SDKs or libraries.
Select the file and the active peripherals to show:
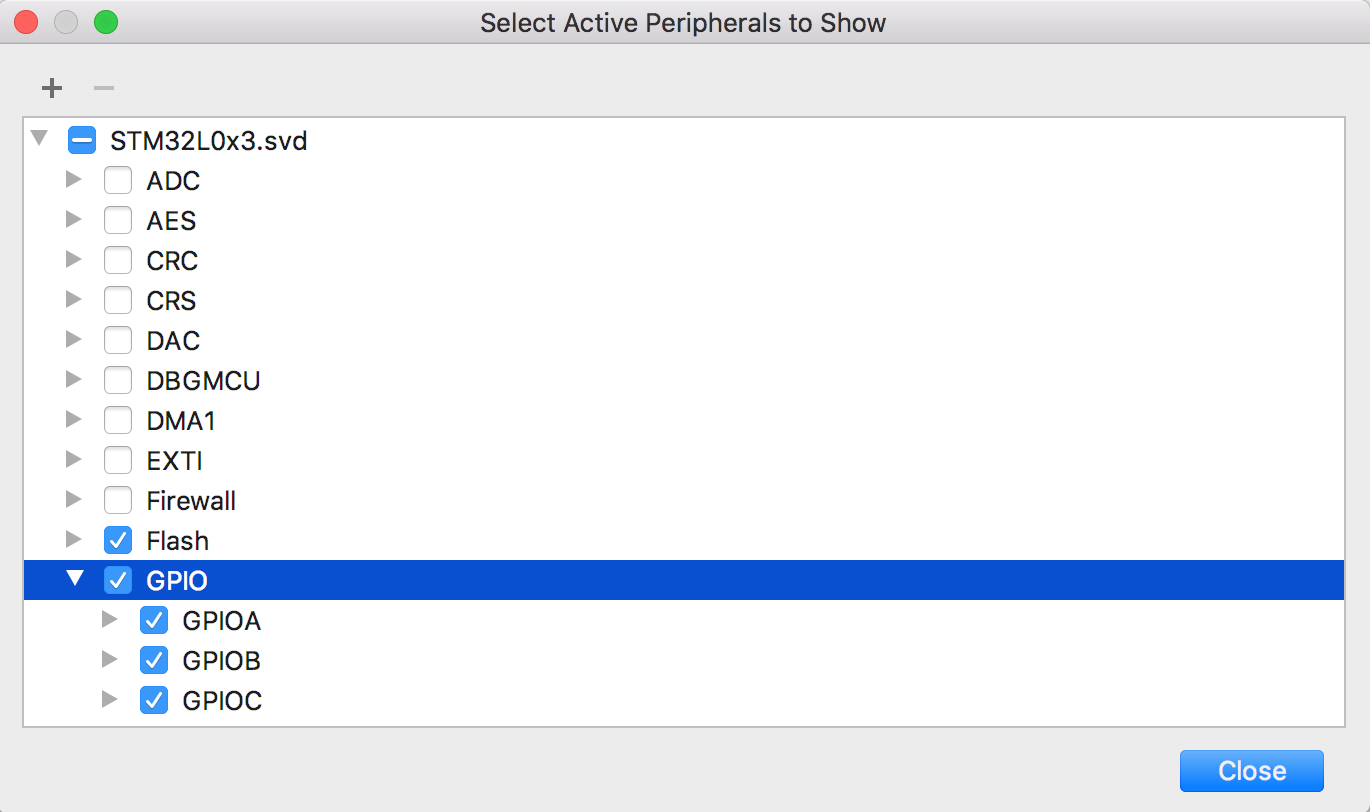
That’s it!
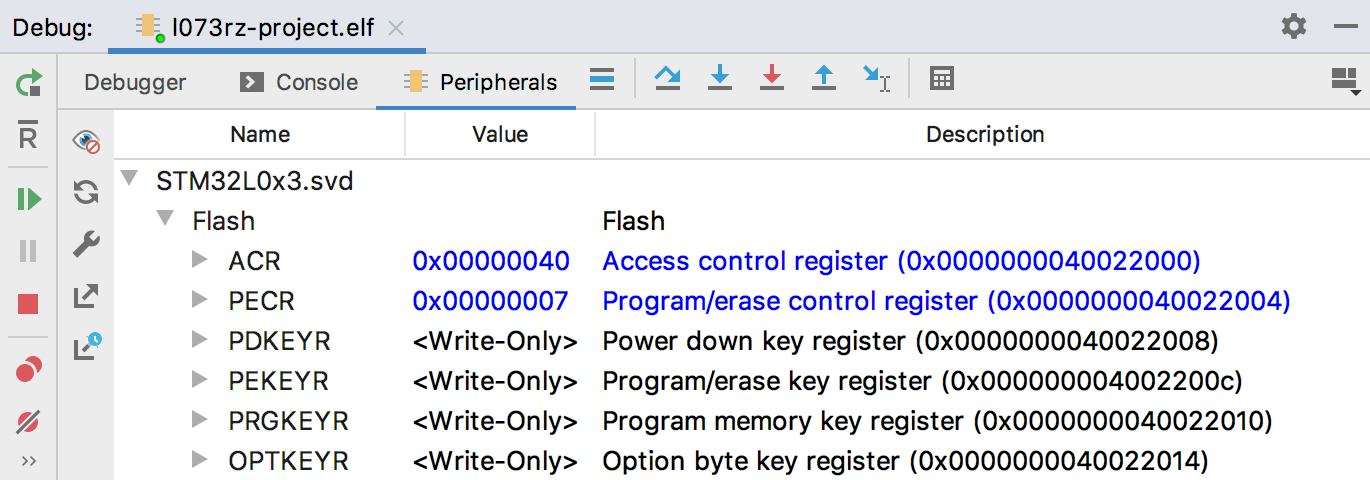
A few notes on the Peripherals tab
You can switch between Decimal, Octal, Hex, and Binary views of the peripheral value via the context menu:
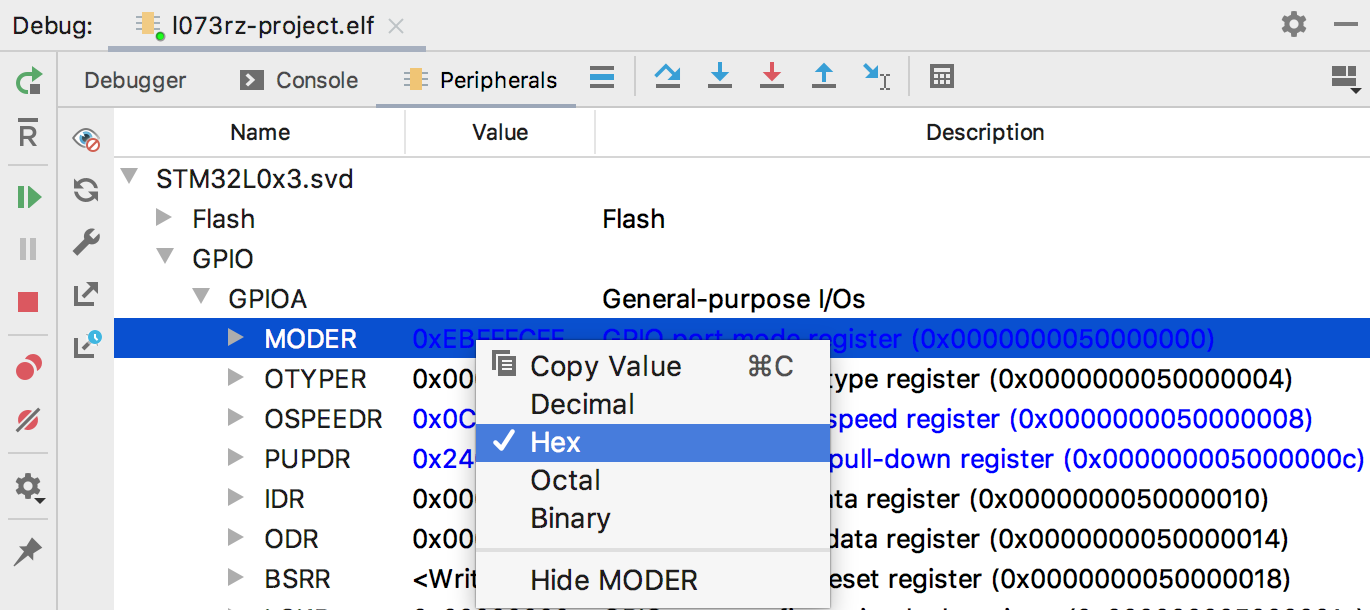
Note the peripherals are read-only for now. We plan to implement a read-write mode later.
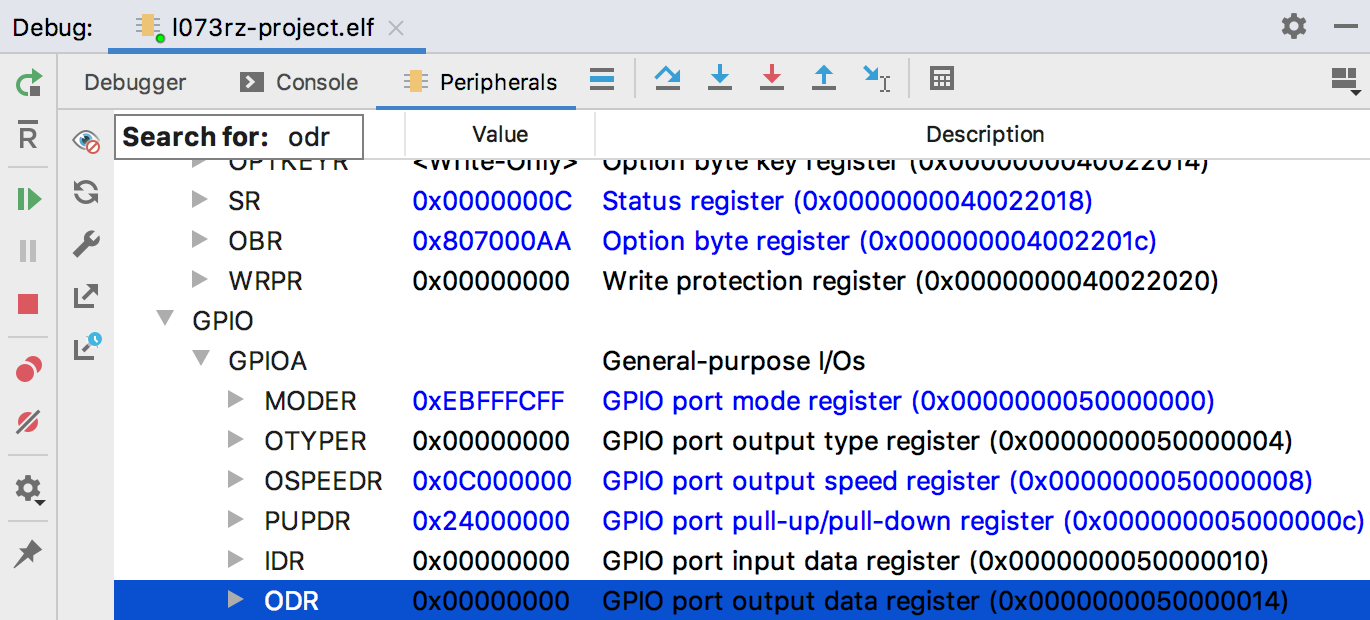
If you need to search for a particular value, just start typing the name:
On the Peripherals tab, you can also find a few useful buttons:
- The Stop refreshing button stops the on-the-fly updates to the peripherals on stepping. It can be useful if the operation is time-consuming. And with the Refresh button, you can trigger an update manually.
- The Configure button opens the Load .svd file dialog. By the way, you can load several .svd files at once and select the active peripherals you need from each one.
- Export as CSV to Clipboard and Open as CSV in Editor can be useful if you want to compare peripherals from several runs or save it for the future investigation.
Last but not least, this EAP build bundles GDB 8.3.
The full release notes are available here.
Your CLion Team
JetBrains
The Drive to Develop
Olof says:
July 8, 2019Fails on startup and shuts down. Something about illegal reflection.
Anastasia Kazakova says:
July 8, 2019Some more details and IDE logs will be useful
Olof says:
August 5, 2019This was printed from 2019.2 on CentOS.
WARNING: An illegal reflective access operation has occurred
WARNING: Illegal reflective access by com.intellij.ide.ClassUtilCore to field sun.net.www.protocol.jar.JarFileFactory.fileCache
WARNING: Please consider reporting this to the maintainers of com.intellij.ide.ClassUtilCore
WARNING: Use –illegal-access=warn to enable warnings of further illegal reflective access operations
WARNING: All illegal access operations will be denied in a future release
Anastasia Kazakova says:
August 5, 2019What’s the line right before the warning?
It seems you can some custom VM option not supported by the newly updated JBR11. Need to identify it and remove from your VM config.
Olof says:
August 5, 2019OpenJDK 64-Bit Server VM warning: Option UseConcMarkSweepGC was deprecated in version 9.0 and will likely be removed in a future release.
oedlund@4c0c8152db48:~/git/FeedHandler (detached*)*$ WARNING: An illegal reflective access operation has occurred
WARNING: Illegal reflective access by com.intellij.ide.ClassUtilCore to field sun.net.www.protocol.jar.JarFileFactory.fileCache
WARNING: Please consider reporting this to the maintainers of com.intellij.ide.ClassUtilCore
WARNING: Use –illegal-access=warn to enable warnings of further illegal reflective access operations
WARNING: All illegal access operations will be denied in a future release
Anastasia Kazakova says:
August 5, 2019This is the warning regarding the UseConcMarkSweepGC option. And it’s fine. We use it on purpose (to control the GC and have better performance) and will resolve the warning later.
Sajin says:
October 1, 2019Finally!! This feature works very nicely!! Along with GDB debugging we use another tool for logging called RTT. This requires you to run a JLinkRTTClient, right now there there is an option on Clion to run an application before debug starts, but it would be nice to have an application run during the debug process (or once the the debug has started).
elmot says:
October 2, 2019We are planning to support RTT as long as ITM and Semihosting a little different way – via our own console.
JLinkRTTClient seems to be just a telnet-like application, and, probably, can be replaced with our own tool window.
You may follow tickets CPP-7103 and CPP-15392