CLion 2019.2 EAP: MSVC Debugger, Unused Includes Check, and More

Hi,
A new CLion 2019.2 EAP (build 192.5438.15) is now available. Download the full build from our site, install it via the Toolbox App, or use a snap package if you are using Ubuntu. A patch-update for the previous EAP build will be available shortly.
The main highlights:
- Experimental feature: Debugger for the Microsoft Visual C++ toolchain
- The ‘unused includes’ check is back
- Memory view: ASCII view
- Better performance for code completion
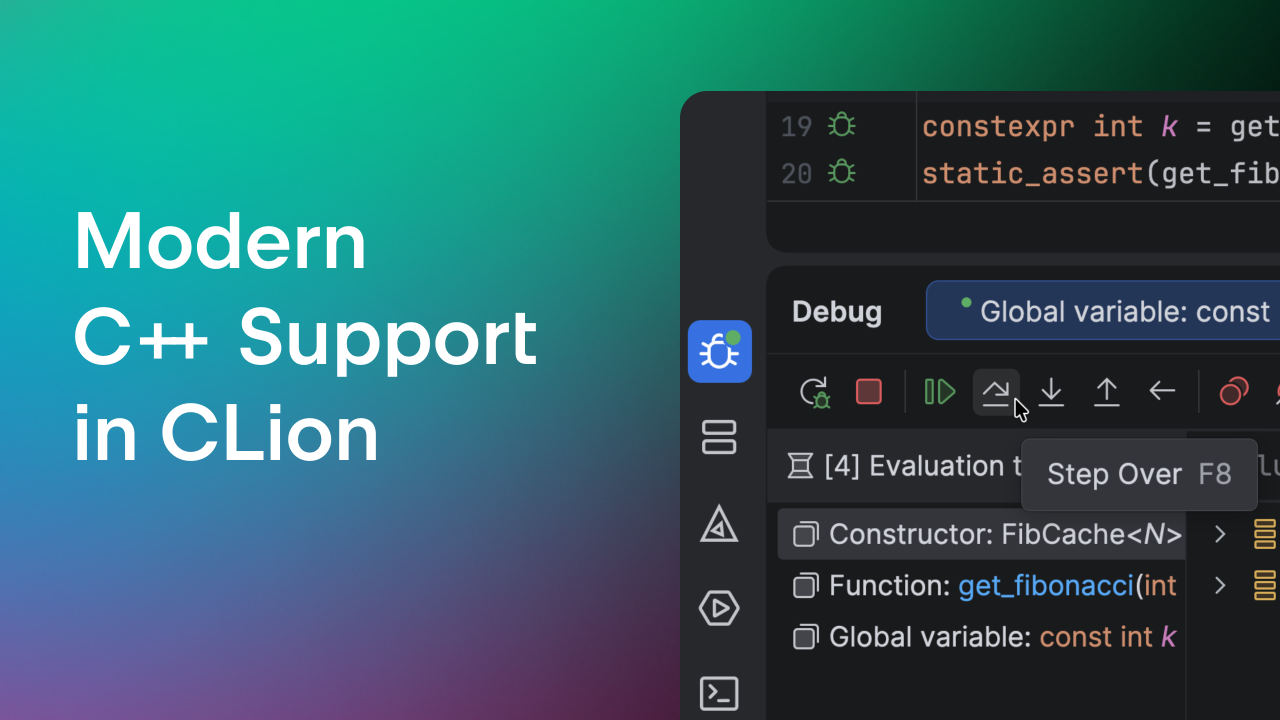
Experimental feature: Debugger for the Microsoft Visual C++ toolchain
For a long while, it’s been possible to use Microsoft compiler in CLion if you had the Microsoft Visual C++ toolchain installed on your Windows machine. However, the debugger was not available in CLion. This is because the Microsoft debugger is proprietary and cannot be used outside of Microsoft tools.
Now CLion is going to ship with an experimental debugger for the Microsoft Visual C++ toolchain!
‘Experimental’ means it’s limited and still has some major issues, listed below. So it’s definitely not release quality yet. We do encourage you to try and give us your feedback. This will help us identify how we can improve its functionality for you.
How to enable it?
As the debugger is experimental for now, you need to explicitly turn it on to use it. Call up the Maintenance dialog (Shift+Ctrl+Alt+/ on Linux/Windows, ⌥⇧⌘/ on macOS) | Experimental features, and select cidr.debugger.lldb.windows to control it.
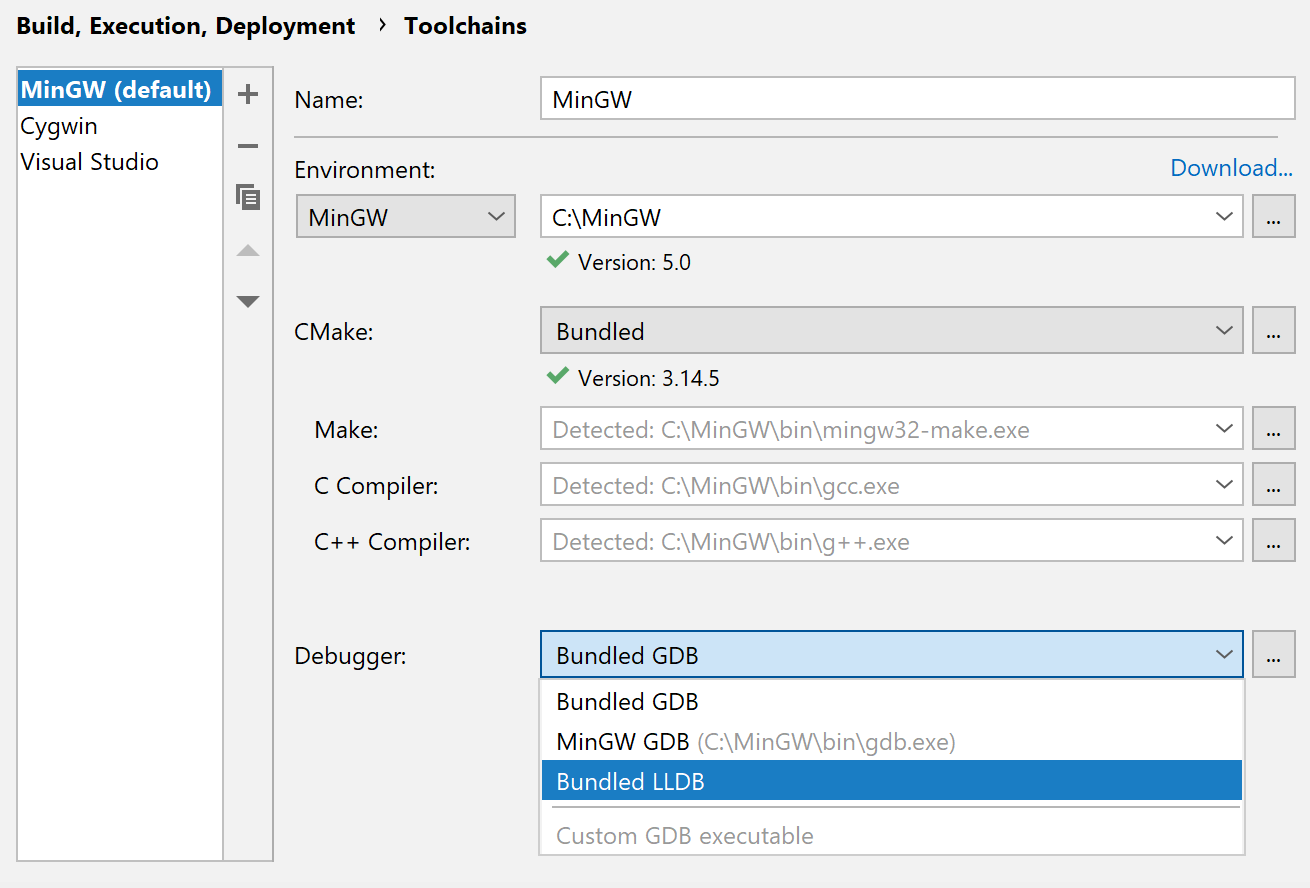
Now, when you select the Visual Studio toolchain in CLion, the debugger is available:

Known issues and diagnostics
As the feature is still in progress, here is a list of known issues, so please consider them before submitting any additional ones.
Native visualizers
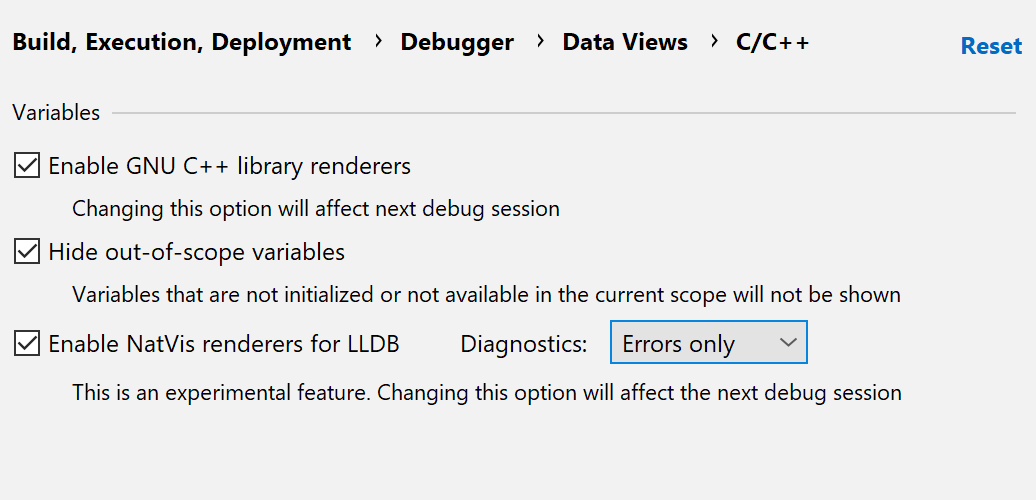
For the Visual Studio C++ toolchain, STL native visualizers are taken from the Visual Studio installation. To enable them, use Settings | Build, Execution, Deployment | Debugger Data Views | Enable NatVis renderers for LLDB. Note, you can configure the proper diagnostics level here. Possible options are Disabled, Show only errors, or Verbose. (To report an error with renderers to our issue tracker, please select Verbose.)
Not all of the STL types are rendered correctly in CLion (CPP-16661):
- The following containers mostly work (in basic cases): string, list, vector, deque, array, stack, queue, priority queue, unordered_mutlimap, unordered_multiset, unordered_set, and unordered_map.
- The following containers do not work: forward_list, map, set, multimap, and multiset.
- Nested visualizers in containers are not yet supported.
- There are a few known issues with the rendering of smart pointers in some cases.
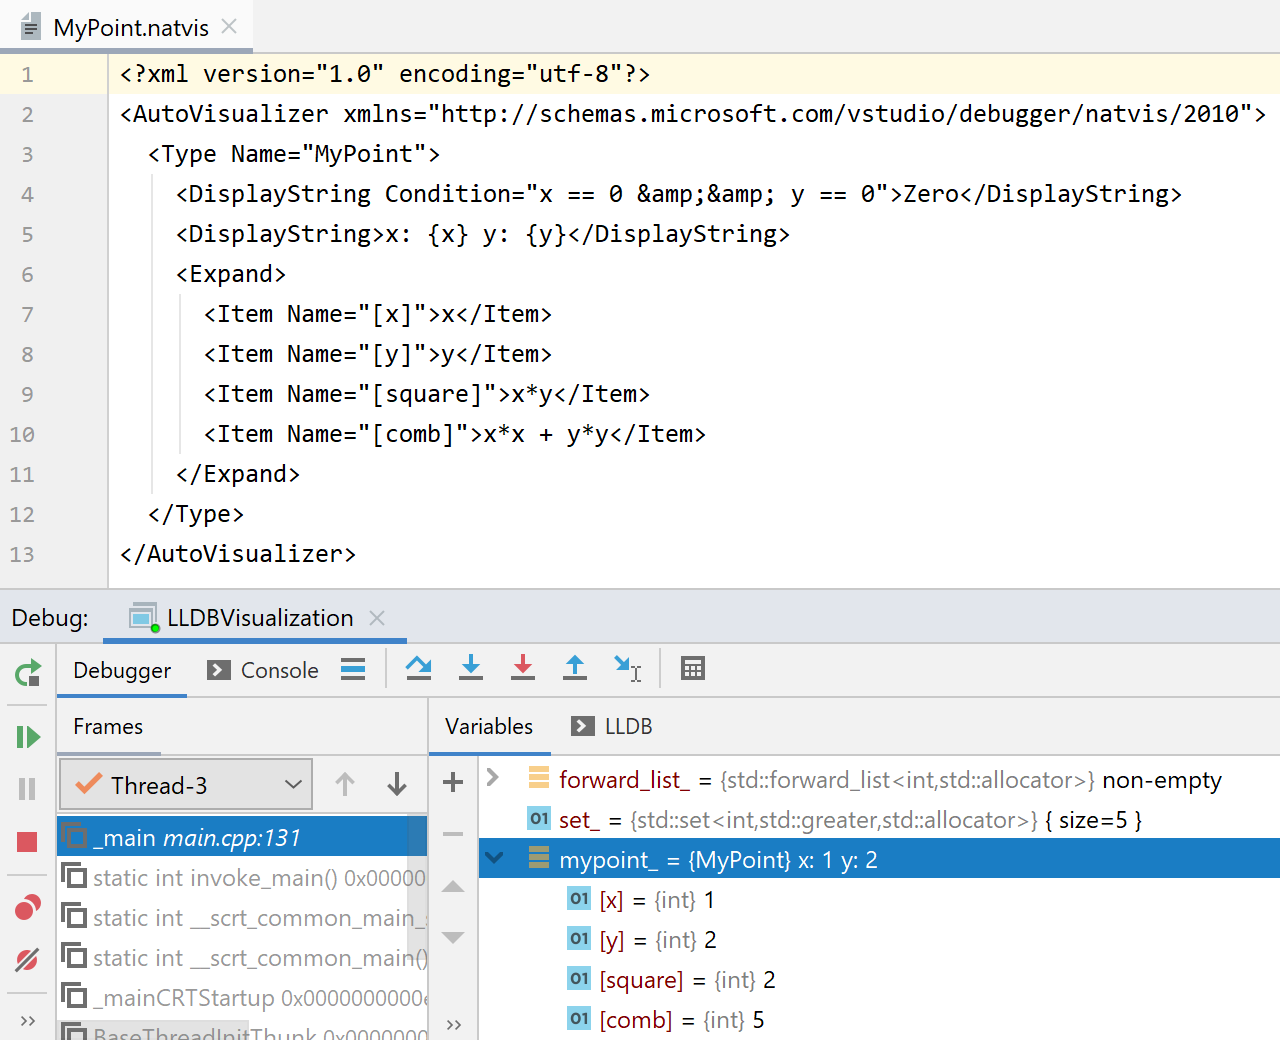
By the way, if you have any custom native visualizers in your project, CLion will use them as well:
Other known issues:
- Data breakpoints are not yet supported.
- Exception handling:
- Break on exception throw/catch is not yet supported.
- Stepping through the exception blocks has issues.
- Target output may not be flushed on breakpoint hit.
- Force step into the assembly code without debug symbols is not yet supported.
- Thread names are not rendered.
How it works
The debugger is implemented by our team on top of LLDB. Even though we’ve upstreamed many changes introduced by this effort, there are still some things that are not available in the LLVM public repository. That’s why we bundle the proper version of custom LLDB within CLion.
What about LLDB on Windows in general?
Upd. LLDB for MinGW was disabled in the final release 2019.2 and is not supported for now.
Since the newly implemented debugger is based on LLDB, it’s reasonable to request it in other cases on Windows as well. Well, guess what? It is there! LLDB for MinGW is also present when the experimental feature is turned on.
The implementation is also experimental as many standard containers and types are not rendered properly for now. For example, array and string should work fine, but for the rest of the standard containers there are some issues (monitor CPP-16660 for more details).
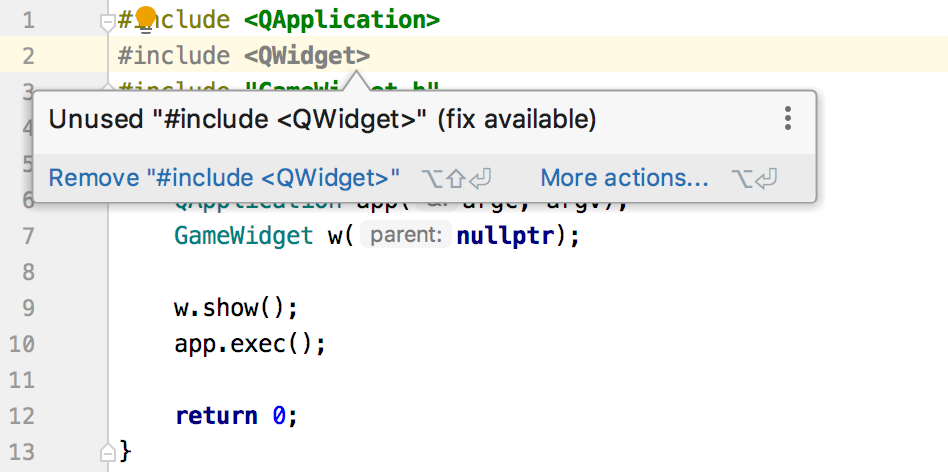
The ‘unused includes’ check is back
Since its launch, CLion has had a code check that detects and marks unused #include directives. However, some time ago we disabled it by default (in Settings / Preferences | Editor | Inspections | C/C++ | Unused code | Unused include directive) because of the many false positives.
Now the check is completely reimplemented on top of the Clangd-based language engine and is, again, enabled by default!
Note that if you disable the Clangd-based engine in CLion (which we do not recommend, as the engine not only speeds up code highlighting and other code assistance features, but also provides more accurate code errors and warnings), then the unused includes check will simply follow the old behavior.
Diagnostics strategies
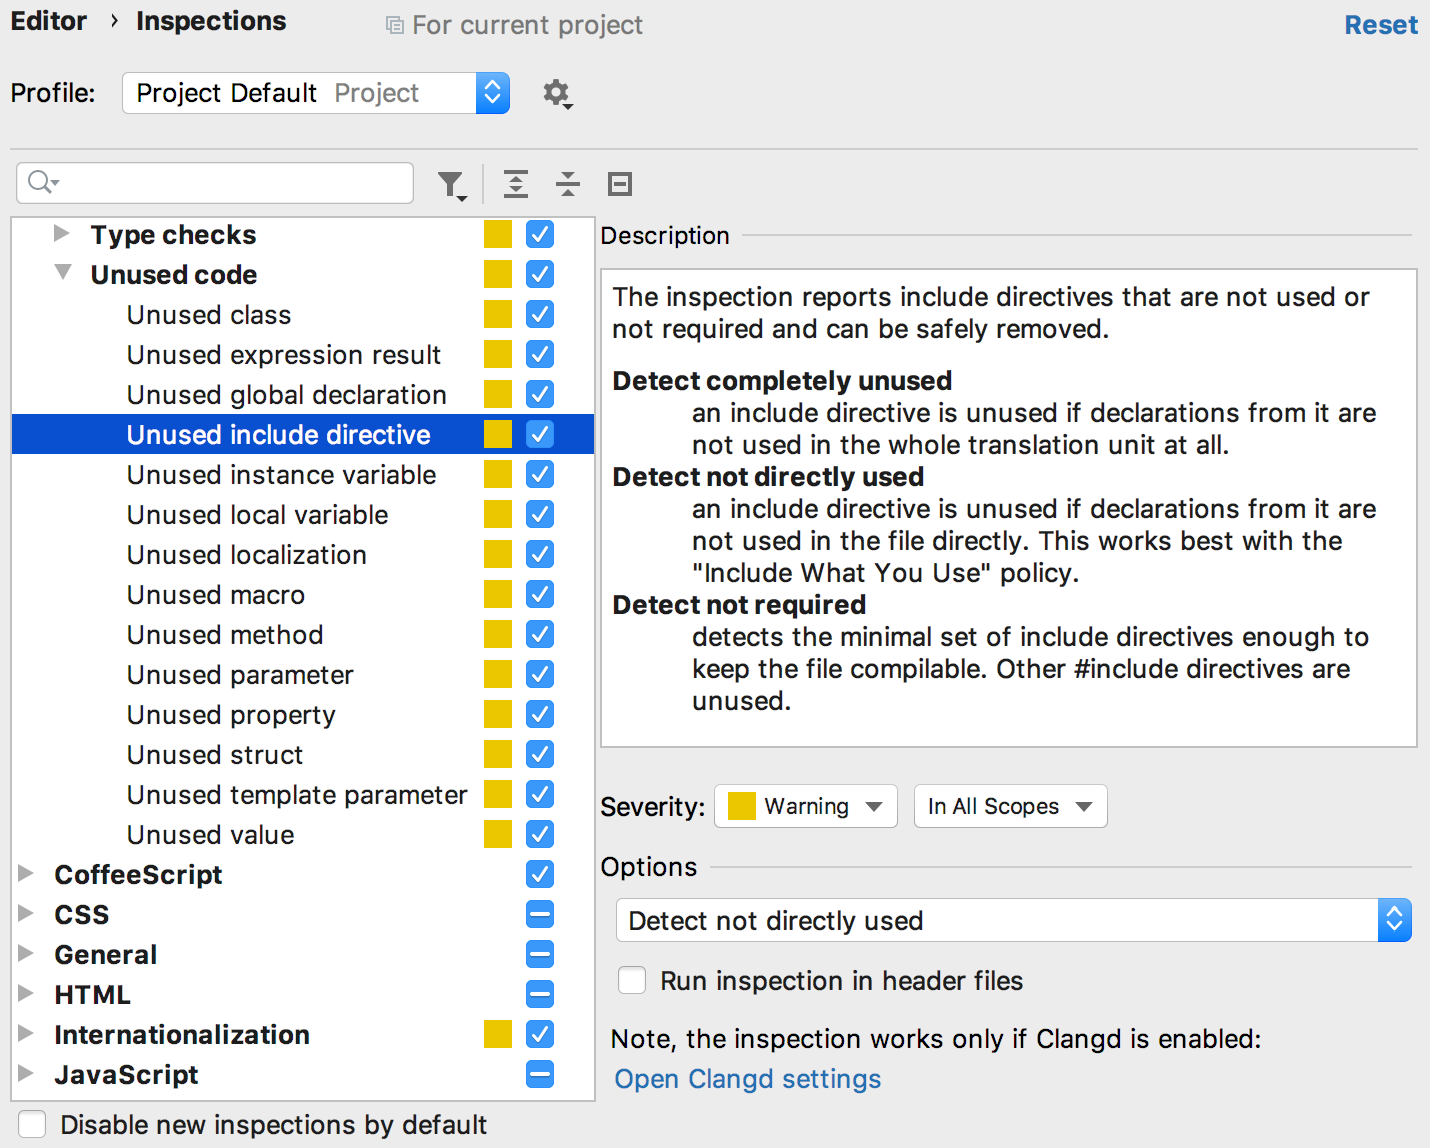
There are several strategies you can follow to detect the unused or not required #includes directives and remove them:
- Detect completely unused: the most conservative strategy, which detects only the
#includesdirectives with the declarations never used in the whole translation unit at all. - Detect not directly used: this strategy follows the “Include What You Use” principle and detects the
#includesdirectives with the declarations not used in the current file directly. - Detect not required: the most aggressive strategy which detects the minimal subset of the
#includesdirectives to keep the file compilable and suggests removing all the rest.
You can switch between the strategies in the inspection settings. By default, Detect not directly used is selected:
How it works
To avoid false positives, we’ve set a few rules in the newly implemented inspection algorithm.
First, you can enable or disable running the inspection in the header files (by default, it’s disabled). If you decide to run the inspection in headers, then the “Umbrella headers” rule will be used. “Umbrella headers” are used to include all the necessary headers at once and contain no declarations at all. The inspection naturally doesn’t work for such headers.
Second, the source files with compilation errors will never get unused #includes directives – all directives will be considered used.
Finally, the inspection only checks the headers with #pragma or header guards. If none of them are present, the header will be always marked as used.
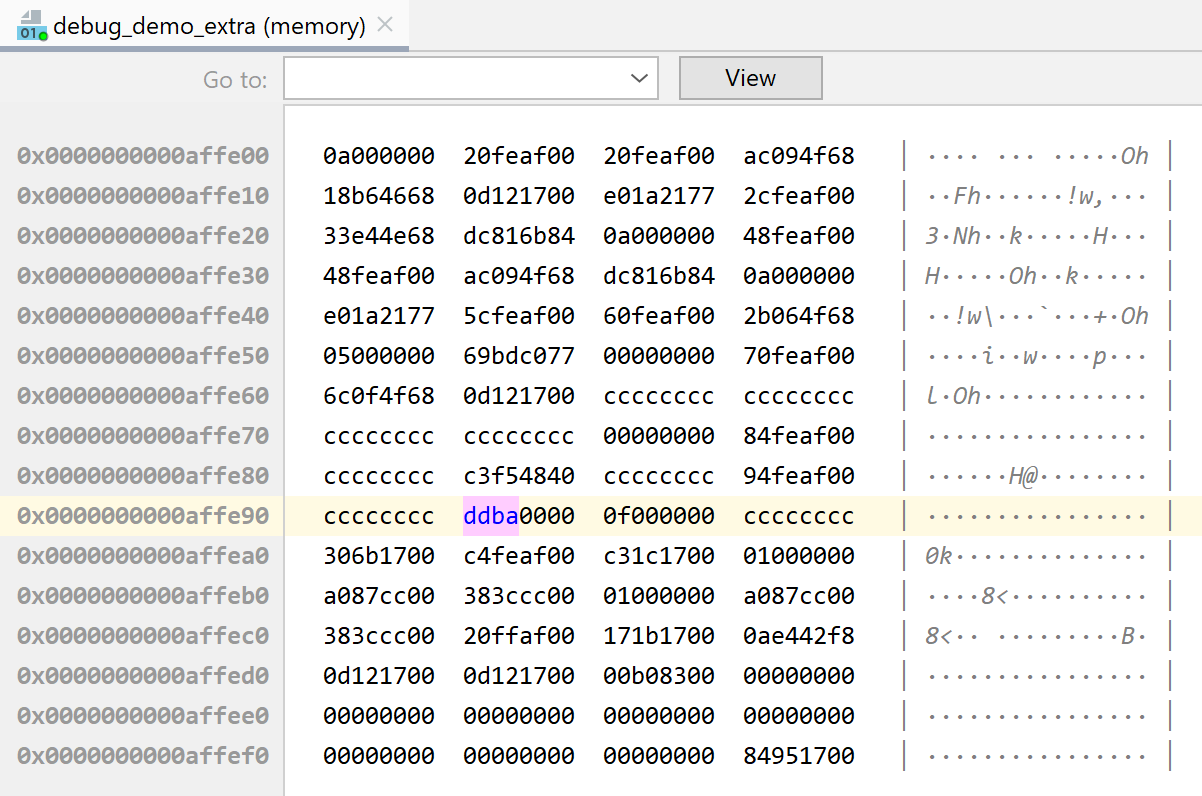
Memory view: ASCII view
CLion’s Memory view is improved in this EAP build. Earlier in 2019.2 EAP, we added Go to address. Now, behold the ASCII view:
Better performance for code completion
Completion for qualified expressions has been significantly improved (CPP-16406). The boost is especially noticeable in LLVM project.
The full release notes are available here.
Your CLion Team
JetBrains
The Drive to Develop