CLion 2021.3 EAP: Enhanced Standard Library Types Rendering and View as Array in Debugger, Zephyr RTOS, and LLDB 13

The new CLion 2021.3 Early Access Preview build, 213.5449.26, is available from our website via the Toolbox App, or as a snap package (if you are using Ubuntu). If you are on macOS, there is a separate build for Apple silicon (M1 chip). A patch update will also be made available shortly.
Debugger
The new Debugger UI was introduced earlier in 2021.3 EAP. The goal was to improve the general debugging workflow speed and make popular actions more discoverable. Thank you to everyone who tried it out and shared their feedback with us! We’ve analyzed it and decided to bring the old layout back by default in the 2021.3 release cycle. Meanwhile, the new Evaluate Expression field will be kept in 2021.3. We’ll continue to work on a new debugger UI in the next releases.
In this EAP you can also find the following debugger enhancements:
- Improved standard library types rendering
- Show pointers as arrays
- Module name and thread id
- Customizable debugger presentation
- Zephyr RTOS thread view
- Bundled LLDB 13
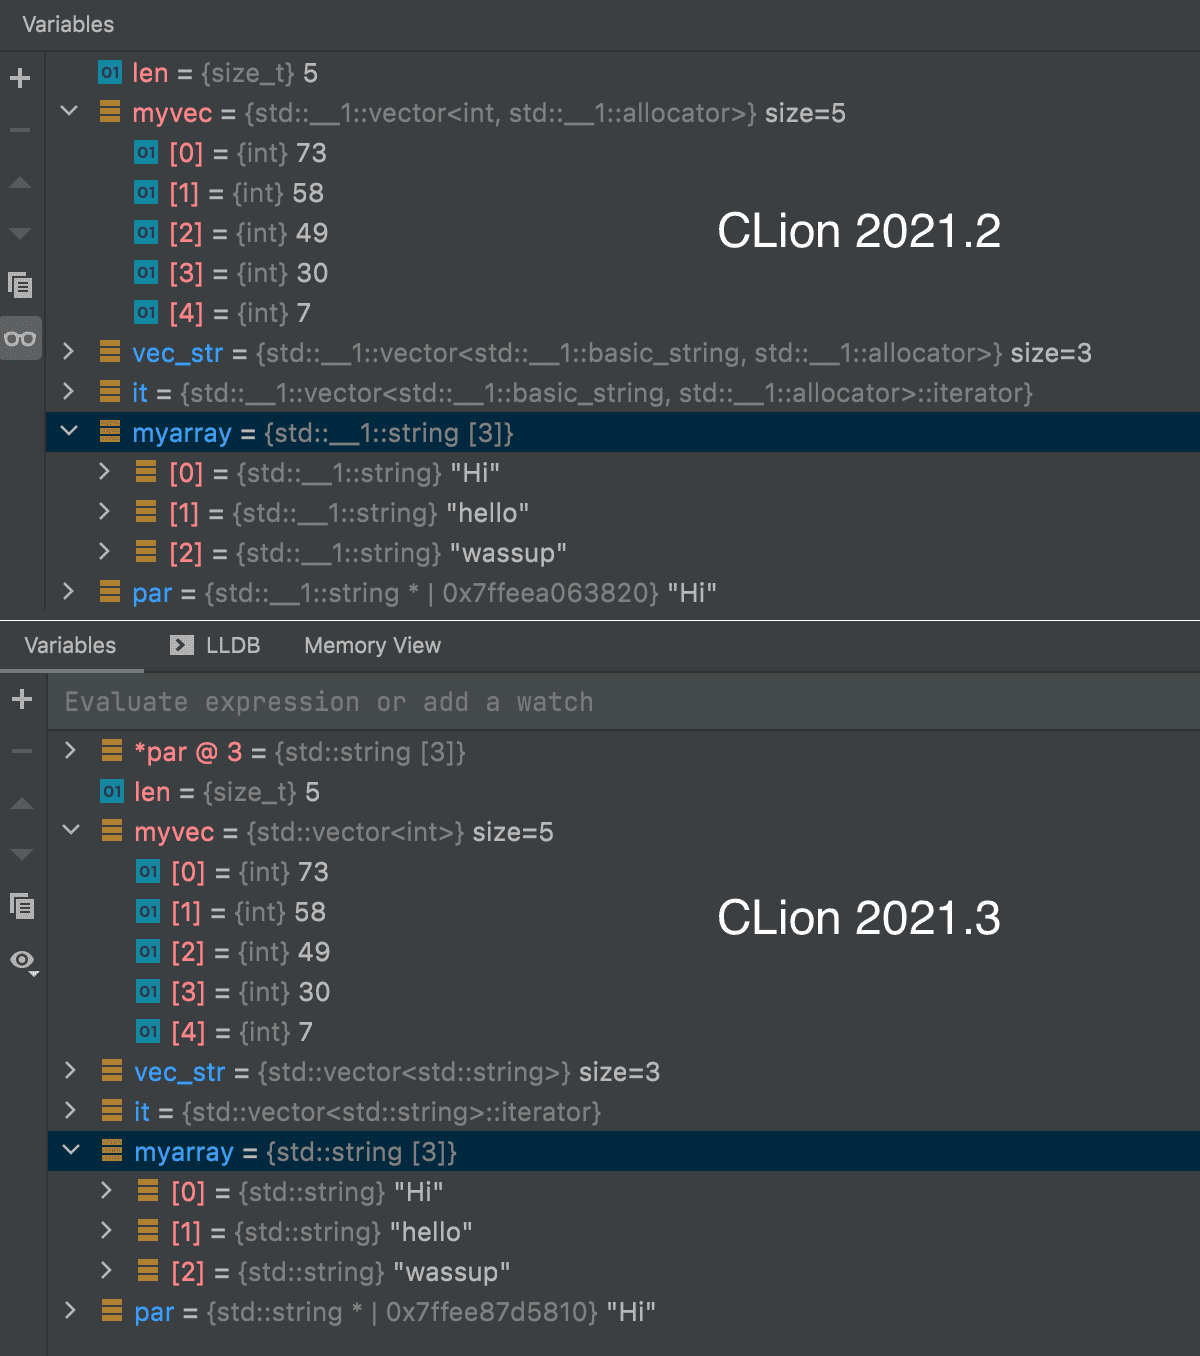
Improved standard library types rendering
When debugging, variable values are some of the most important pieces of information to inspect in the code and can help you to detect code issues quickly. The variable type is also useful as it helps you treat the value correctly. However, some heavily templated standard library types, or types with global and obvious namespace specifiers, can produce long entries in the variables view. The same applies to function signatures in the frame views.
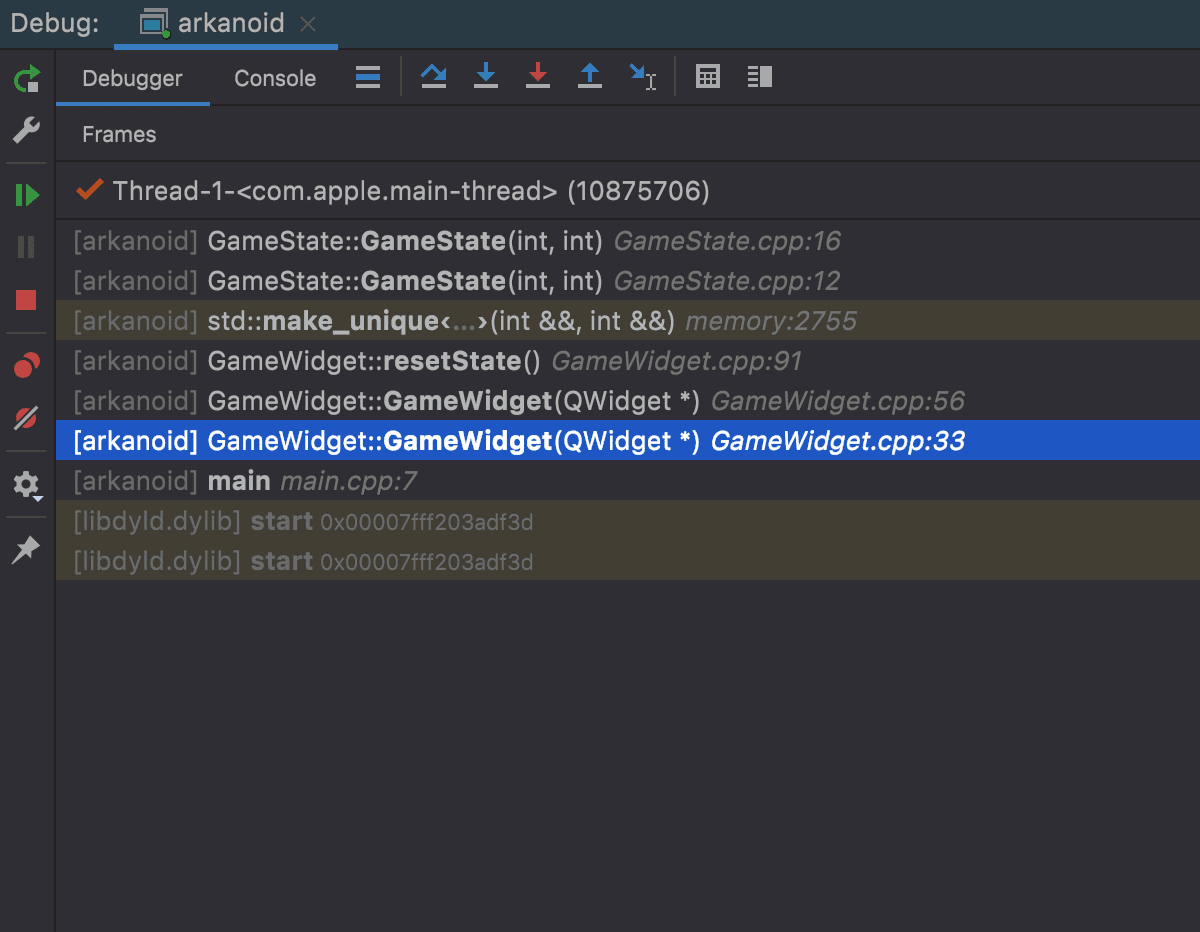
CLion now performs some additional processing to render frames in the frames view and types in the variables view in a more readable and friendly way.
For types (for both variables and frames):
- Strip auxiliary namespaces, global and function scope specifiers, and standard library ABI version namespaces.
- Simplify standard library types by replacing standard library types with more readable aliases.
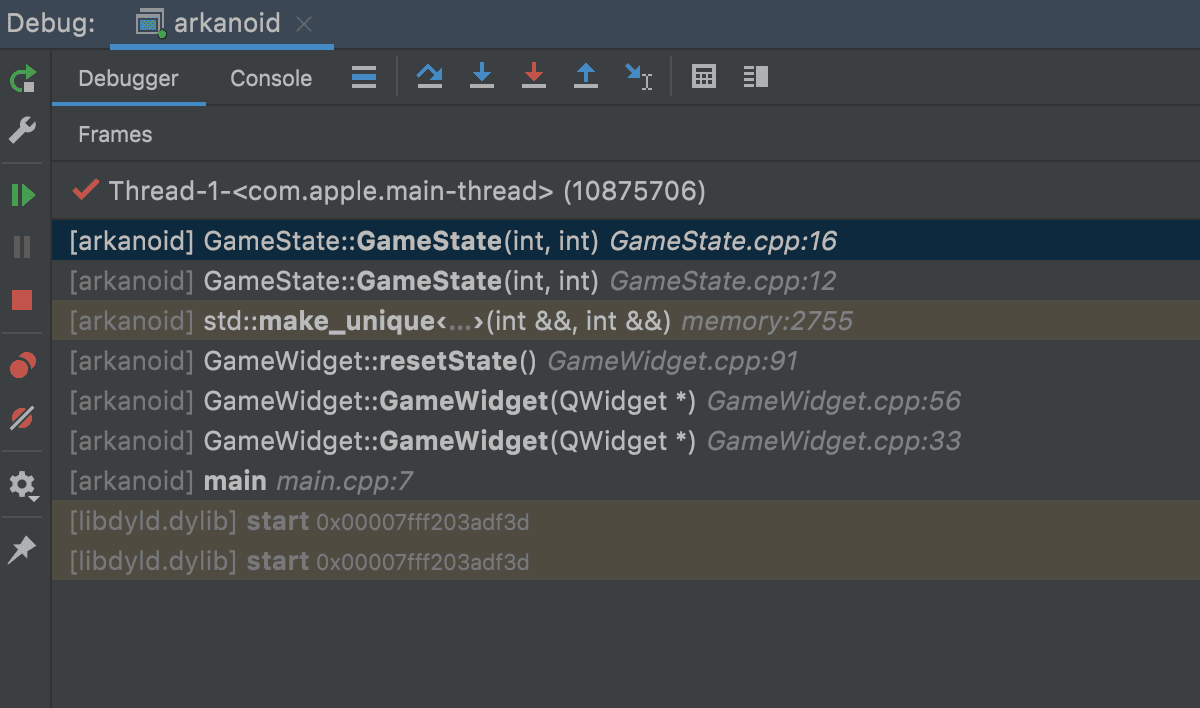
For functions in the frames view:
- Remove return type, if any
- Hide function parameters
- Hide template arguments of enclosing types and the function itself, if any
- Render the name of the function in bold to be easily distinguished from namespaces and enclosing types
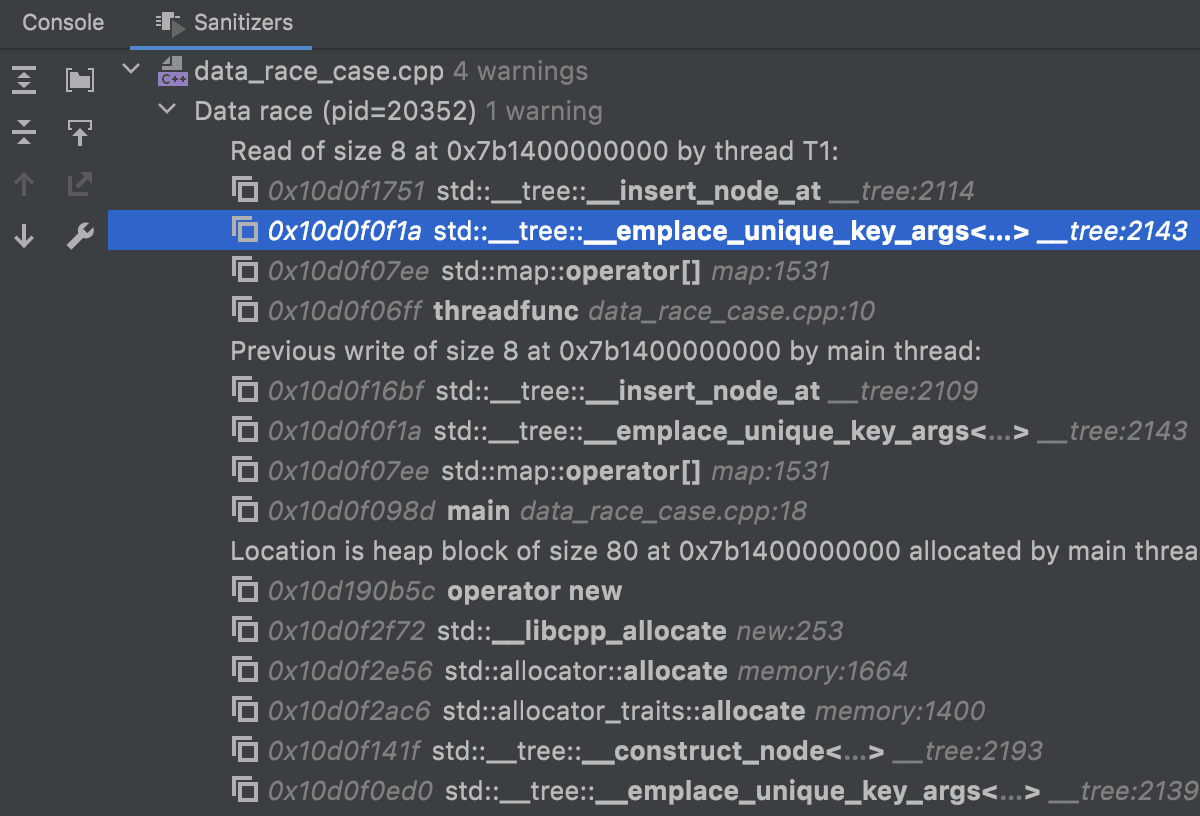
In addition to functions in the frames view and types in the variables view, the changes also affect how CLion shows stacks in the Sanitizers view:
Show pointers as arrays
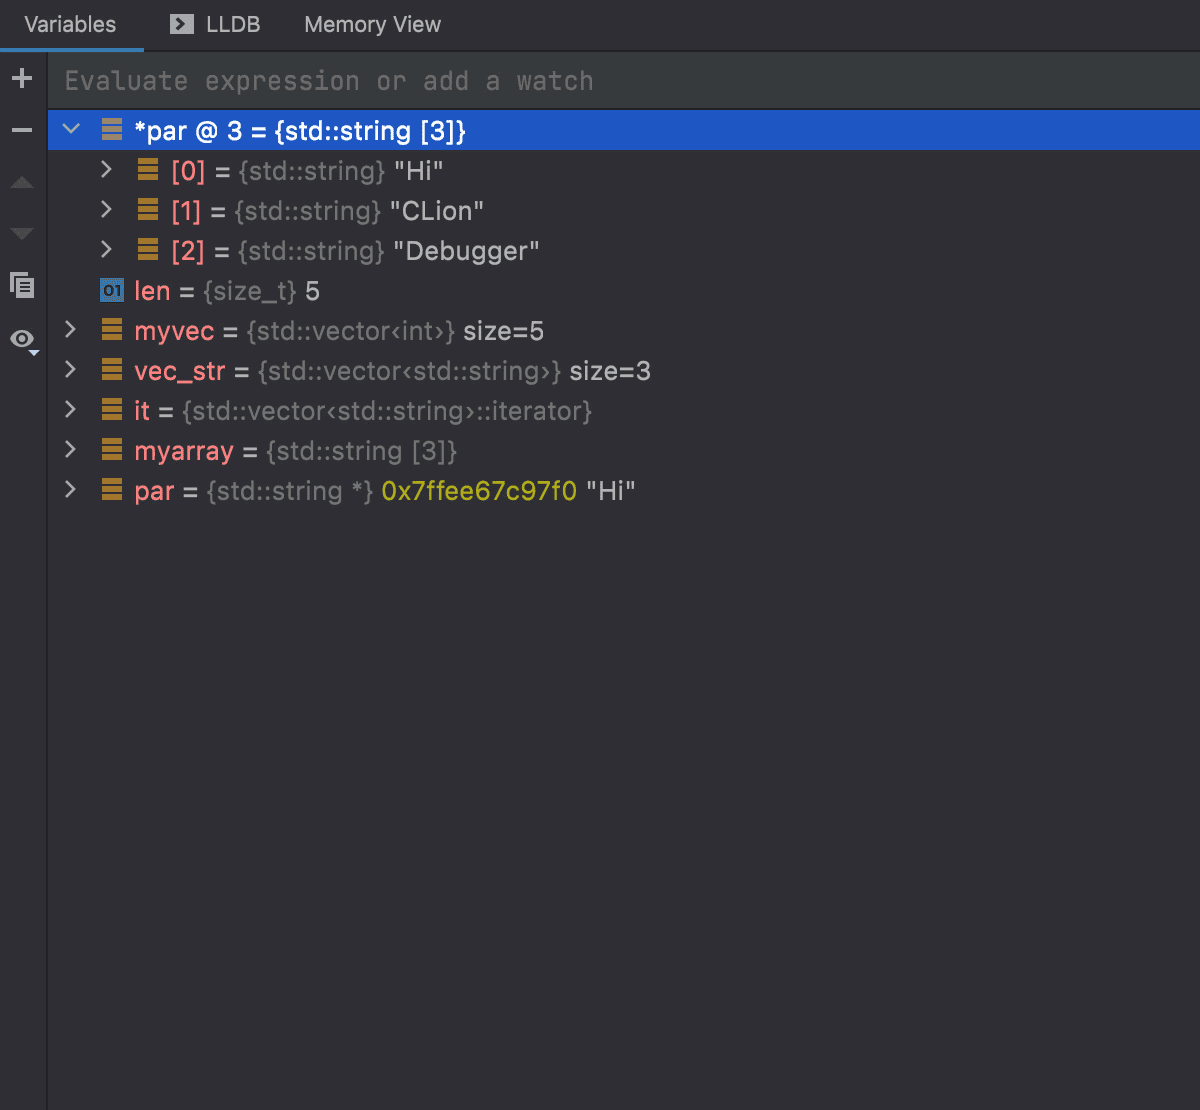
A new action View as Array… is now available for any pointer variables and adds a watchpoint that renders a pointer value as array. The action is available in the context menu in the variables view. All you need to do is specify the size of the array:
Module name and thread ID
There are cases where the code can be compiled to different modules, like template functions. To know in which binary the code is being executed at any moment, the debugger can now show the module name.
Module names in the debugger have to be enabled explicitly. There are 2 ways to do this:
- Enable Show Module Name in the context menu in the frame view
- Enable Show module name in Settings/Preferences | Build, Execution, Deployment | Debugger | Data Views | C/C++
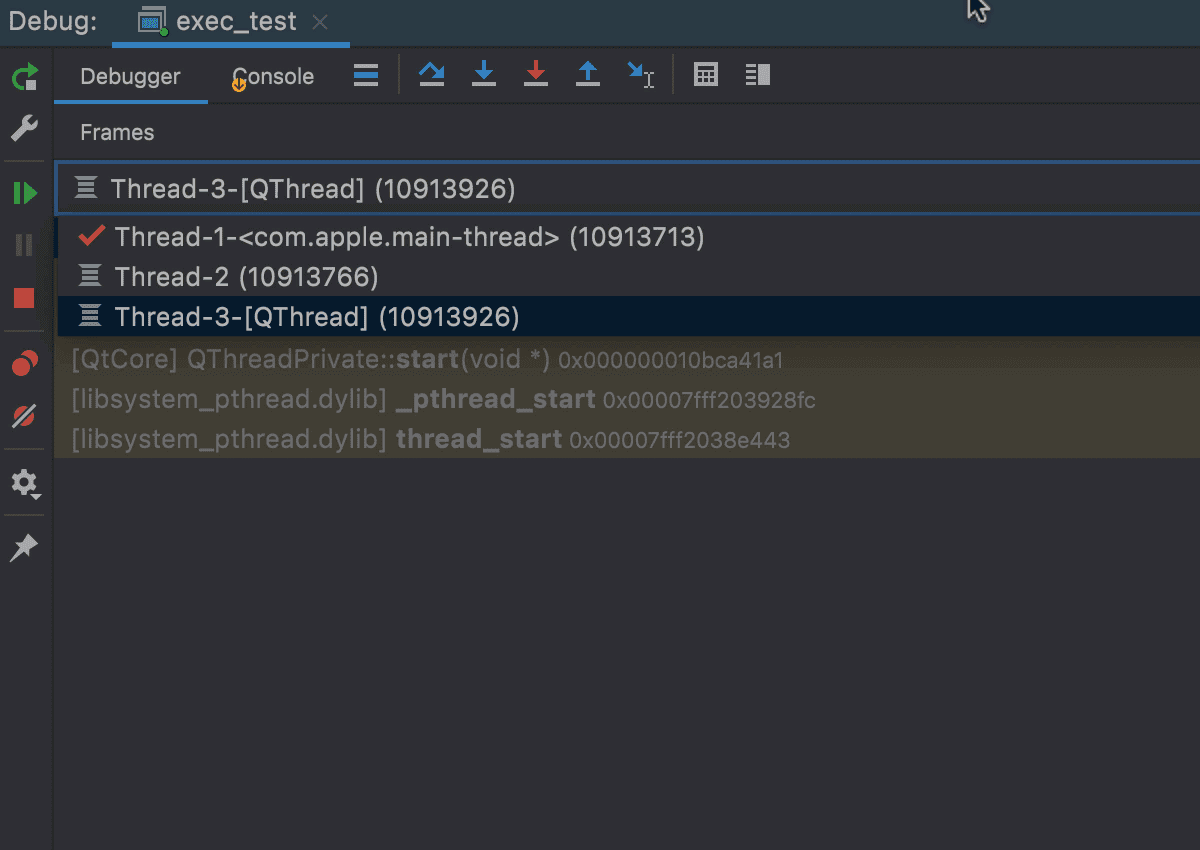
The thread ID given by the OS on thread start can help you identify the thread you are interested in when debugging and is now shown in the thread list along with the thread name.
Customizable debugger presentation
To control the presentation of the types, variables, and frames in the debugger, we’ve added new settings to Settings/Preferences | Build, Execution, Deployment | Debugger | Data Views | C/C++:
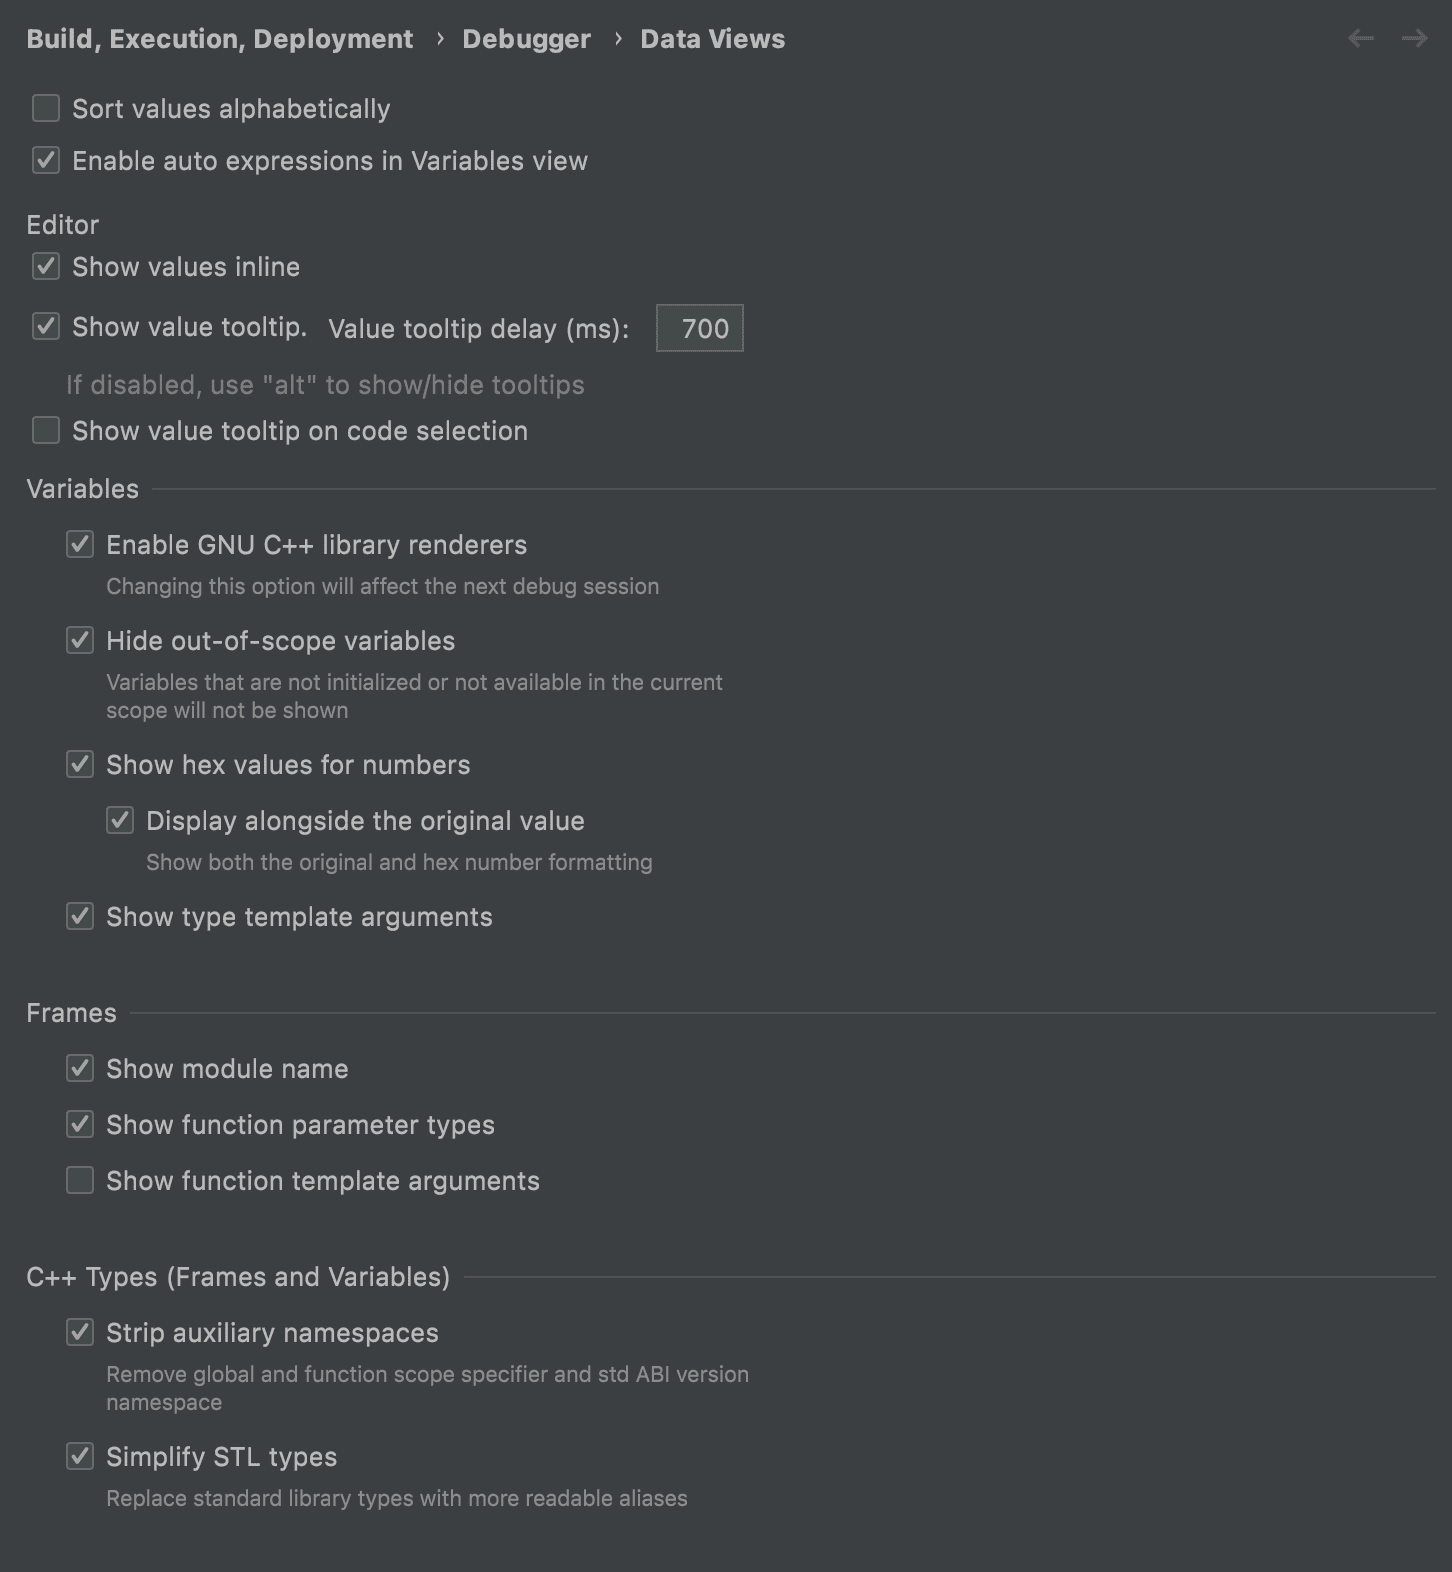
Here you can control stdlib types rendering, module names, function parameter types and function template arguments, and other things we just recently introduced.
Alternatively, you can control the presentation from the context menu right in the debugger tool window. In Frames view:
And in Variables view:
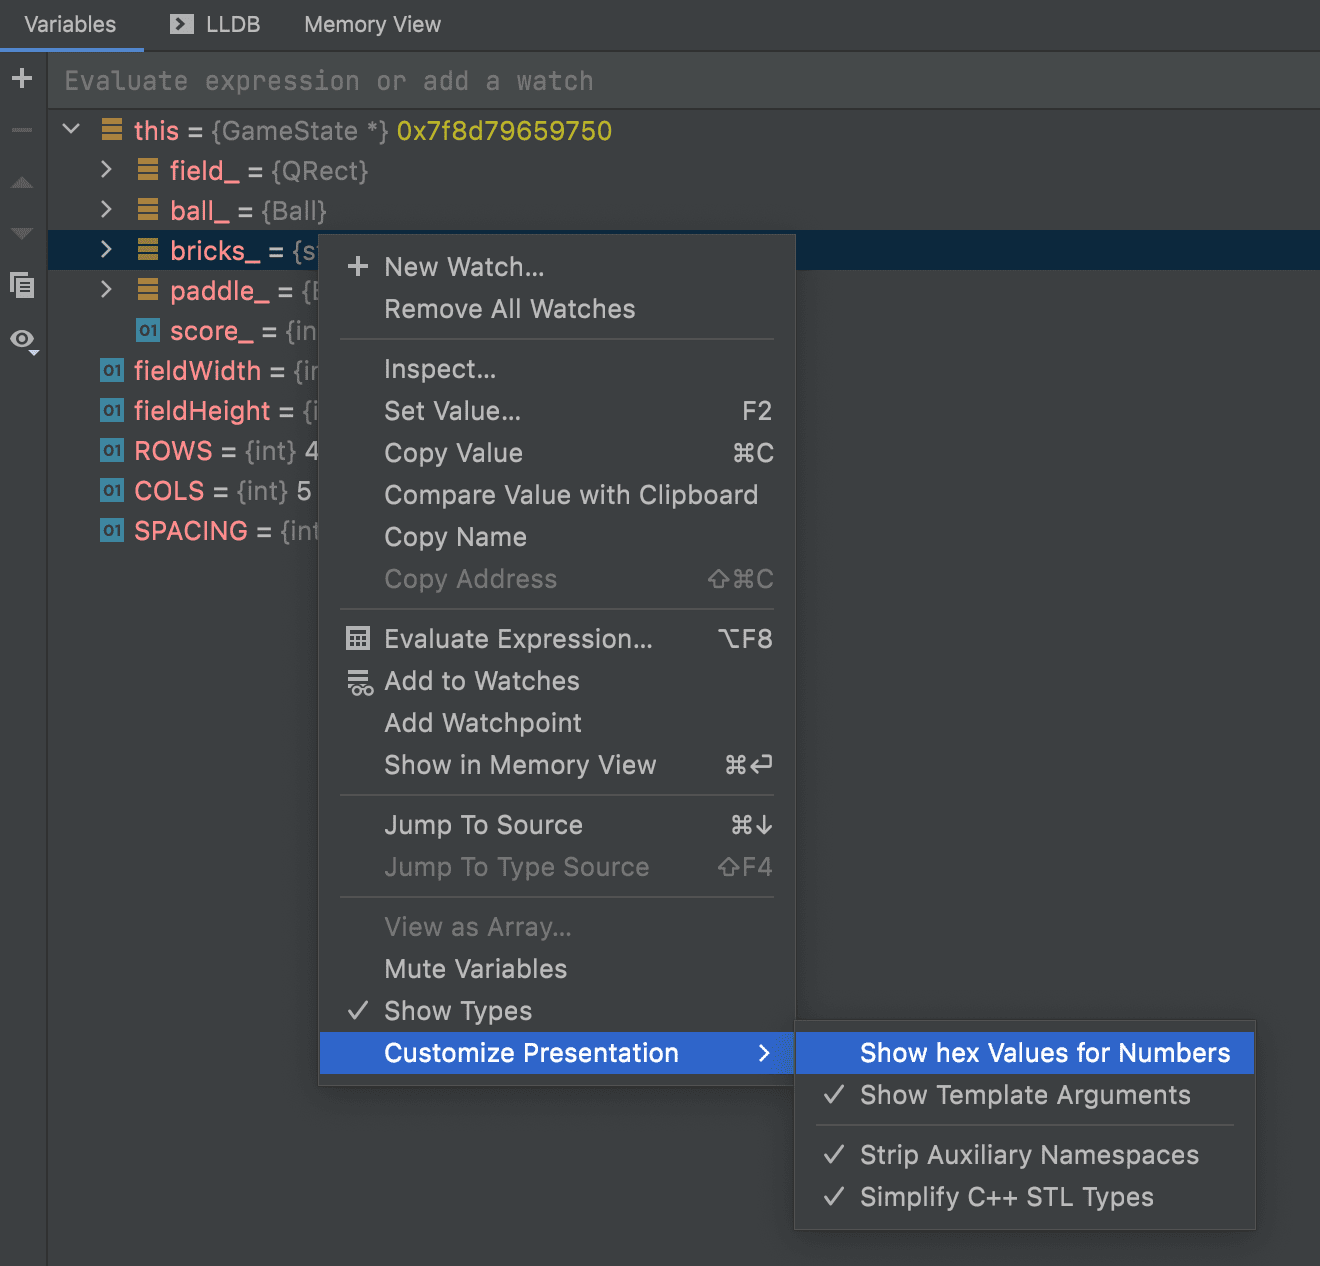
Have you spotted the hex view in these settings? You can now enable it here or in Settings/Preferences | Build, Execution, Deployment | Debugger | Data Views | C/C++.
Zephyr RTOS thread view
Views with tasks, queues, timers, and a heap usage view were added for multi-threaded FreeRTOS debugging in one of the previous CLion 2021.3 EAP builds. We’re continuing to develop the debugger for RTOS further. Evaluate expression was fixed and now works on RTOS threads.
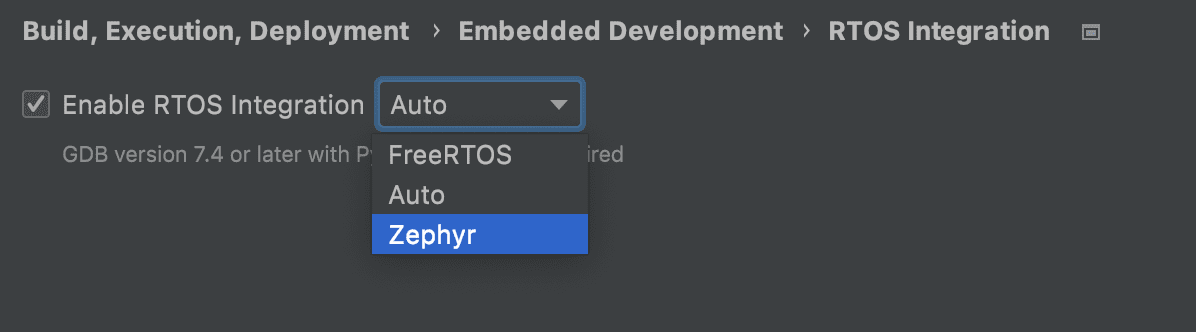
Zephyr RTOS Thread view is now available! Enable it in Settings/Preferences | Build, Execution, Deployment | Embedded Development | RTOS Integration:
Tasks view similar to the one available for FreeRTOS is now available for Zephyr RTOS:
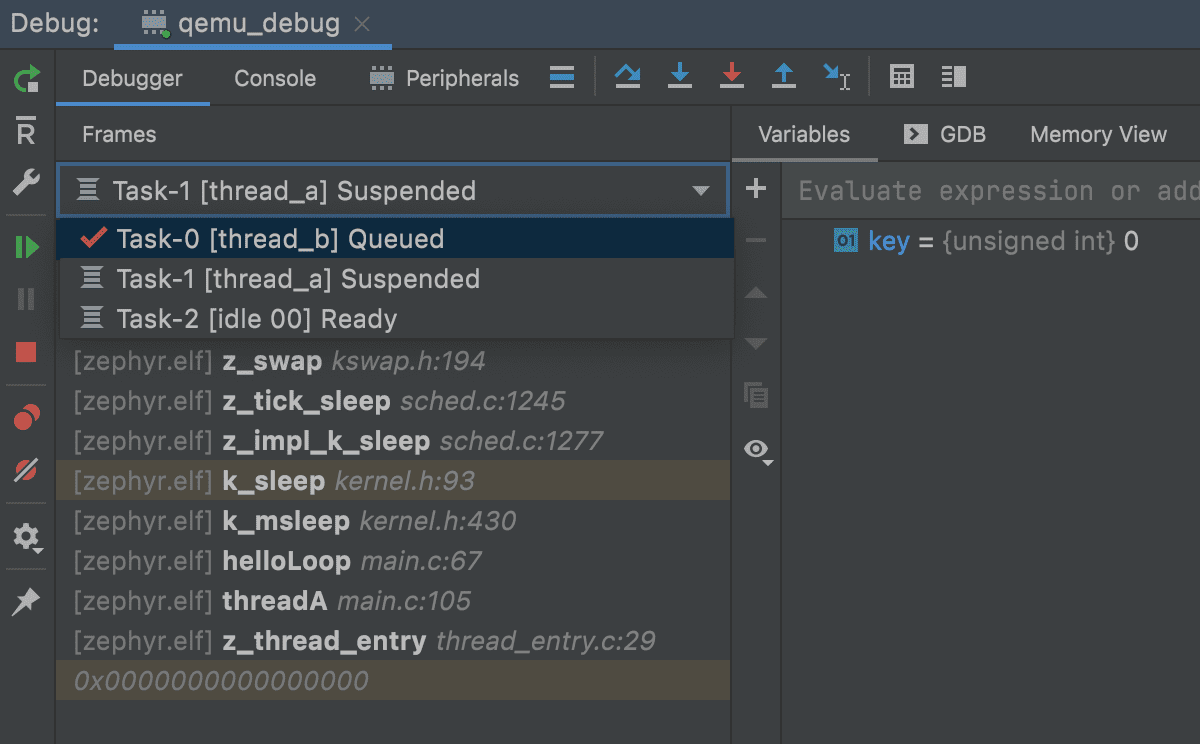
Don’t forget to enable CONFIG_THREAD_MONITOR and CONFIG_THREAD_NAME in your project configuration files, otherwise the debugger won’t be able to extract the required information.
LLDB 13
A new LLDB 13.0 is now bundled on macOS and Linux in CLion.
Fixes for type hints
In CLion 2021.3 EAP, we added type hints for deduced types. This build brings a few fixes for them:
- Improved type hints for dependent types
- Correct type hint now shown for the initializer list of the templated instance
- Return type hints now shown for lambdas with the parameter list omitted
The full release notes are available here.
Your CLion team
JetBrains
The Drive to Develop