Datalore
Collaborative data science platform for teams
New in Datalore: New UI, code insight, support for Zeppelin, Plotly and more
It’s been a while since we last published any news about Datalore, but the team hasn’t been idle this whole time. Actually, it’s quite the opposite. We have been working hard on a complete revamp of the product. And now we are happy to present the new Datalore UI, which we already deployed last week for some users, along with a bunch of new features and improvements.
New in Datalore
Reworked UI
By reimplementing our front-end in Kotlin+React+TeaVm, we’ve improved Datalore’s performance and usability, refreshed its look and feel, and simplified the codebase. It’s now much easier to find your notebooks – both your own and those that have been shared with you by your colleagues.
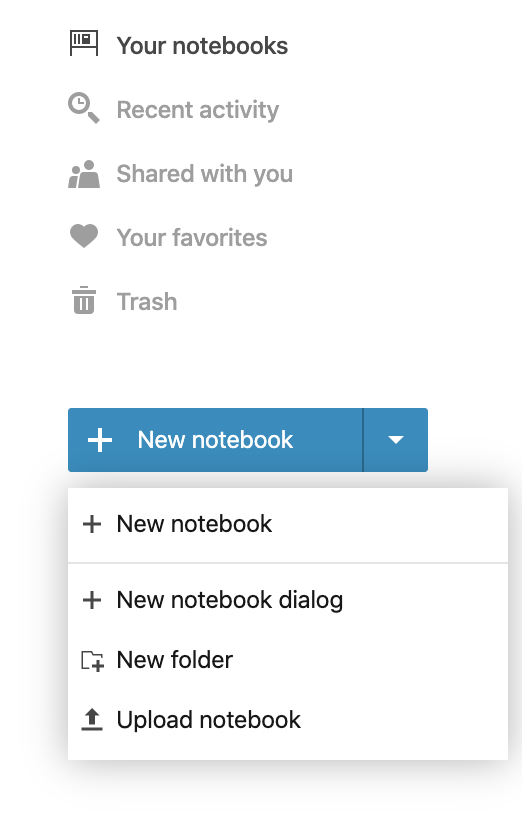
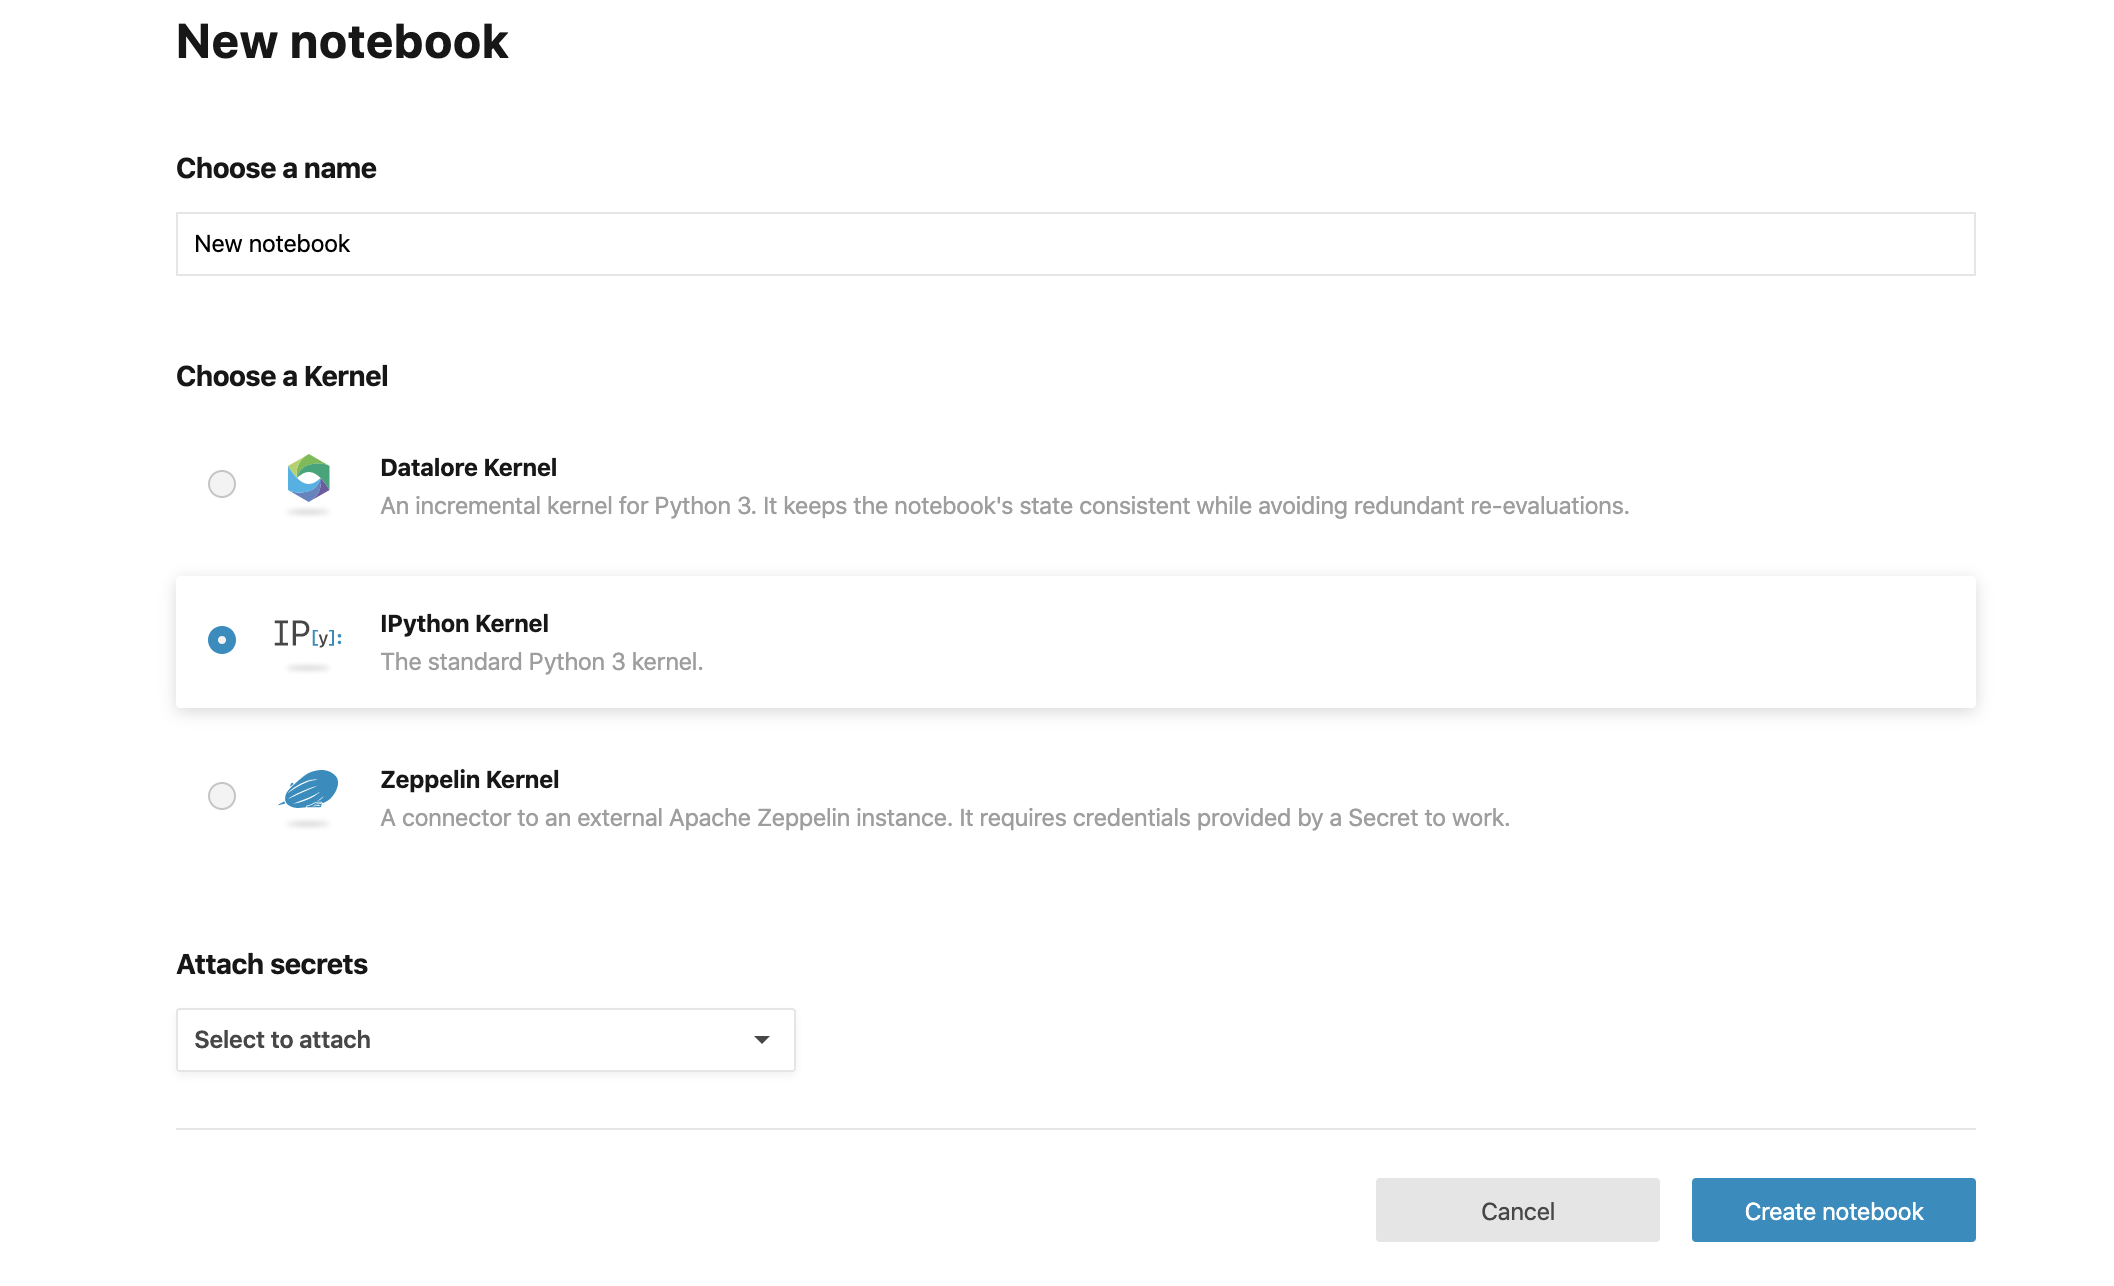
When you create a new notebook, you can now choose the type of kernel to use: Datalore incremental kernel, Jupyter, or Zeppelin. Even though we already supported Jupyter notebooks, we’ve now made it easier to pick which kind of notebook you’re making.
Zeppelin support
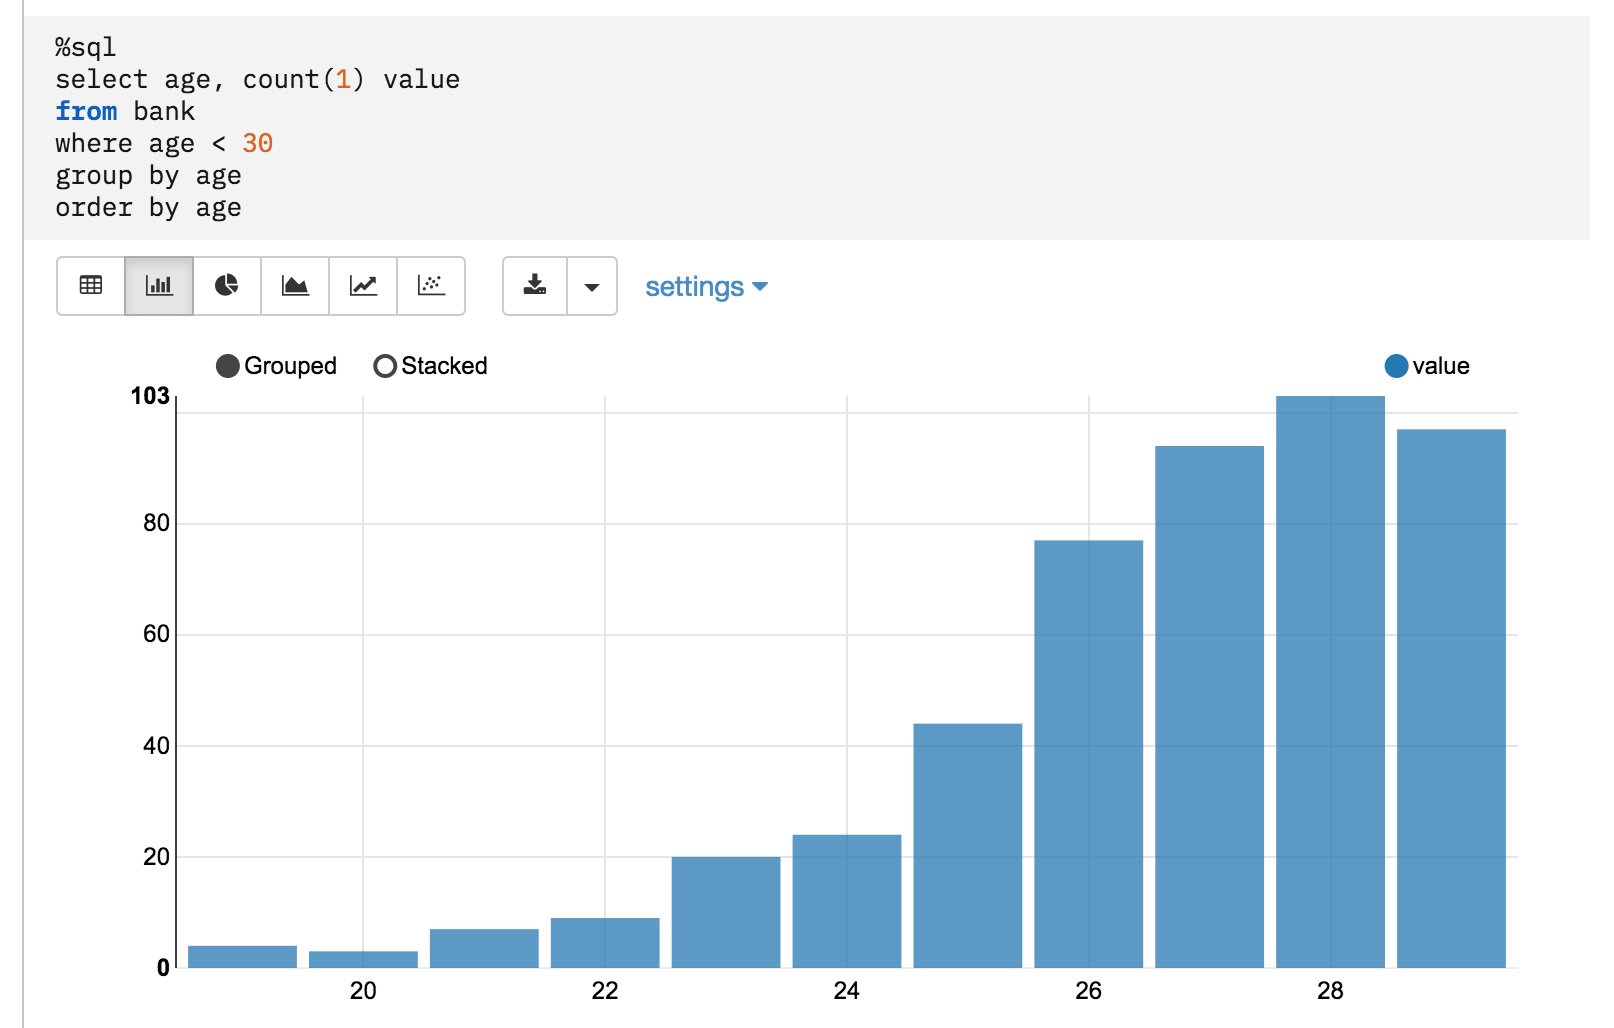
Now it is possible to use the Zeppelin notebook kernel in Datalore. Note that currently this support differs from Datalore and Jupyter kernels in that Datalore doesn’t manage the lifecycle of a Zeppelin kernel. In order to use Zeppelin, you have to provide the credentials for the running Zeppelin kernel in the form of a secret. Once you do, you will be able to run Python and SQL code cells on it.
Workspaces
Are you working on several projects at the same time? In this update, we’re introducing Workspaces. This is a convenient new way to organize and share your notebooks.
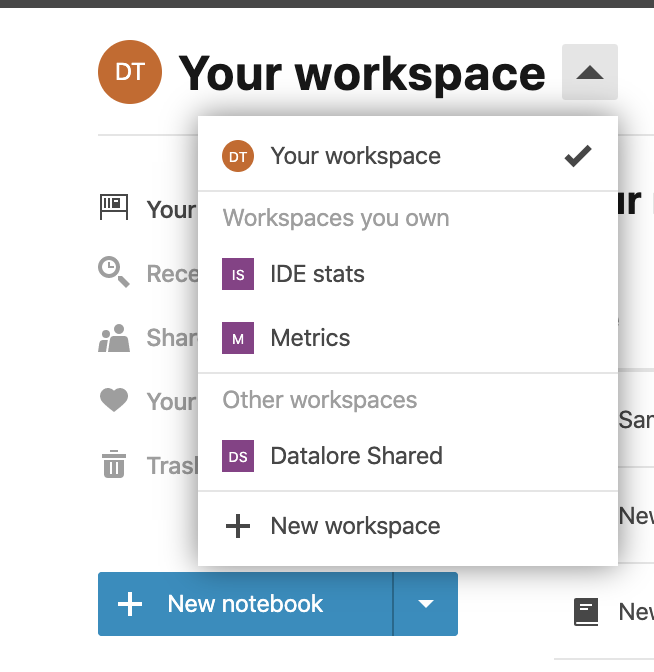
At first, there is only one workspace, called “Your workspace”. Notebooks created in this workspace can be shared individually with your peers.
To keep your separate pieces of work organized, you can create different workspaces and switch between them when necessary. This allows you to keep all the notebooks that belong together in the same place. The newly created workspace can be shared in its entirety, which will cause it to appear in your colleagues’ lists of workspaces. Now you can focus on analyzing data rather than organizing notebooks.
New code insight
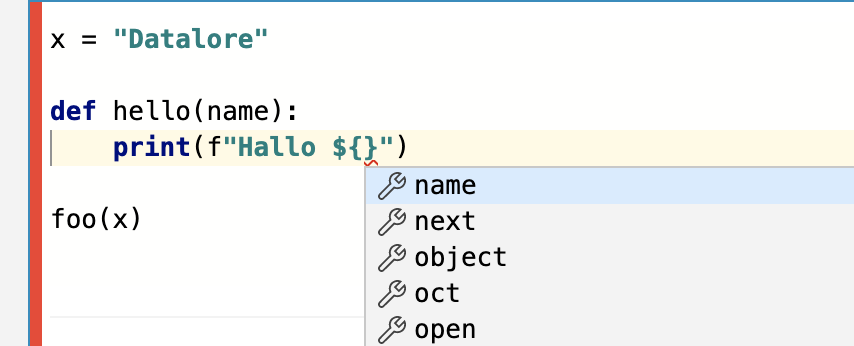
Powered by the PyCharm code insight engine on the server side, Datalore now offers much better assistance for writing Python code. Navigation, error reporting, and code completion are now provided on the same level as the top-notch Python IDE.
Improved markdown support
Last fall, we updated the markdown editor, and now we have implemented a completely different rendering engine that allows us to support a wider set of markdown features and makes the experience of editing notebooks even faster than before.
Plotly support
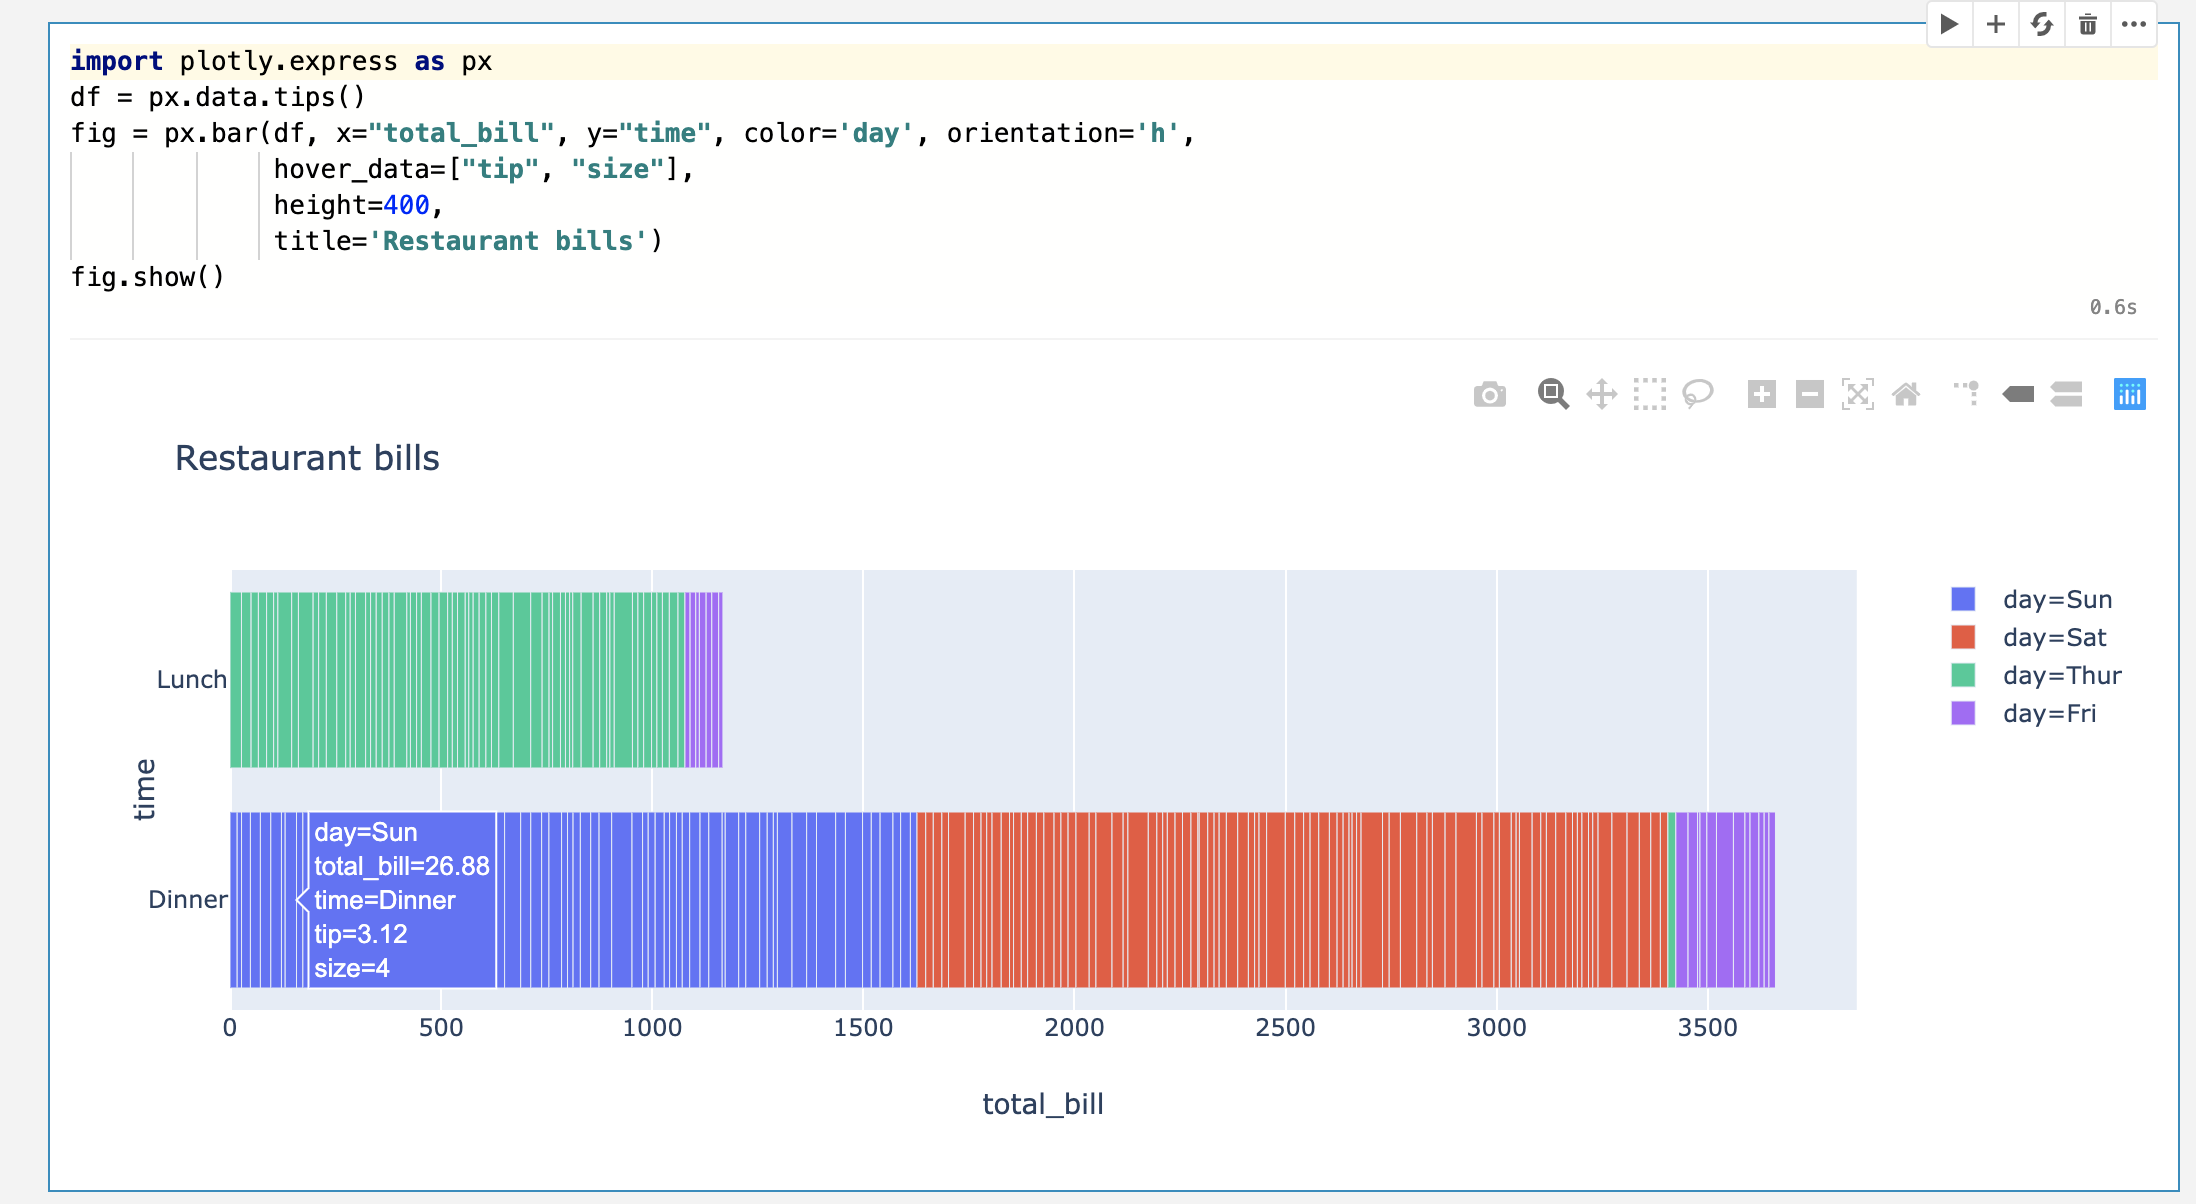
Datalore now supports Plotly, a widely used Python library for plots. You can now use it in Datalore and see the embedded outputs in a notebook.
Looking forward to your feedback
For those of you who have read up to this point, here is a little piece of insider information 🤫. The Datalore team is gathering this week in Saint Petersburg to plan the direction of our further development. This means your feedback is more important than ever! Please share what you think about the current update and about the product in general!
If you run into any issues with this update, please don’t hesitate to report them here or in our feedback channel.
Subscribe to Datalore News and Updates

