.NET Tools
Essential productivity kit for .NET and game developers
How-To's
dotCover 1.1, dotTrace 4.5 Performance Early Access
dotTrace 4.5 Performance and dotCover 1.1 have recently gone EAP: you can download fresh dotTrace and dotCover builds from their Early Access Program pages.
Why would you do that? Let’s see what’s new in the dotTool kingdom.
What’s new in dotCover 1.1 EAP
- Improved presentation of class members in the coverage results tree. When you browse coverage results with dotCover 1.1, you can clearly see properties with getters and setters, or events with add and remove accessors. Anonymous delegates and lambdas are now represented by a node within their containing method denoting types that they receive and return.

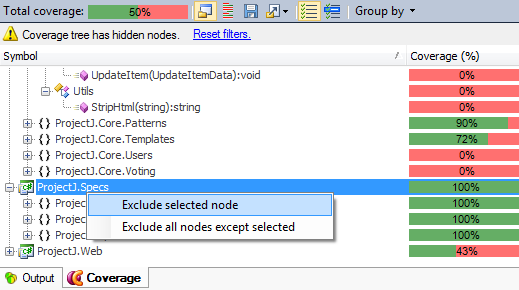
- Filtering coverage tree on-the-fly with recalculation of statistics. You can now exclude a specific node, or all nodes except this node, from the coverage tree and have dotCover instantly recalculate percentages of covered and uncovered code:

- Per-solution settings for coverage. Starting from dotCover 1.1, coverage filters are stored per-solution in projectName.dotCover files. In case you’re covering a compiled application, i.e. you’re not working with a solution per se, global settings are used.
- HTML/JSON report generator. This will be available both in console runner and in Visual Studio coverage UI.

- Two predefined color schemes for coverage highlighting. Some like it dark, some like it bright, so we figured, why not provide two options by default? Of course, you can always fine-tune colors for coverage highlighting by tweaking dotCover display items in Tools | Options | Environment | Fonts and Colors.

- On-demand license checking. dotCover doesn’t check for your license until you actually start using the product. This is also implemented in dotTrace 4.5 Performance (see below.)
In addition, before dotCover 1.1 is released, we’re expecting to add another feature, namely incremental update for coverage information after a part of tests is rerun. As soon as it is implemented, adding new unit tests won’t require creating an entire new coverage snapshot.
What’s new in dotTrace 4.5 Performance EAP
- Less noise in call stacks and improved tree representation. Tree content is now better organized because icons to the left of the tree do not misalign it anymore. In addition, you can now quickly fold or unfold “0.00%” calls that take insignificant time with Ctrl+Space:

- Putting all public methods of specific class in single tab. You can now quickly extract all public method calls in a certain class to a separate tab:

- Improved estimation of potential performance gains. You can now adjust time of a function called from a specific parent function, leaving its other calls intact:

- Source preview for .NET Framework assemblies. This is something inspired by ReSharper 6 EAP and its new decompiling functionality:

- Display of IL code in source view:

- Performance improvements. dotTrace 4.5 Performance generates Hot Spots and Plain List views a lot faster than version 4.0. Acceleration has also been applied to search in Hot Spots view and canceling view construction on pressing Esc. As to applications being profiled, they should now run faster and consume less memory under profiling.
- New floating license handling policy. This change affects licensing behavior of dotTrace plug-in for Visual Studio and doesn’t affect dotTrace running as a standalone application. Before, a floating license ticket was given upon loading the dotTrace plug-in in Visual Studio irrelevant of whether a user actually needed it. As a result, the License Server was time and again running out of available tickets before someone who really needed to use dotTrace was able to get his/her hands on it. Starting from dotTrace 4.5 Performance, a ticket is only requested after a user has performed an operation with dotTrace from within Visual Studio.
- Welcome Page cosmetics. dotTrace Performance Welcome page can now differentiate between applications with similar names, and the Recent Snapshots area highlights snapshots that have been deleted, renamed and moved:

Download dotTrace and dotCover EAP builds.


