.NET Tools
Essential productivity kit for .NET and game developers
dotCover 1.1, dotTrace 4.5 Performance Beta Releases
We are pleased to announce the immediate availability of dotCover 1.1 Beta and dotTrace 4.5 Performance Beta. Having opened Early Access Programs for both products just over a month ago, and based on the feedback received, we are now ready to push out the Beta’s for the products.
What’s new in dotCover 1.1 Beta
We have described many of the features in detail in the post on dotCover 1.1 and dotTrace 4.5 Performance EAP. Summary of these are:
- Improved presentation of class members in the coverage results tree
- Filtering coverage tree on-the-fly with recalculation of statistics
- Per-solution settings for coverage
- HTML/JSON report generator
- Two predefined color schemes for coverage highlighting
- On-demand license checking
In addition, this latest Beta release includes:
- Incremental update of coverage info when part of tests are rerun. Coverage information is calculating incrementally without requiring a full profiling on new runs, making the whole process much faster.
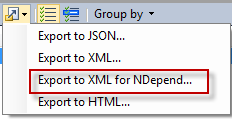
- NDepend integration. We now provide support for NDepend, allowing the possibility of exporting coverage reports in XML format suitable for NDepend:

- Integration with TeamCity Visual Studio plug-in for obtaining remote snapshots. You can now use TeamCity’s VS plug-in to connect to a TeamCity server and obtain snapshot information from a Continuous Integration coverage analysis run:

What’s new in dotTrace 4.5 Performance Beta
Once again, most dotTrace 4.5 Performance features are already described in the EAP announcement post. Here’s a summary of these:
- Less noise in call stacks and improved tree representation
- Putting all public methods of specific class in single tab
- Improved estimation of potential performance gains
- Source preview for .NET Framework assemblies
- Display of IL code in source view
- Performance improvements
- New floating license handling policy
- Welcome Page cosmetics
New addition in dotTrace 4.5 Performance Beta is that the Sampling is now the default profiling mode.
We have of course also focused on fixing issues that were reported during the EAP and earlier versions of the product.
You’re welcome to give the beta releases a try: download them from dotTrace web site and dotCover web site.
If you happen to see any bugs or glitches, please report them to dotTrace bug tracker and dotCover bug tracker.


