.NET Tools
Essential productivity kit for .NET and game developers
Profile .NET Apps Without Restarting: Monitoring Comes to ReSharper

Tracking down performance bottlenecks in Visual Studio often means interrupting your workflow, restarting your application in profiling mode, and hoping you can reliably reproduce the exact issue. We think there’s a better way.
If you have already used Monitoring in Rider, this experience will feel familiar. Now, the same Monitoring experience is available in ReSharper, bringing real-time performance insights directly inside Visual Studio.
Curious about what else is included in this update? Head over to the What’s New in ReSharper page to explore all the other improvements that have landed in the latest release.
What is Monitoring?
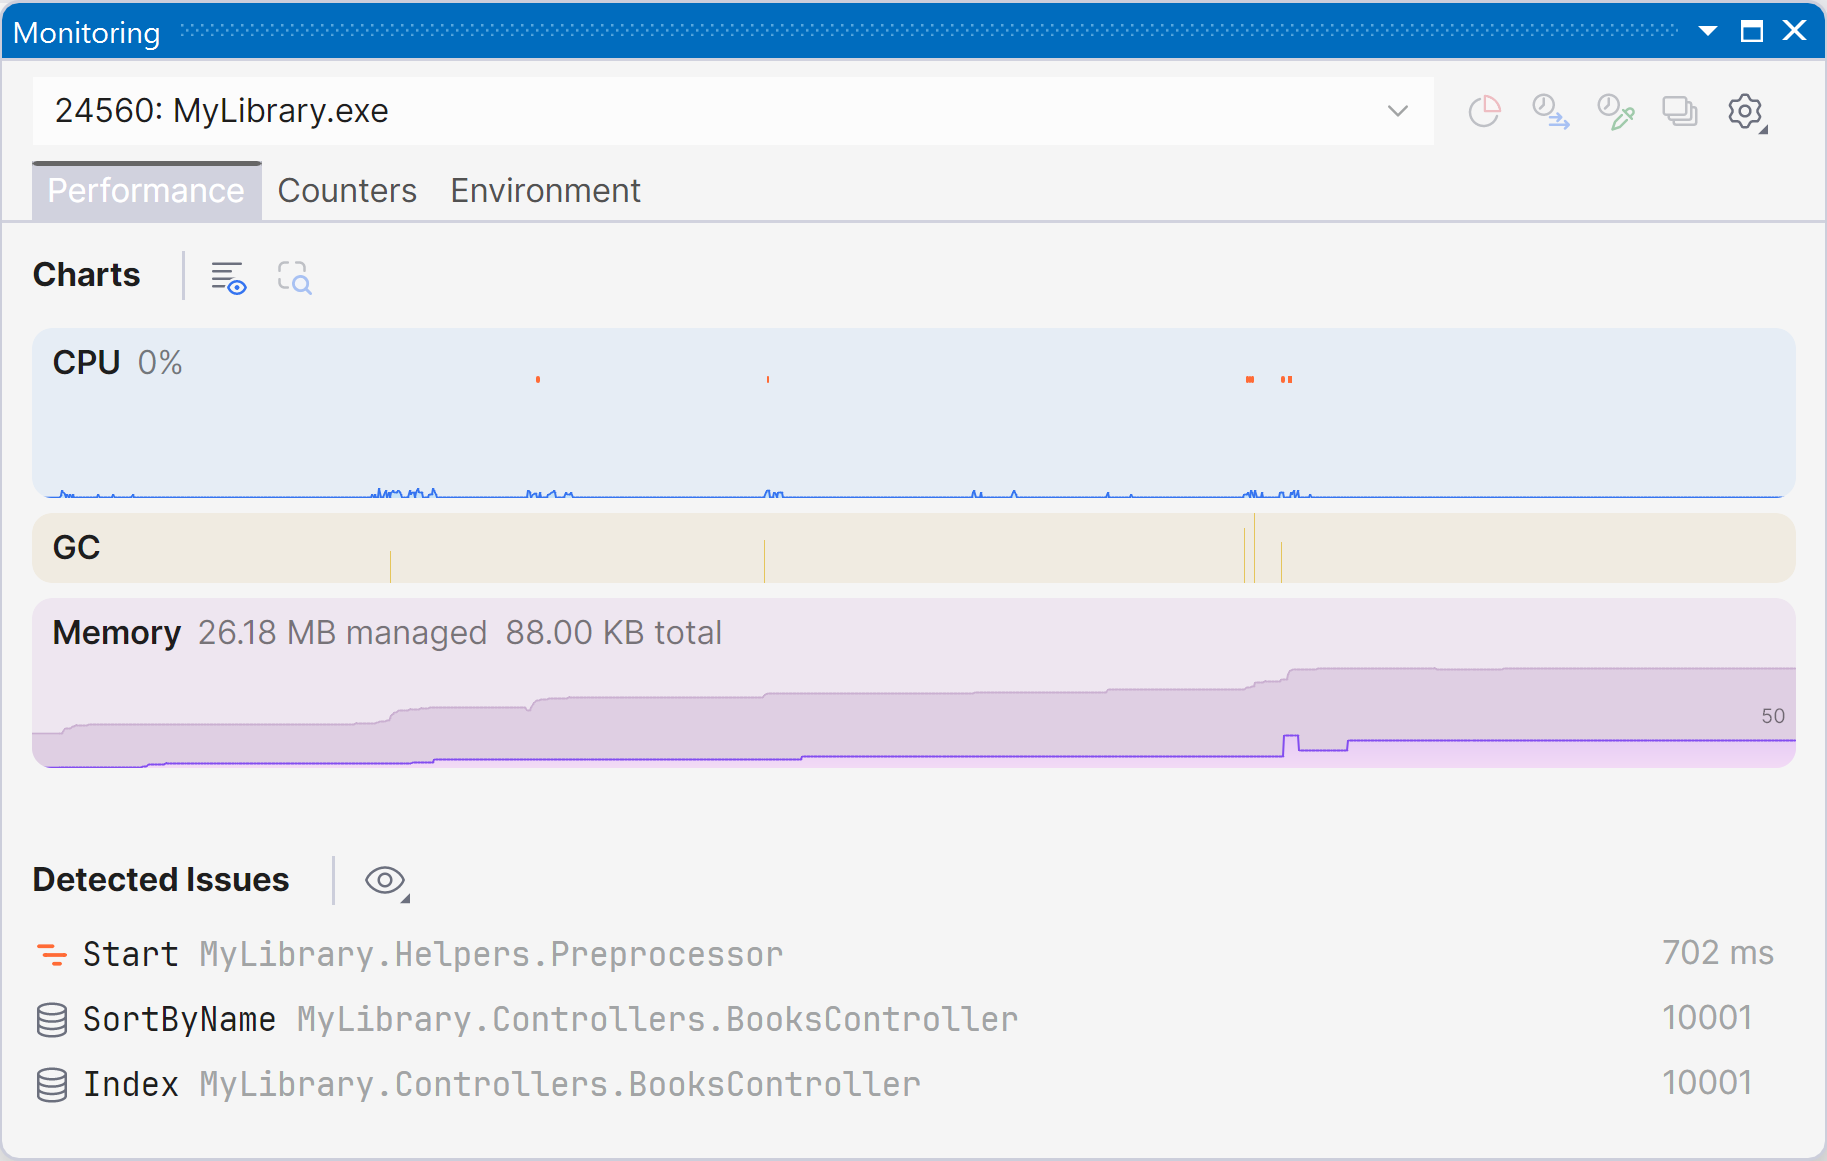
When you run or debug your app, ReSharper automatically opens the Monitoring tool window and shows you what’s happening in real time: CPU and memory usage, GC activity, counters, metrics, and so on.
The best part: profiling without restart
> Important: This feature requires a dotUltimate license.
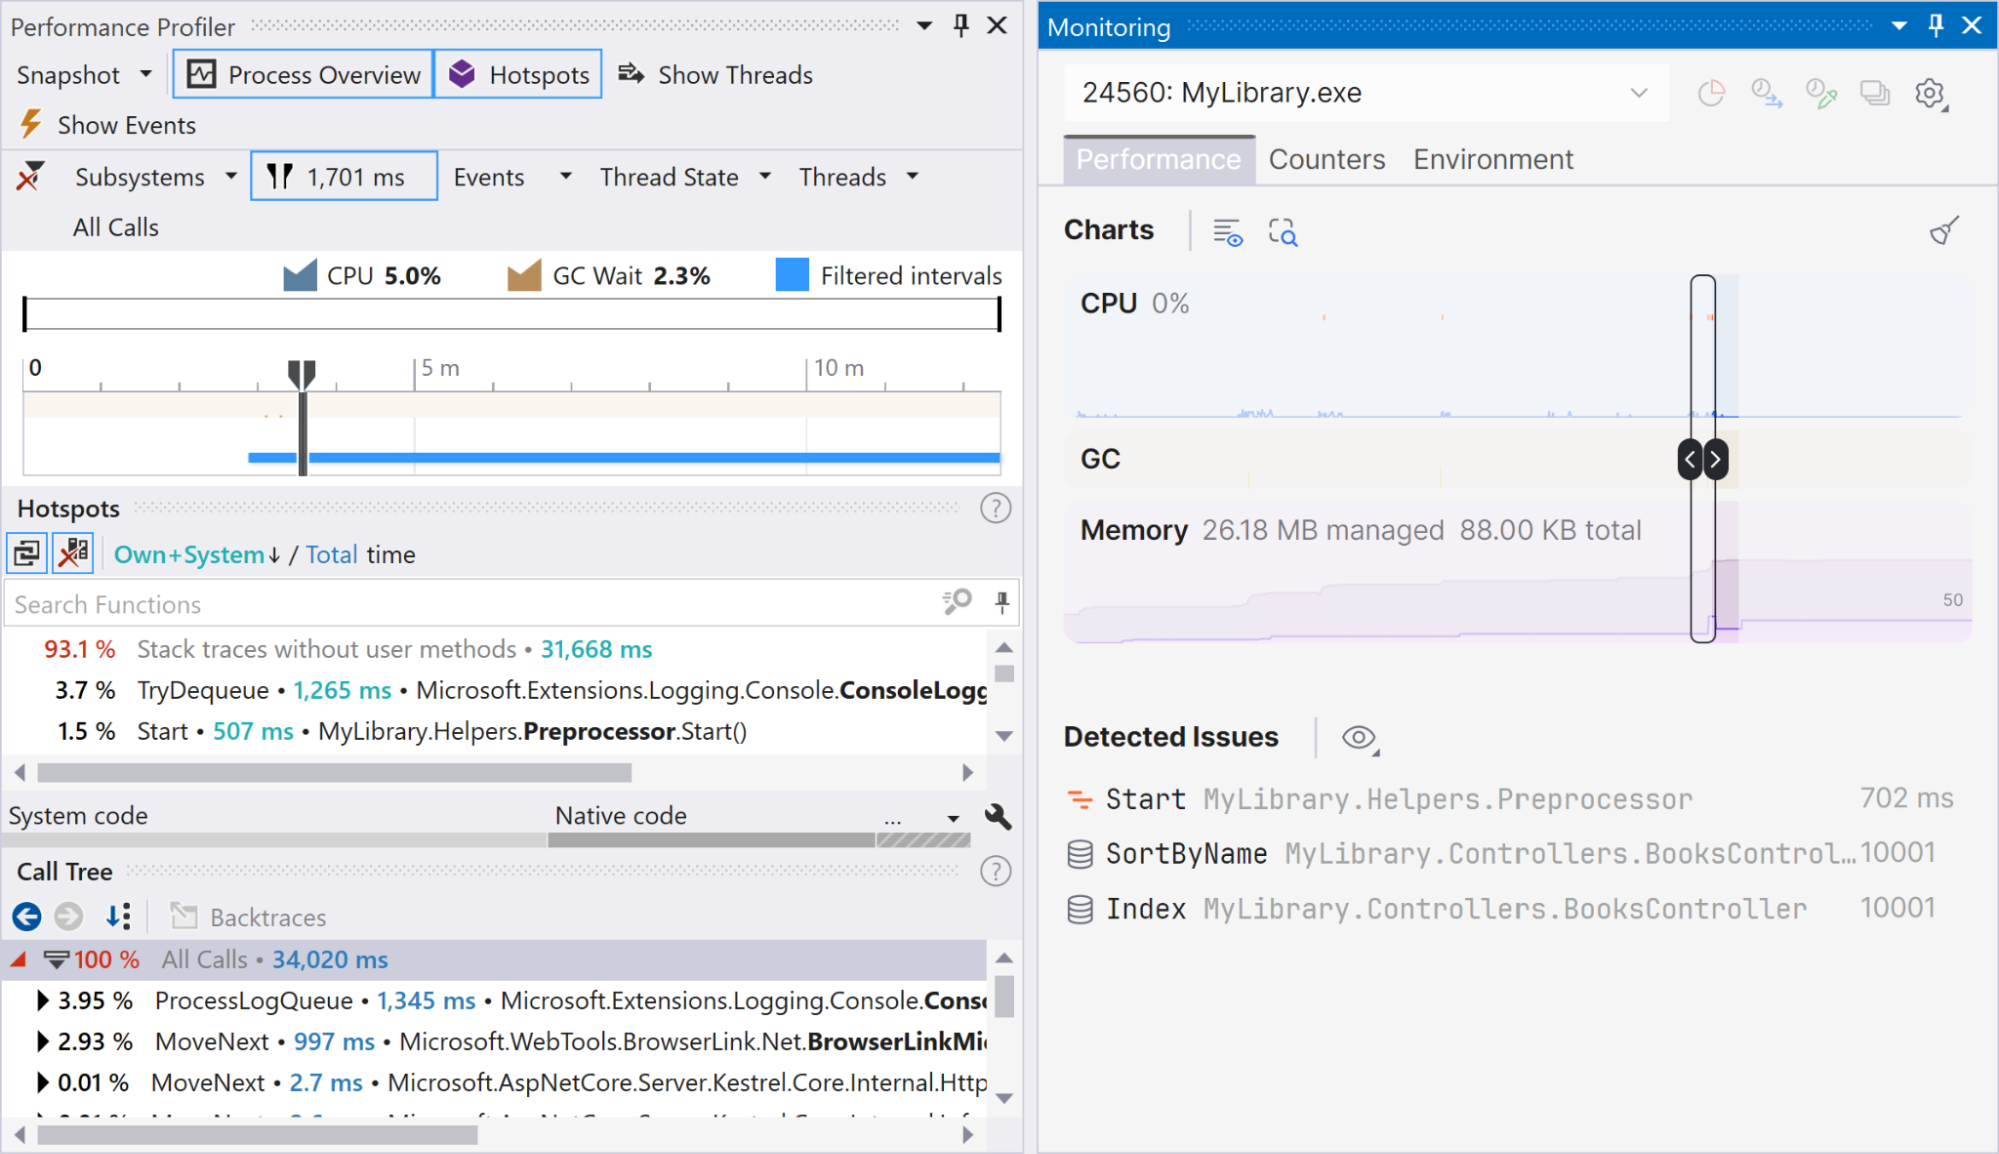
The most powerful part of Monitoring is what happens after you notice a problem.
Monitoring does some profiling work in the background, so you can select a time range directly on the chart and open it in the built-in profiler. That means you do not need to stop the application, restart it in profiling mode, and try to reproduce the problem. You can go straight from “I see a spike here” to “show me the Call Tree for that exact interval”. In other words, you can open the selected range in the built-in profiler and inspect the collected data in detail: the call tree, call time, and related runtime events.
Automatic issue detection
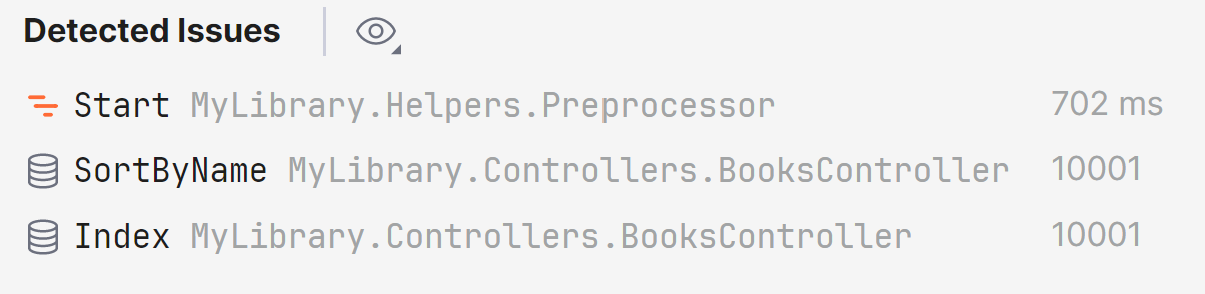
Monitoring is not limited to charts. It can also automatically detect issues and list them below the timeline. Currently supported issue types include:
- Performance hotspot
- ASP.NET Core issues
- Slow MVC action
- Slow Razor page handler
- Slow Razor view component
- Database issues
- Slow DB command
- Excessive DB commands
- Large DB result set
- Excessive DB connections
These issues appear as the app runs, so you can catch bottlenecks while they occur rather than waiting until after a profiling session or checking logs.
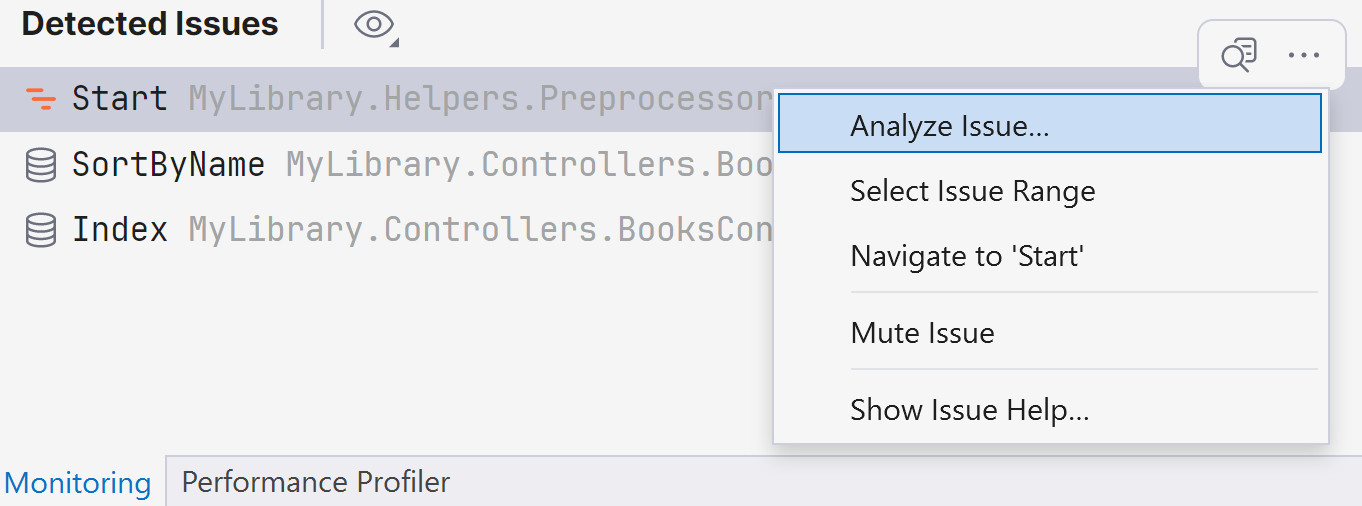
Analyze issues in place
> Important: This feature requires a dotUltimate license.
The issue list is not just a report. It is also a starting point for investigation.
When Monitoring detects a problem, you can select that issue and analyze the corresponding time range in the built-in profiler. That gives you the same advantage as manual interval selection, but now the interesting intervals are found for you automatically.

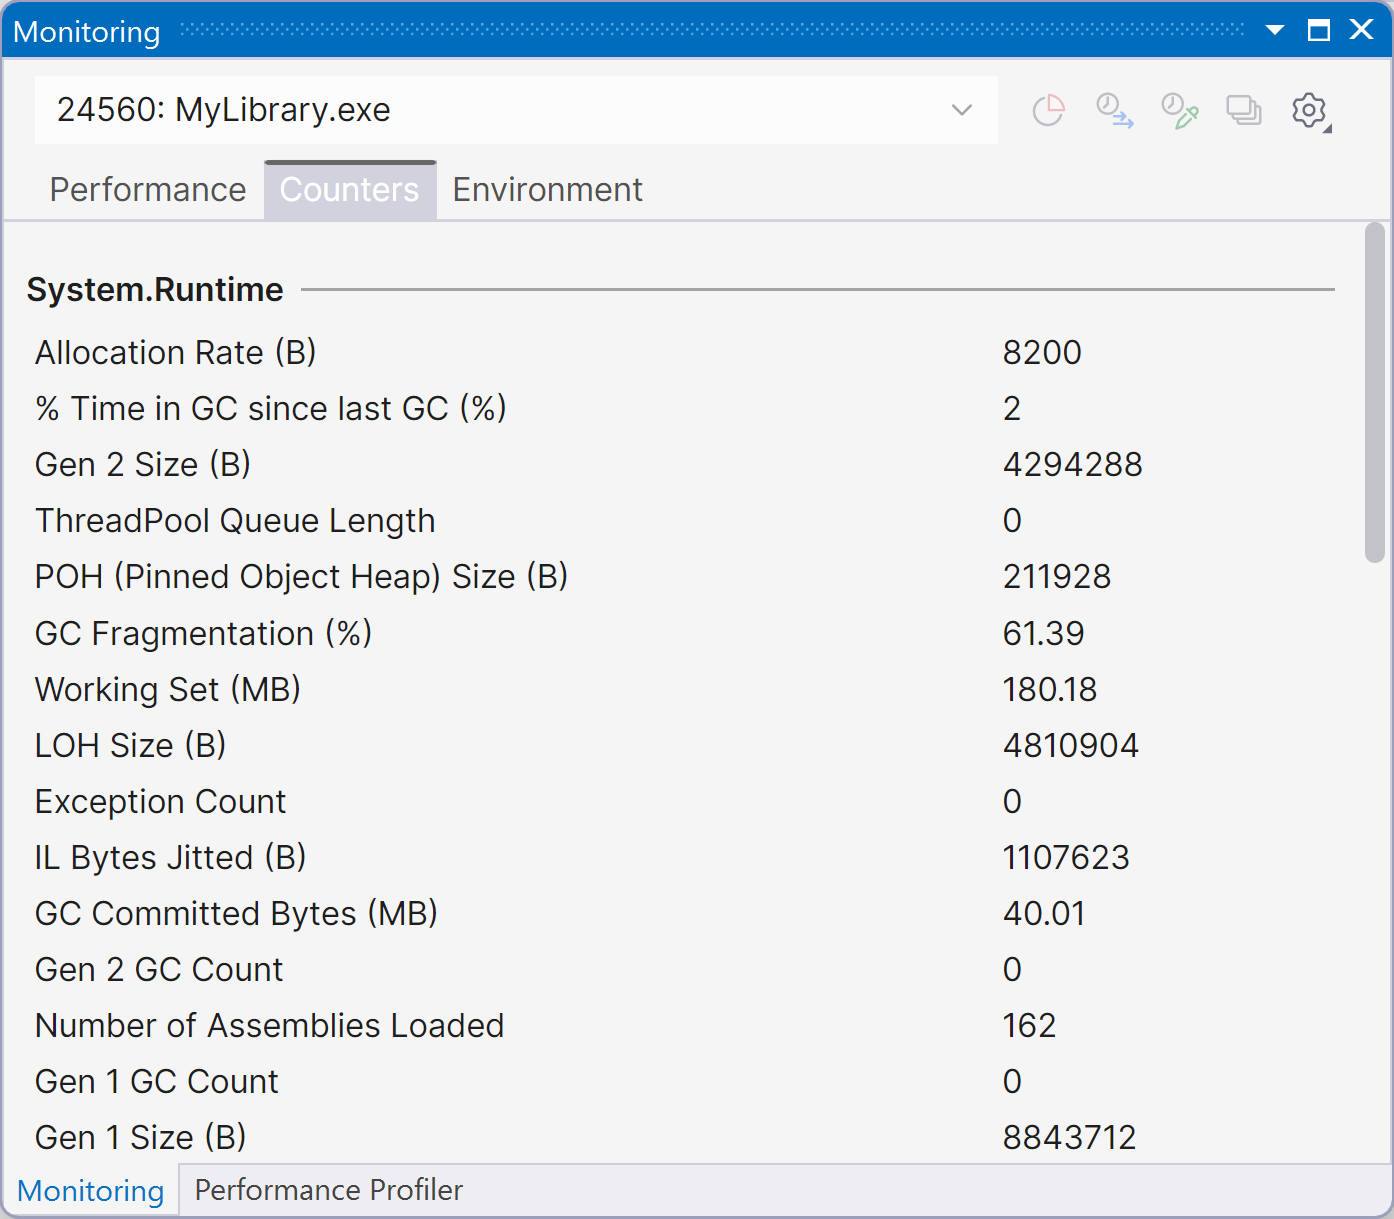
Counters, metrics, and environment data
You can also use Monitoring as a live runtime dashboard. It includes tabs for counters, metrics, and environment data. This is especially handy when you want a single place to monitor both low-level runtime behavior and higher-level application signals during local development.
How to enable Monitoring in ReSharper
Monitoring is designed to be available by default. It starts automatically when you run or debug your project. If you want, you can change that behavior and keep Monitoring enabled only for debug sessions or turn it off completely.
A simpler path from symptom to root cause
What makes Monitoring valuable is not any single chart or issue detector on its own. It is the workflow:
- You run the app.
- You notice a spike, slowdown, or detected issue.
- You select the interesting interval.
- You open it in the built-in profiler.
- You inspect the call tree and find the cause.
We are happy to bring Monitoring to ReSharper and make this runtime investigation workflow available in Visual Studio, as well.
Give it a try in the 2026.1 release, and as always, we would love to hear what works well, what is missing, and what you would like us to improve next.