Debugging with GoLand – Essentials
Updated and validated on January 17, 2022. You can find more tutorials on how to debug Go programs here. You may also refer to the Debugging section of our Help documentation.
- Debugging with GoLand – Getting Started
- Debugging with GoLand – Essentials (this post)
- Debugging with GoLand – Advanced Debugging features
- Debugging with GoLand – Windows minidumps
In today’s post, we will continue exploring the debugger functionality in GoLand. If you want to know how to configure the debugger, please see our previous post which contains all the information on how to configure the IDE to work in various scenarios.
We will talk about:
- Controlling the execution flow
- Evaluating expressions
- Watching custom values
- Changing variable values
- Working with breakpoints
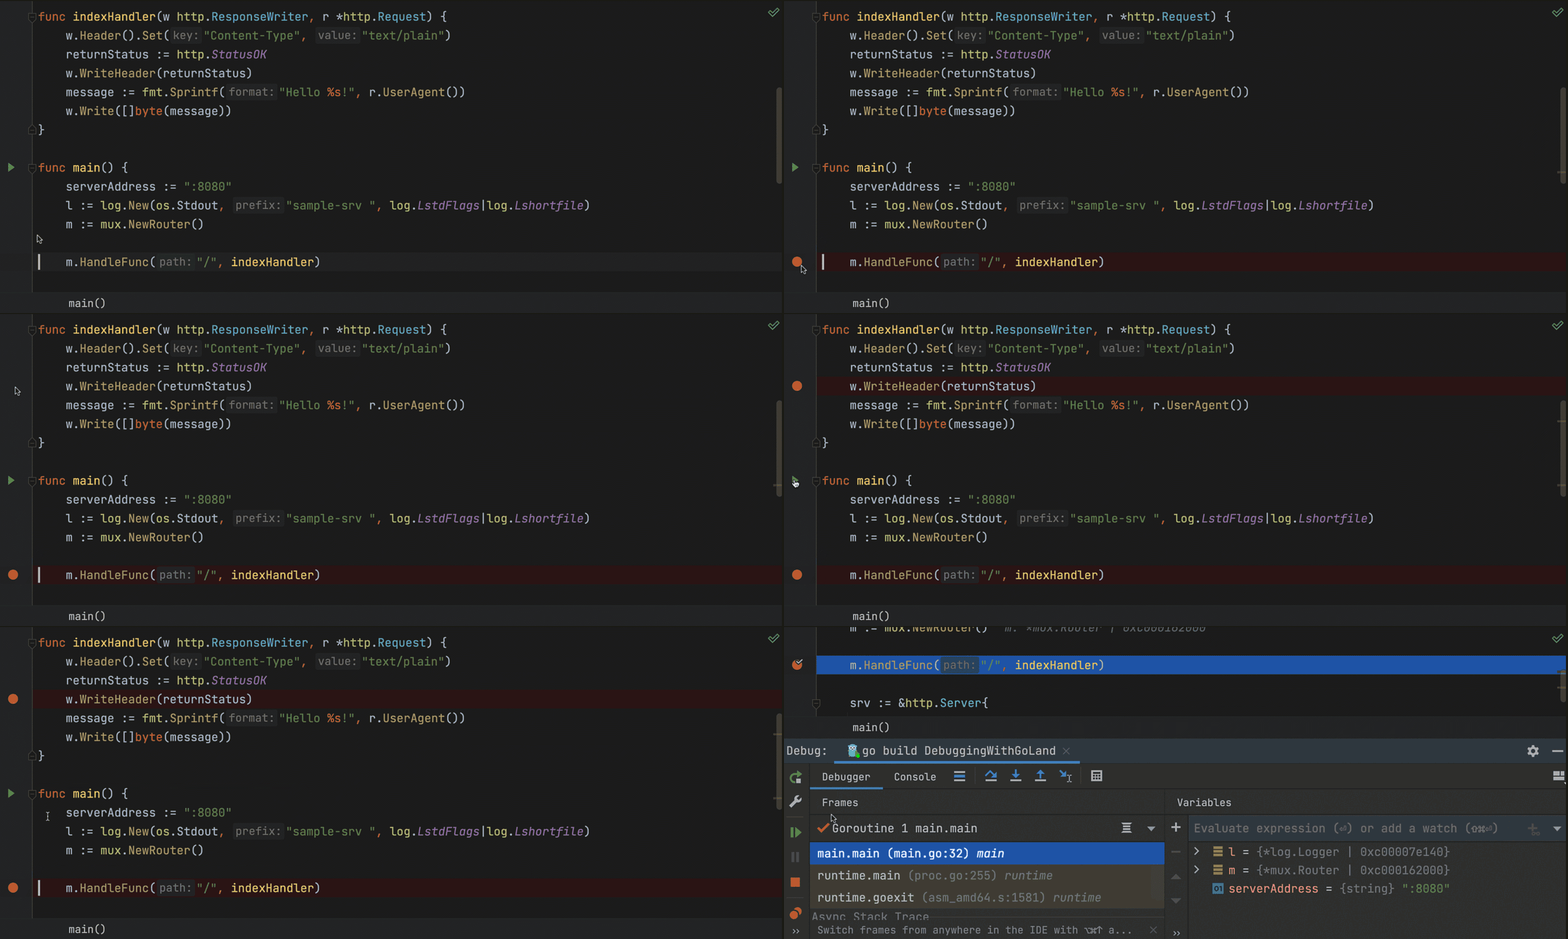
Before we launch our debugging session, let’s put in a few breakpoints for places where we are interested in knowing about how the code the runs, and then launch a debugging session (you can find the code in this repository).

Controlling the execution flow
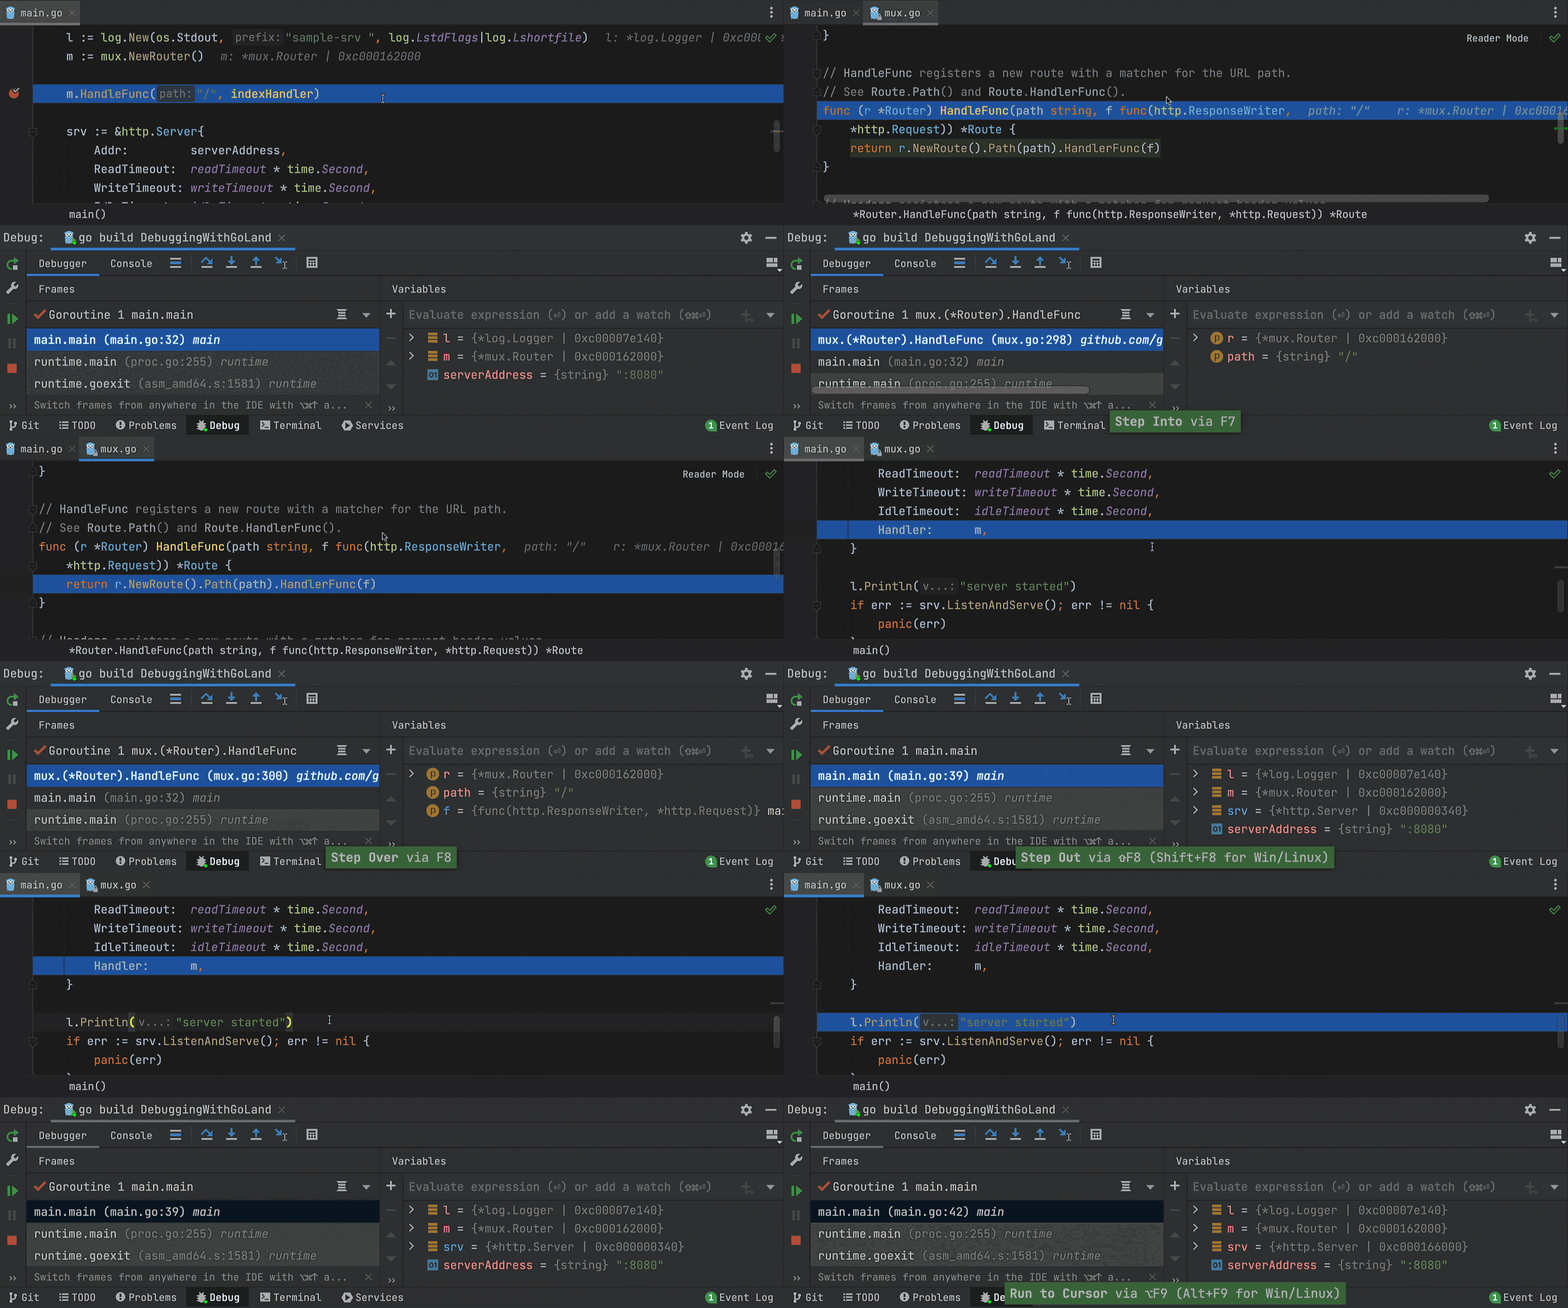
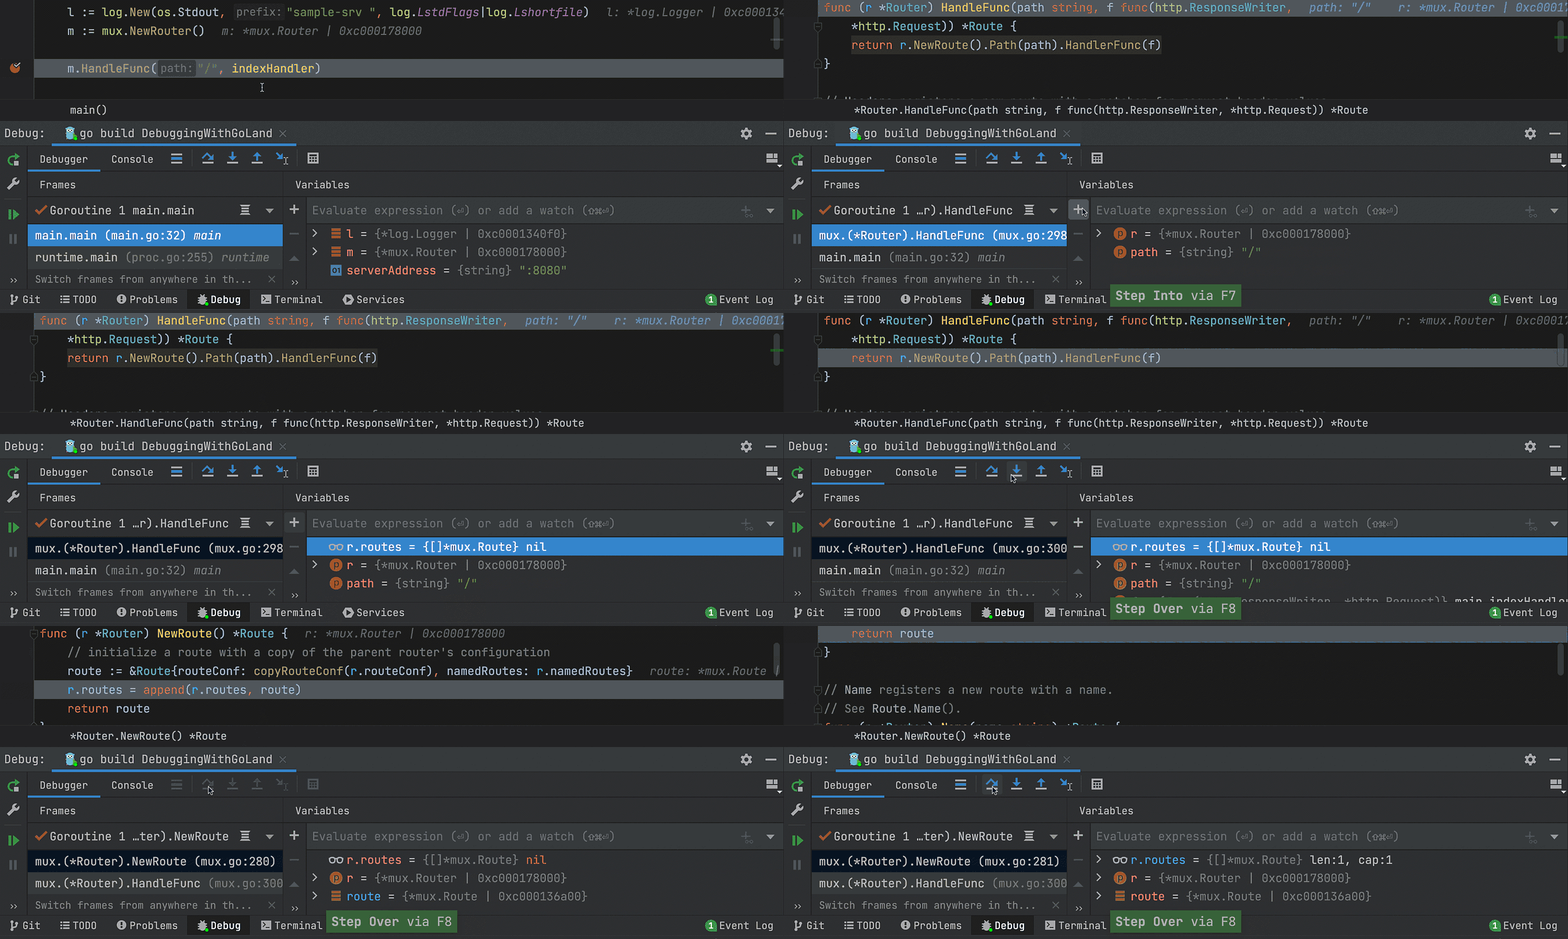
We have complete control over the debugger from here. We can step into (F7), smart step into (Shift + F7/⇧ F7), step over (F8), step out (Shift + F8/⇧ F8), or run the code up to the cursor (Alt + F9/⌥ F9).

Evaluating expressions
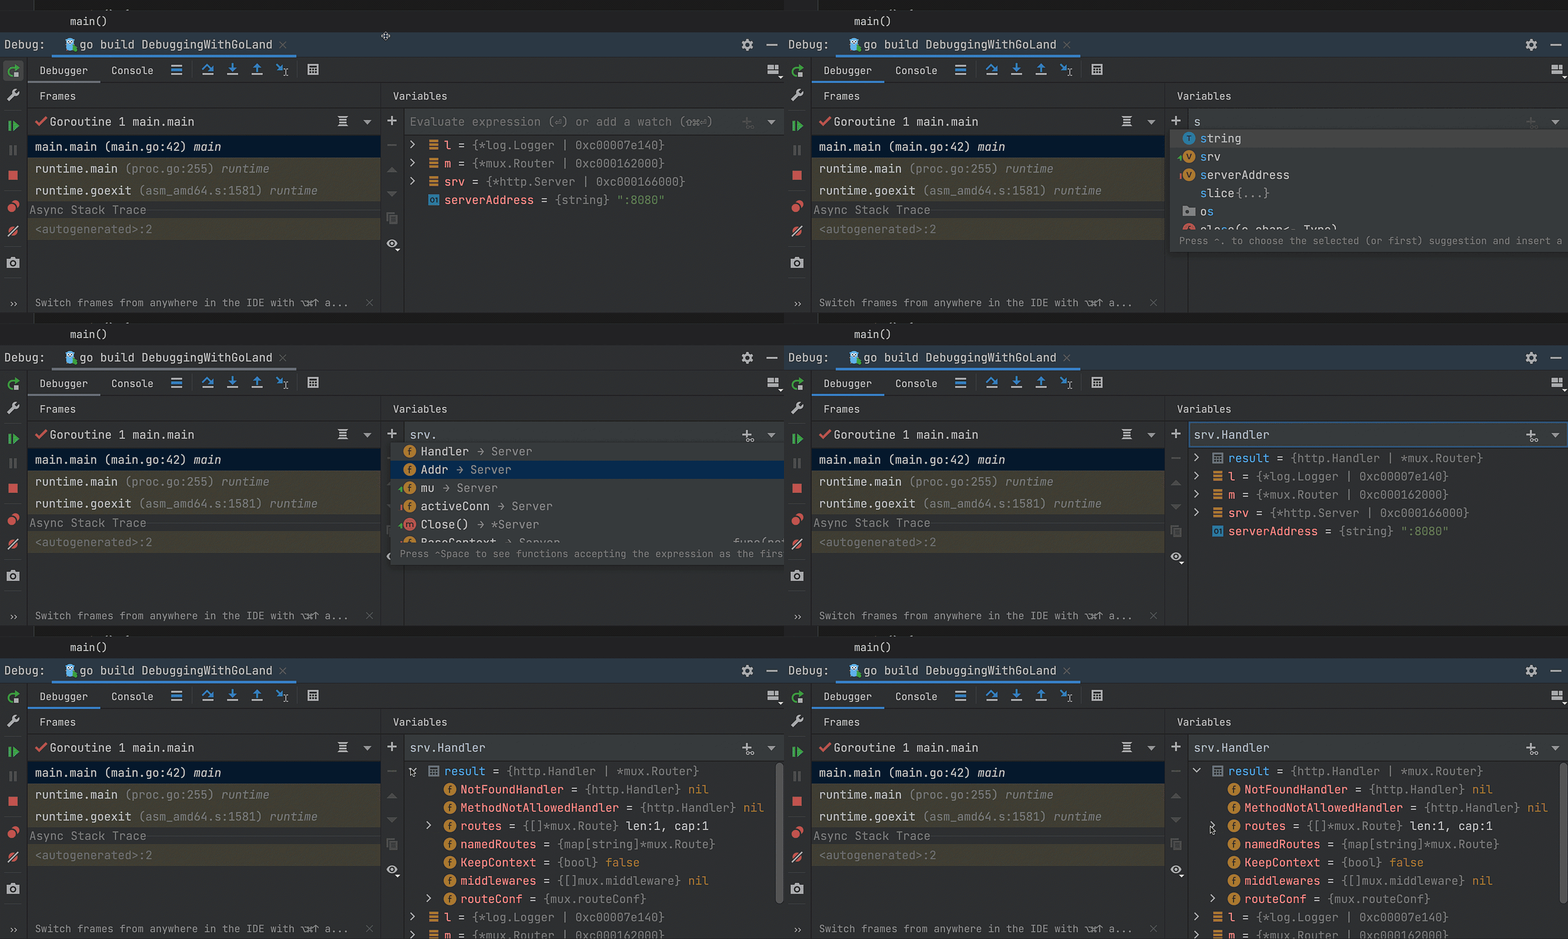
We can also evaluate simple expressions and functions.

Watching custom values
We can also create a new watch to let us monitor custom expressions. This is useful when we want to watch a more complex expression or see only a certain value from a slice/map/struct.

Changing variable values
Changing values can be done currently only for non-string basic types such as int, float, or boolean values types due to limitations in the Go Runtime.
To do this, select which value you want to change from the variables view, then press F2 and start typing the value. When you are happy with it, press Enter and your code will now use a different value.

Working with breakpoints
Setting up a breakpoint is a fairly straightforward operation. Click on the left side of the line you want the execution to stop, or use the shortcut Ctrl+F8/⌘ F8, and the debugger will stop the execution for you.
If you don’t need anything more, then that’s about all you need to really know. However, GoLand comes with a few nice options for how you and the debugger can interact with a breakpoint.
Press Ctrl+Shift+F8/⌘ ⇧ F8 once and you’ll get a screen with a few options.
Press Ctrl+Shift+F8/⌘ ⇧ F8 a second time and the list of breakpoints will be shown with a full list of all the options available.

From here you can enable or disable breakpoints, and use the debugger to suspend the execution of the debugged process during the debugging session or have the breakpoint trigger only if a certain condition is met.

We can also choose to have the IDE log that a certain breakpoint was reached, or print the Stack trace in the Console so that we can have a look at it in text mode.
Another powerful feature we can use from here is Evaluate and log which allows the IDE to evaluate an expression and print it in the Console.
If you want to place a temporary breakpoint, you can enable the Remove once hit option and the breakpoint will be removed automatically by the IDE. Or you can have the breakpoint enabled only if a previous breakpoint is reached, making it useful for debugging complex conditional code.

In this blog post, we looked at debugging applications and tests using the IDE. This will help us gain insight into an application quicker and become more efficient at finding and fixing bugs.
As always, let us know if you have any feedback in the comments section below, on Twitter, or on our issue tracker.
Subscribe to GoLang Blog updates


