Debugging with GoLand – Advanced Debugging features
Updated and validated on January 17, 2022. You can find more tutorials on how to debug Go programs here. You may also refer to the Debugging section of our Help documentation.
- Debugging with GoLand – Getting Started
- Debugging with GoLand – Essentials
- Debugging with GoLand – Advanced Debugging features (this post)
- Debugging with GoLand – Windows minidumps
In today’s article, we will talk about two advanced debugging features of GoLand: Core Dump debugging and using Mozilla rr, a reversible debugger (you can find the code in this repository).
Debugging core dumps
Core dumps are memory snapshots of running applications taken at a certain point in time. They can help us visualize all the goroutines present, with all the values for the variables, as well as the current execution point for each active goroutine.
Right now, GoLand supports only Core Dumps taken on Linux systems, but it can read and analyze them on any operating system.
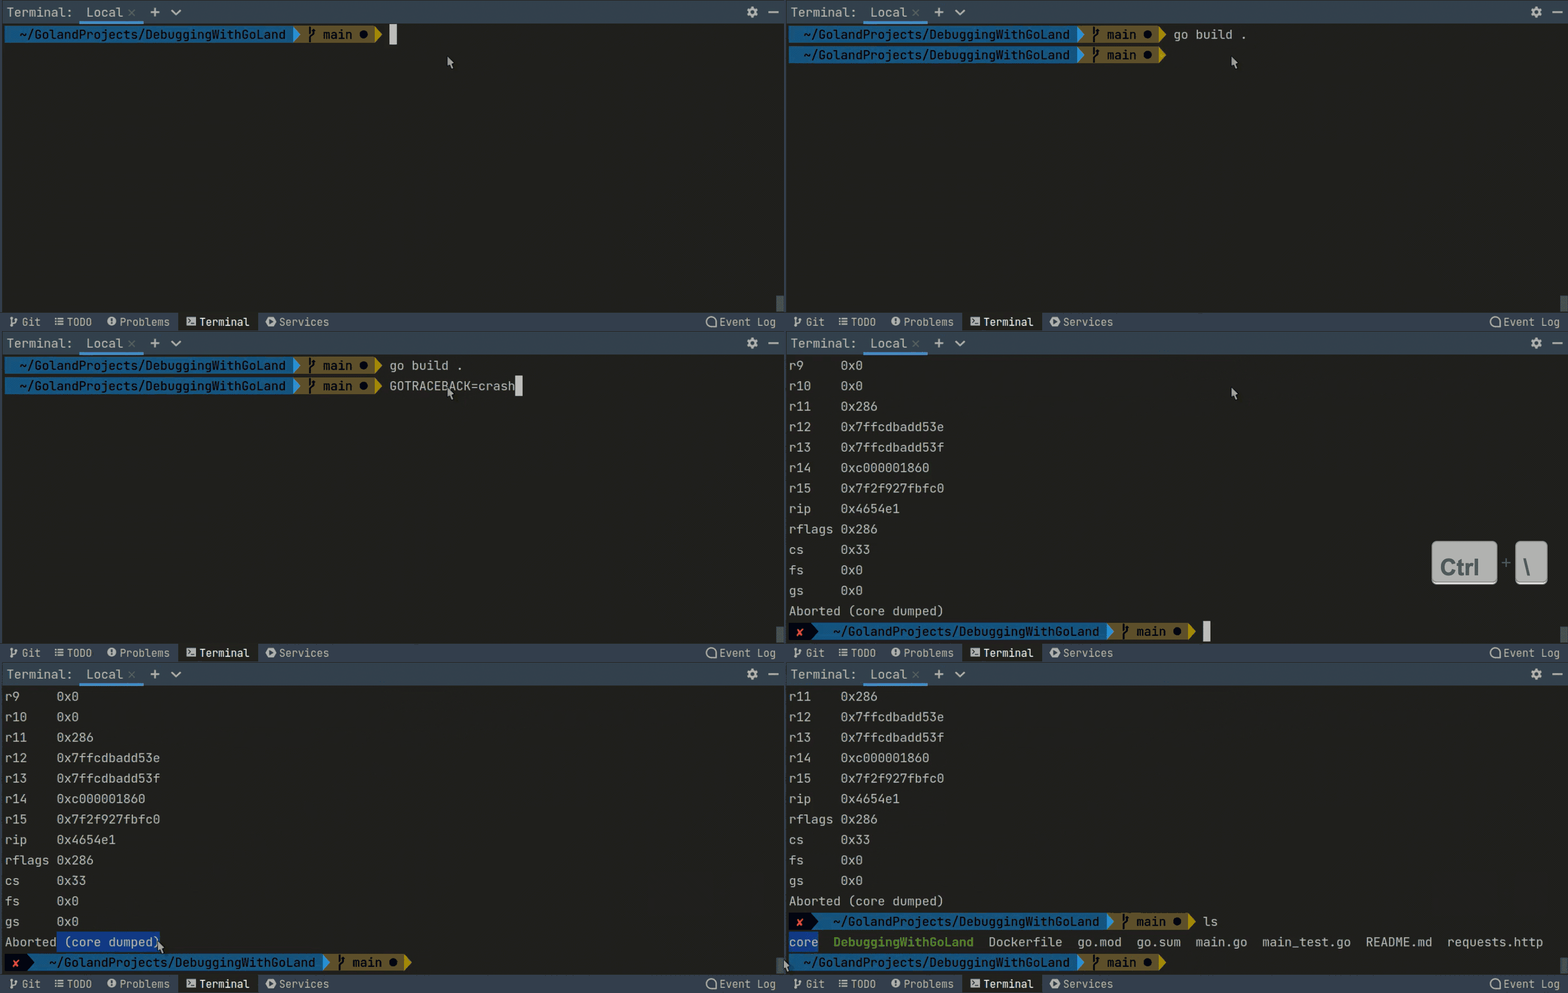
There are two ways to obtain a core dump. If we want to see the in-memory values as the process terminates because of a crash, we need to set the ulimit to be reasonably high, e.g., sudo ulimit -c unlimited, and have the following environment variable configured GOTRACEBACK=crash. This will enable Go applications to crash with a stacktrace printed and with a core dump file written.
You might also want to check the output of the cat /proc/sys/kernel/core_pattern command. The contents of the core_pattern file determine where the core file will be written and how it will be named.
If the output is not “core”, then your core dumps will not be written in the current working directory. To set the /proc/sys/kernel/core_pattern file to “core”, run this command in your terminal:
sudo sysctl -w kernel.core_pattern=core
To summarize, in order to successfully generate a core dump when a program crashes, you need to have the following output:

Build your program, run it with GOTRACEBACK=crash, and interrupt it with Ctrl + . The core file should appear in your current working directory.
Get core dumps with gcore
To be able to get core dumps from a running process without having to crash it, we need to have gdb installed on the system and run these commands:
sudo ulimit -c unlimited
echo 0 | sudo tee -a /proc/sys/kernel/yama/ptrace_scope
Note that this value will be reset on system restart and you’ll need to configure it again.
To generate and use the core dump, we need to configure the IDE to save the binary in a known location, such as our project root directory.
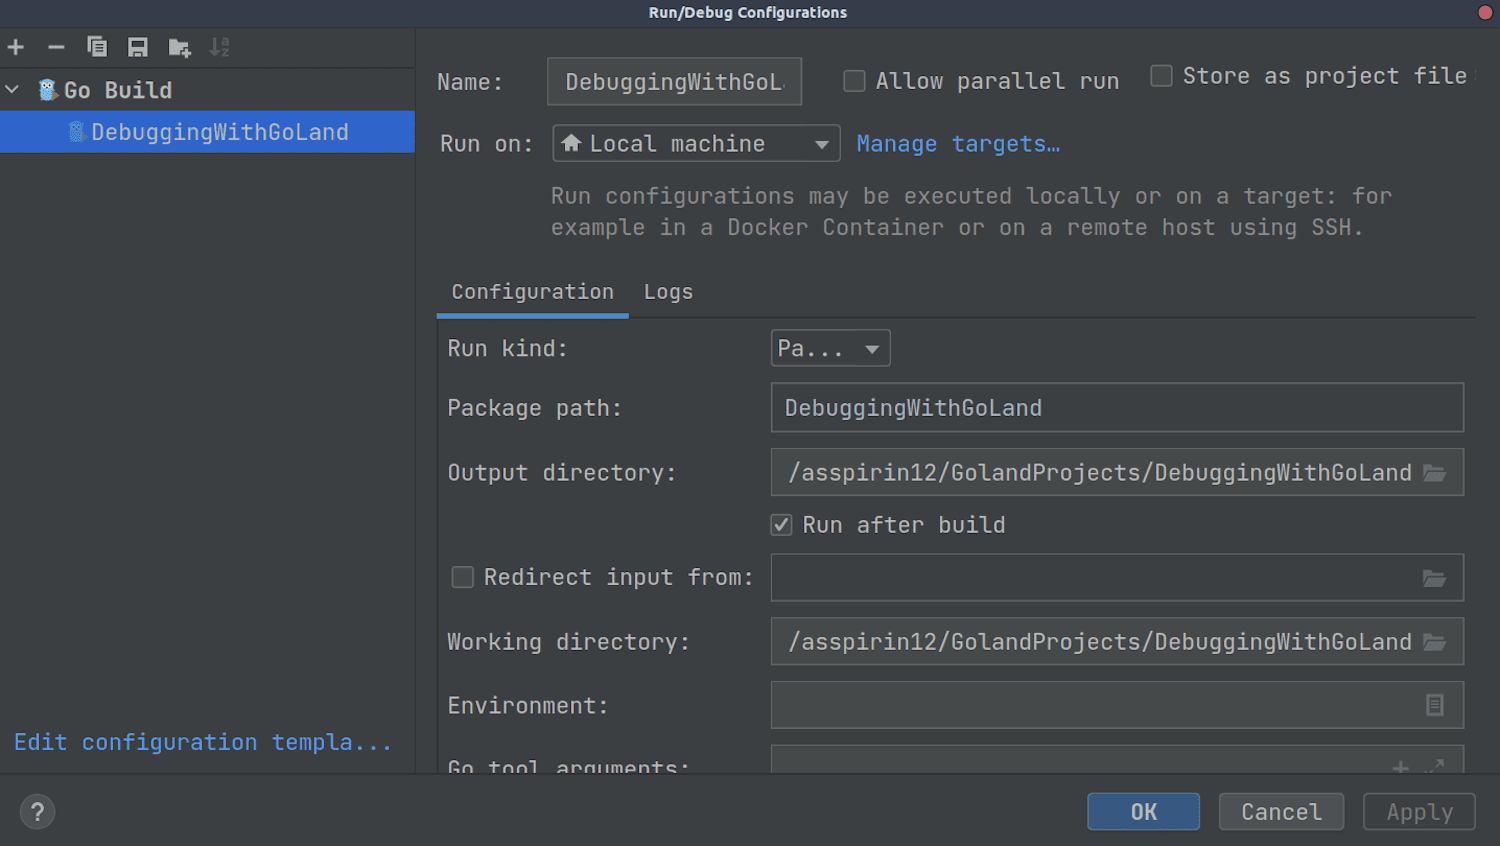
After that, we can start the application as usual, and start sending requests to it. Next, after we determine the process id of the application, we can invoke gcore <pid> and get the dump file.
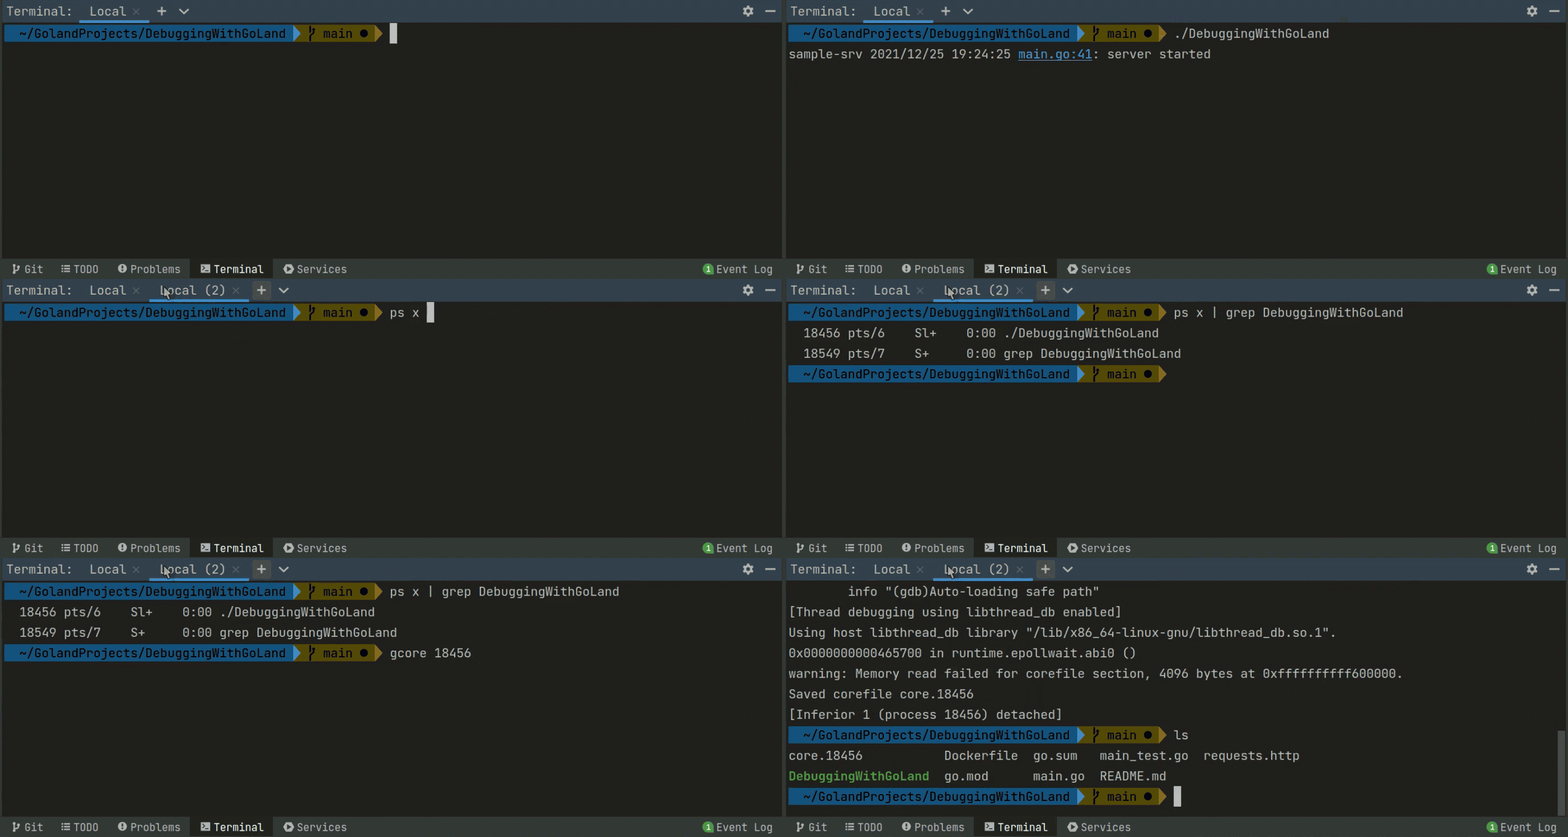
To investigate the core dump in the IDE, we can either use the binary and core dump generated from the remote server or the binary and core dump produced by running the above commands. Then go to Run | Open Core Dump… and select both the executable and the core dump file. This will open the debugger interface and let you see the list of running goroutines, threads, the values for all variables. You can use the Evaluate feature to understand what the application is currently doing.
Using core dumps helps you determine where goroutines are stuck, how many of them there are, and which values they have in memory while the issue happens.
Mozilla rr reversible debugger
However, using core dumps is a static process. Sometimes a bug is difficult to replicate, and it takes many debugging sessions to reproduce it, and then many more to see if it’s fixed.
Enter reversible debuggers. These debuggers allow us not only to step forward in execution but also to go back and effectively undo all the operations between steps.
Delve, the Go debugger used by GoLand has support for such functionality by using Mozilla’s rr project. From the description of the rr project, its mission is to allow the “replay the failing execution repeatedly under a debugger until it has been completely understood.”
Another benefit of using rr is that it has a low overhead of execution during the recording part of the session. This means it can be used on production systems or production-like canary systems to catch bugs that cannot be otherwise replicated, and then to investigate them in the comfort of a development environment.
Let’s see this in action.
Before we start, there are some strict limitations of where rr can run which should be known ahead of time. It can only run on Linux with some restrictions regarding the hardware/virtual machine capabilities. These affect the usefulness of this debugging solution. However, once an environment meets the requirements, it will become one of the most powerful solutions available.
After installing rr, we need to run a couple of commands so that rr can perform the recording part:
echo -1 | sudo tee -a /proc/sys/kernel/perf_event_paranoid
echo 0 | sudo tee -a /proc/sys/kernel/kptr_restrict
These settings are not permanent and need to be applied again if the machine is restarted.
Click the green arrow next to the main function, and select Record and Debug… This will launch the required compile step and then the debugger using the rr backend.
For applications that are designed to run continuously, such as the web server in the example code, we need to stop the debugger and then select Run | Debug Saved Trace… By default, the latest rr session will be selected so we can click the OK button to start the debugging session.
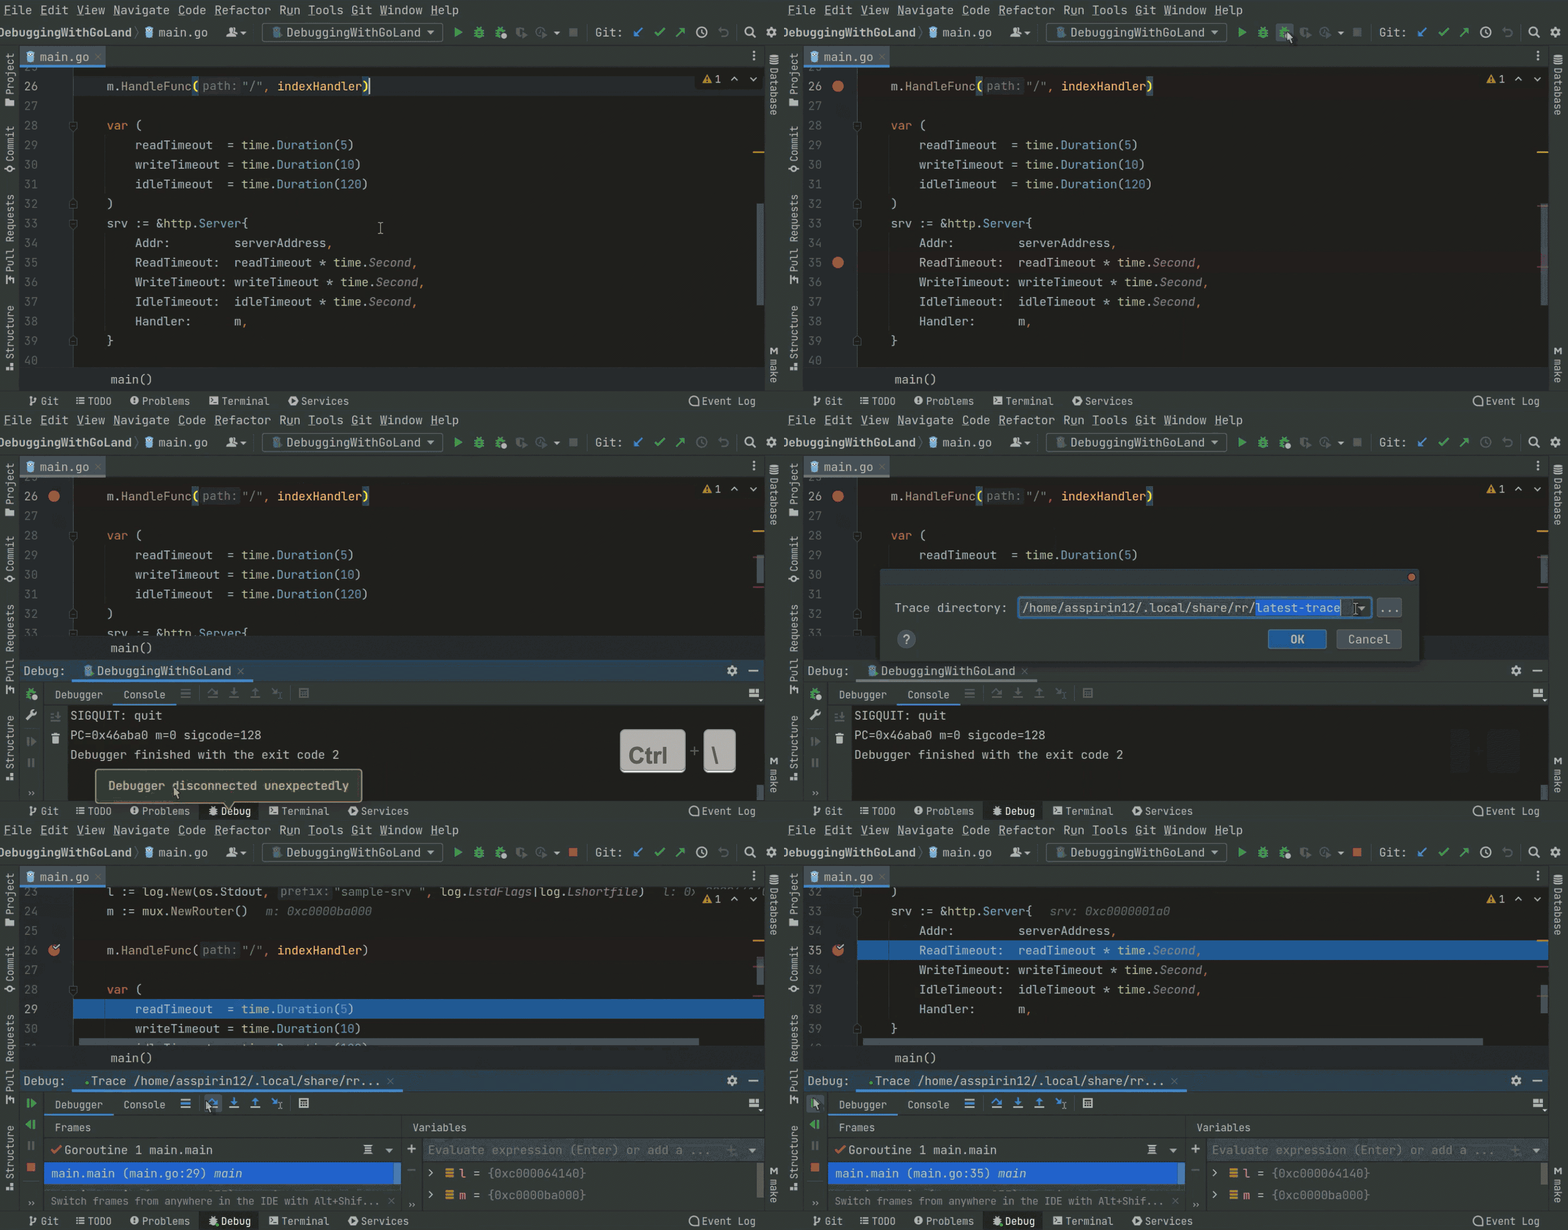
For applications that do terminate, like CLI applications, GoLand will automatically start the replay session.
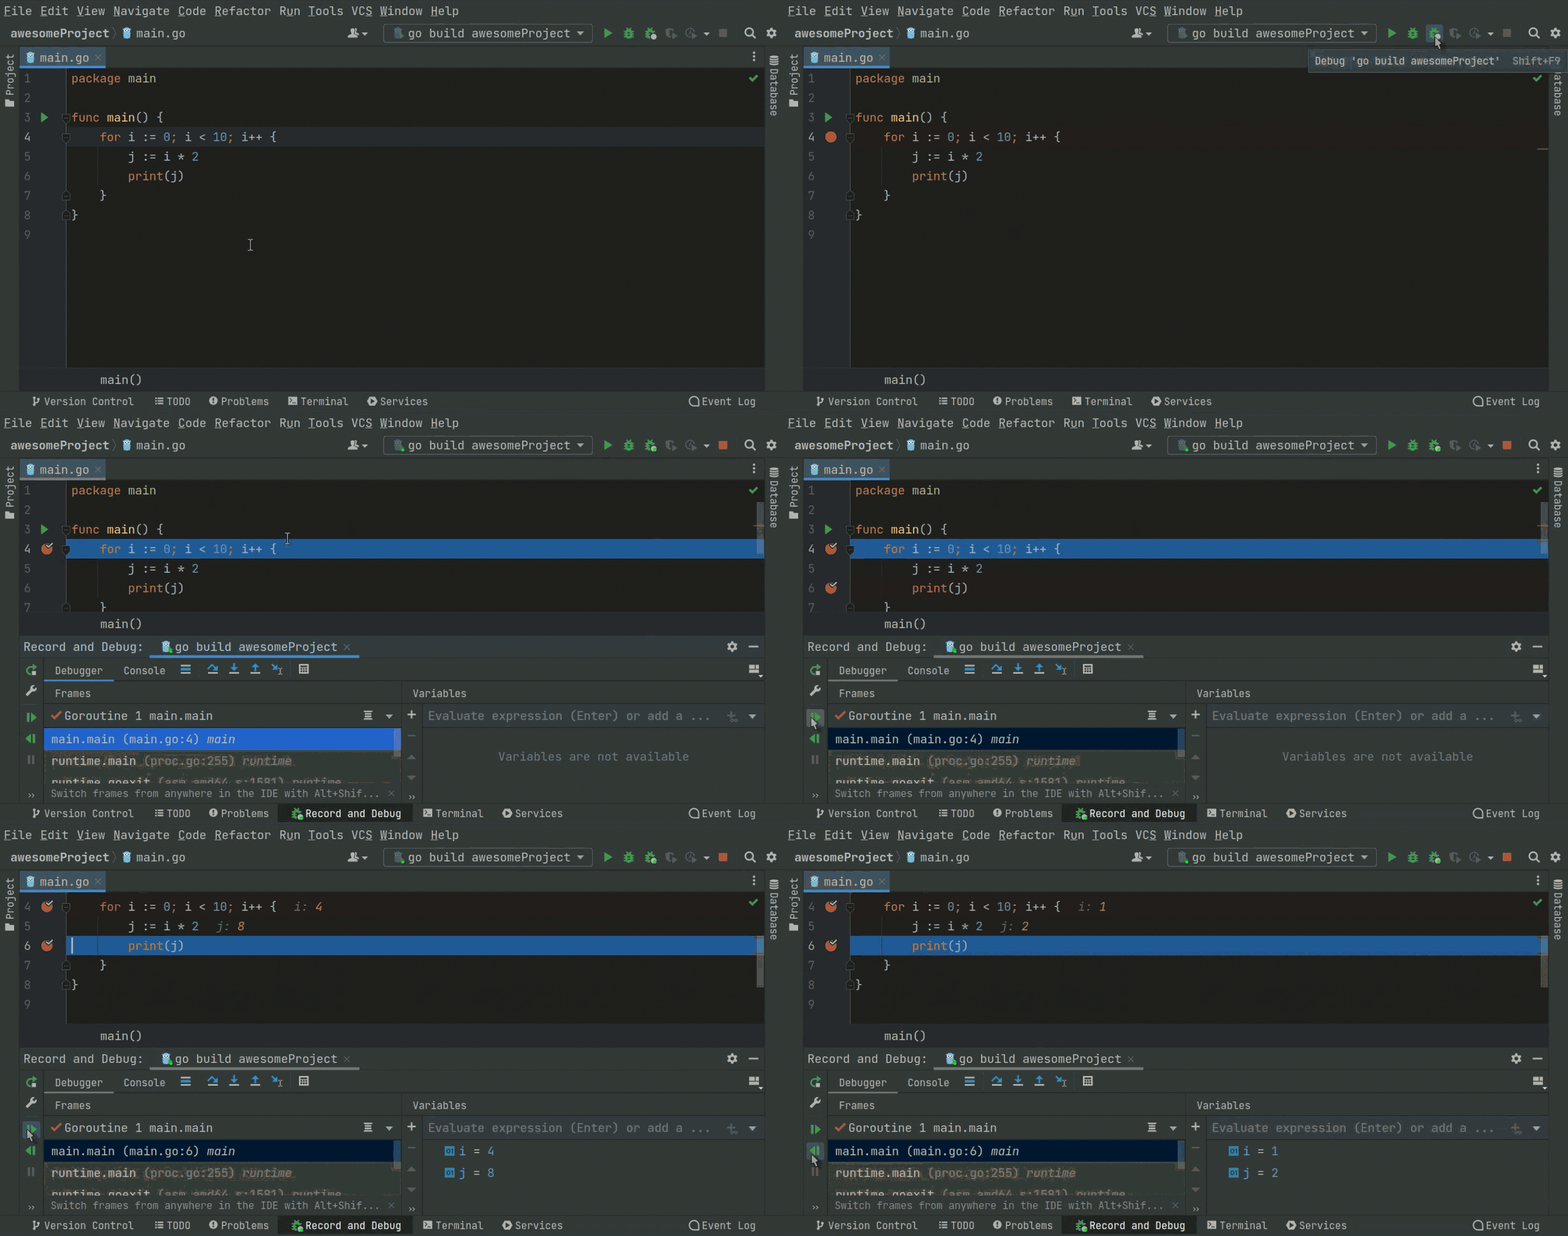
Here is where the debugging session is different from the regular debugging session. The debugger will not stop at breakpoints during the “record” part of the session; it will only do so during the replay part. If no breakpoints are set, then the debugger will just end, and we’ll need to replay the last session manually, again with breakpoints required to be present – otherwise this will finish the replay session and exit without stopping.
If a breakpoint is present, then the debugger will stop at it, and it will offer a similar experience to a normal debugger session.
As for the “reversible” part, this is where the best part of using rr comes into play. If a breakpoint is placed before the current execution point, then we can use the Rewind feature to go back to it and retry the execution from there. Features such as watching variables or evaluating expressions will work as well.
I hope that this post will help you discover a new powerful tool to have under your belt, which can speed up finding and fixing bugs in your applications.
This wraps up our series on debugging with GoLand. As usual, if you have any comments or would like to learn more about this, please use the comments section below, or reach out to us on Twitter, or on our issue tracker.


