GoLand 2019.1 EAP 8: Built-in Heap, Mutex and Block Profilers

GoLand 2019.1 EAP 8 is here!
Get this new EAP build via our Toolbox App, from the website, as a snap package (for Linux), or directly from GoLand – just select Automatically check updates for Early Access Program in Preferences / Settings | Appearance & Behavior | System Settings | Updates.
Built-in Heap, Mutex, and Block Profilers
Profiling is the best way – and sometimes the only way – to know the real performance of your application.
That’s why we are happy to let you know that GoLand has expanded its tooling support by integrating with Memory, Mutex, and Blocking profilers in addition to the CPU profiler.
You can run profilers right from the IDE, and then review the analysis results in a dedicated tool window (View | Tool Windows | Performance Profiler).
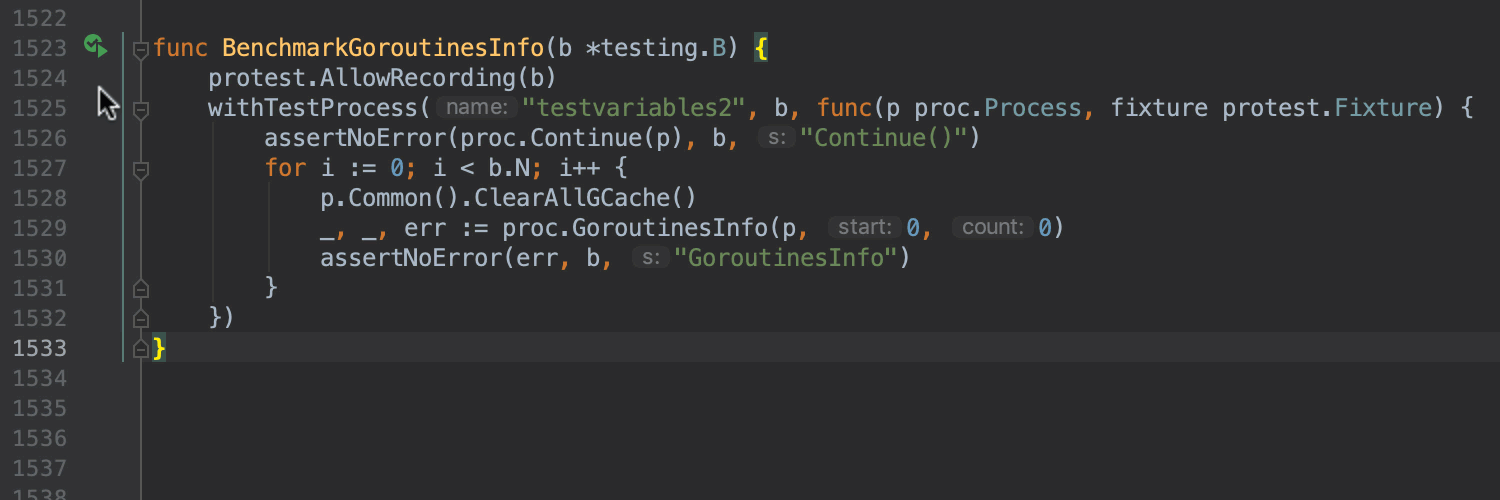
To run the profiler, use the new Run with Profiler button and choose the required configuration in the navigation toolbar. Alternatively, select any of new actions in the run menu, which appears when you click on the run icon in the left gutter.
To get a better understanding of the possible performance issues in your code, sort the results by metrics. Each particular profiler has different metrics appropriate for its type via the Metric’s popup menu.
The Memory Profiler lets you sort and explore the results by Allocated objects, Allocated space, In-use objects, and In-use space. The Blocking Profiler and Mutex Profiler provide two options for metrics: Contentions and Delay.
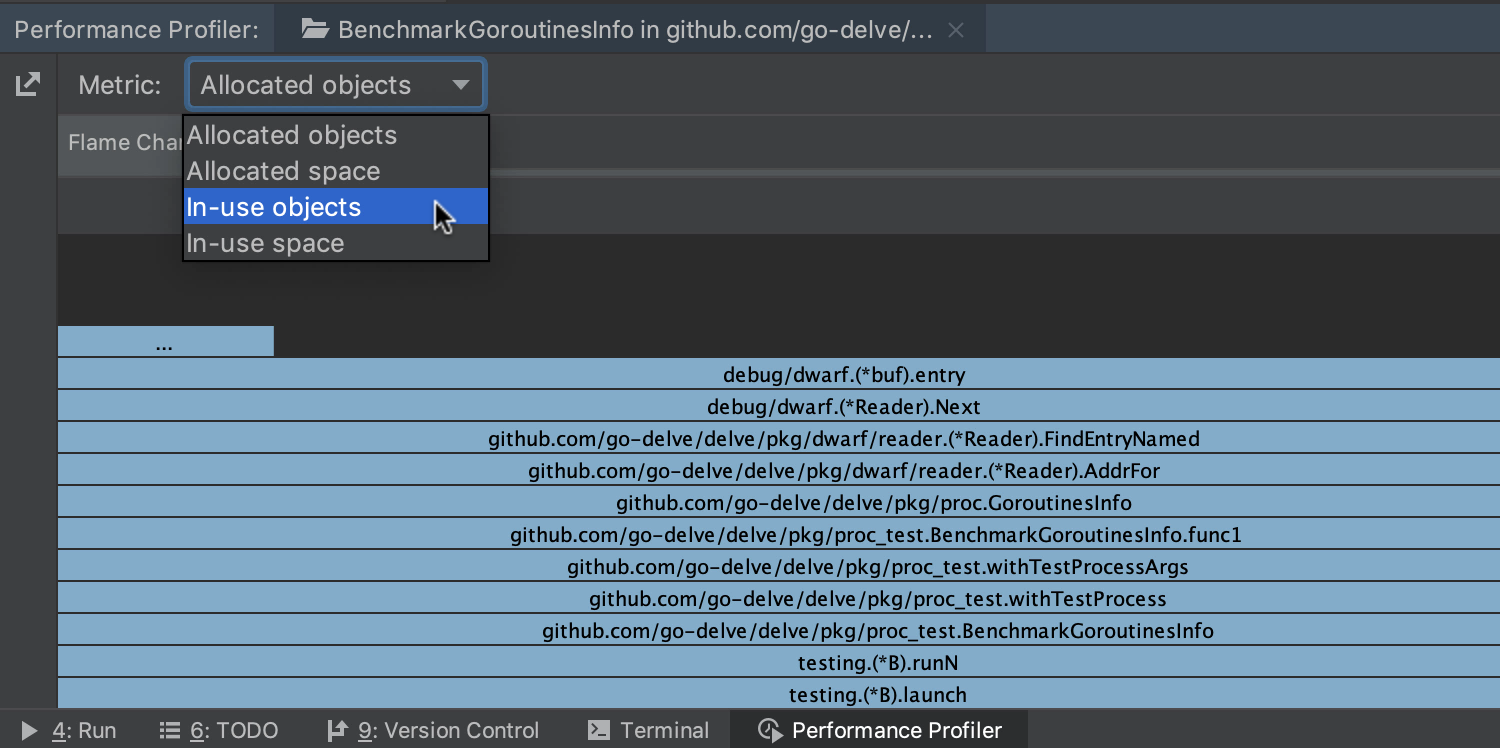
In addition, use the Flame Chart, Call Tree and Method List tabs to identify performance problems more quickly. Right-click on any method in these tabs to switch focus to its data in the Methods List or in the Flame Chart, or vice versa, or even navigate to the source code to inspect the issues in the code base.
We will cover new profiler features in greater details soon, so stay tuned!
Support for Minidumps
We’ve enhanced dumps support in GoLand 2019.1. In addition to exploring core dumps, now you can also open and analyze windows minidumps right in the IDE. Like with core dumps, all you need to do is to select Run | Open Core Dump.
Note that minidumps are available only on Windows machines by default. However, you can analyze them on any flavor of macOS, Windows, or Linux.
Noticeable bug-fixes:
GO-6517 — The debugger supports attaching and detaching to the same remote process multiple times without terminating the process.
Remember that we always appreciate your feedback, so please share it with us here in the comments, on Twitter, or in our issue tracker.