GoLand 2019.1 Goes Beta

The upcoming GoLand 2019.1 is now in Beta!
For three months now, our team has worked hard to turn our roadmap into reality, to meet your expectations, and hopefully to feel that pleasant fatigue that you get after you’ve done even more than planned.
After this Beta milestone, we will mostly focus on eliminating bugs and polishing UI elements and everything around until the major release.
Get this Beta build via our Toolbox App, from the website, as a snap package (for Linux), or directly from GoLand – just select Automatically check updates for Early Access Program in Preferences / Settings | Appearance & Behavior | System Settings | Updates.
Before I give you the headliners of this release, let me just note that the Beta is quite stable in comparison to our other EAP builds, though some clumsy things may still pop up here and there.

Click on a topic below to learn more about a specific area you’re interested in, or read through the whole blog post to get yourself up to speed with all the new improvements:
- Built-in Heap, CPU, Mutex, and Block profilers
- Smart Step Into
- Extract Interface refactoring
- More capable Rename
- Nilness Analyzer
- Handy general changes
- Debugger updates
- Intention Actions
- VCS updates
- Even more nice things
Built-in Heap, CPU, Mutex, and Block profilers
We’re not ashamed to say that GoLand 2019.1 takes your profiling experience to a whole new level of productivity, and we can back this claim up with hard data.
To expand its tooling support, GoLand now integrates with Memory, CPU, Mutex, and Blocking profilers. This means you can start profiling your application in one click, right from the IDE, and then review the analysis results in a dedicated tool window (View | Tool Windows | Profiler).
Sort the results by special metrics appropriate for each type of profiler. With Flame Chart, Call Tree, and Method List tabs as well as navigation to the source code from any method, you can identify performance problems much quicker than before.
Smart Step Into
A new debugger action, Smart Step Into, is one more thing that makes us proud as it saves you plenty of time while debugging a chain of calls and nested method calls. Step into arbitrary calls in an expression, automatically stepping over the methods which you are not interested in. To invoke Smart Step Into, press Shift+F7 or select Smart Step Into from the Run menu.
Read this blog post to learn more about the new debugging features in GoLand 2019.
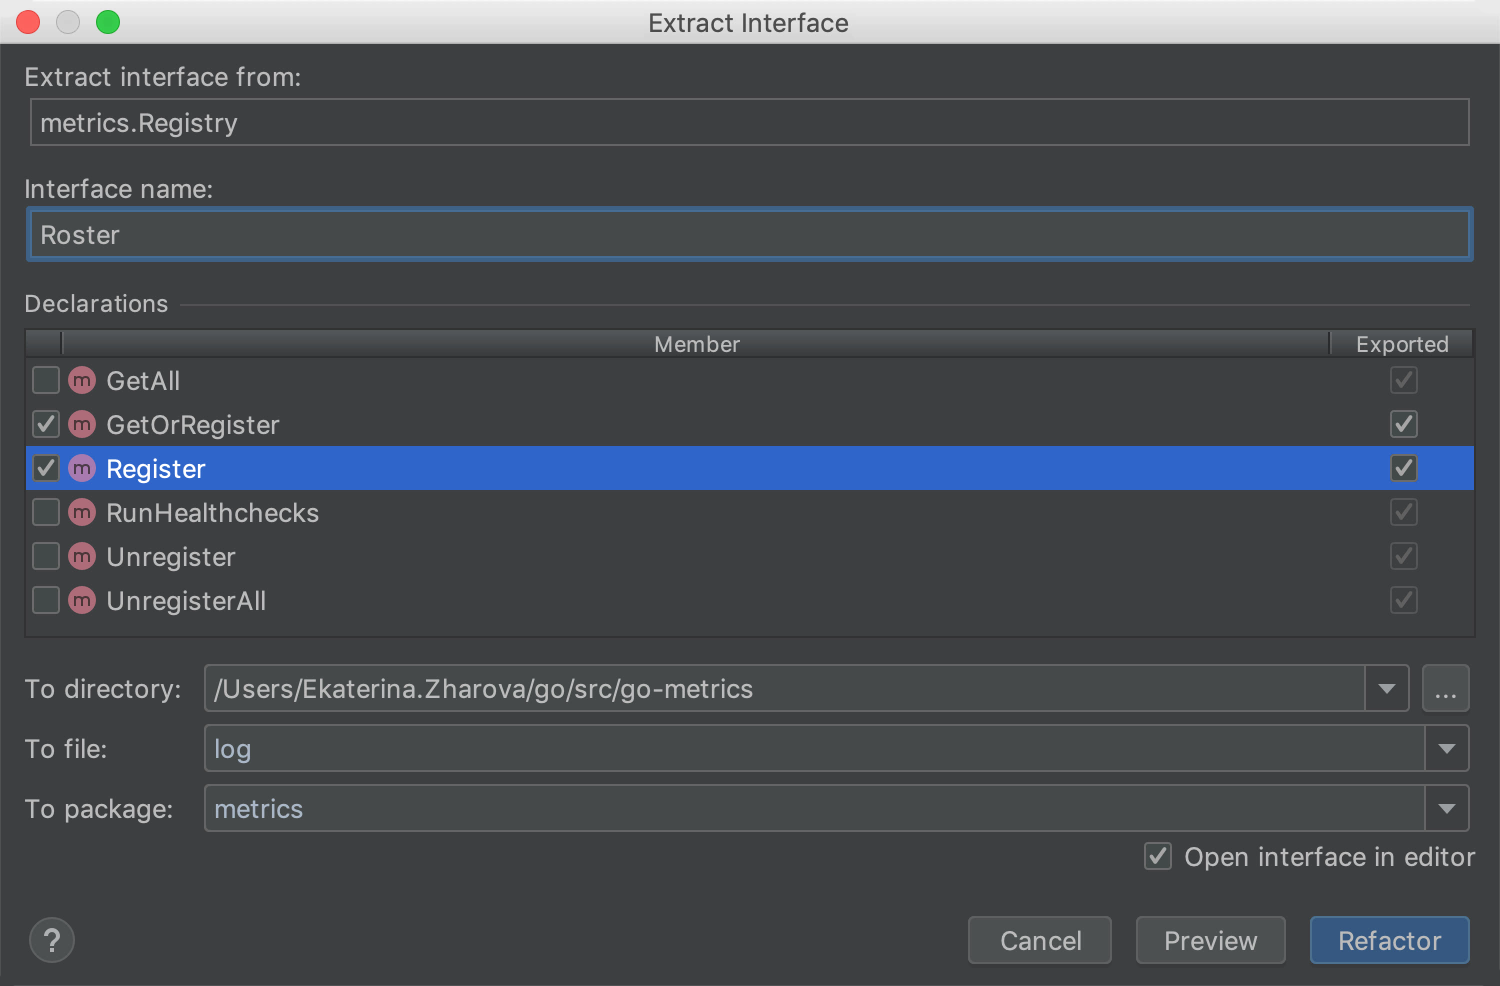
Extract Interface refactoring
The Extract Interface refactoring helps you quickly create a new interface based on the selected type. It shows a list of suggested members to be transferred to the new interface. You can specify a name for the interface and choose the file, directory, or package where it should be placed.
To learn more, see Extract interface refactoring in GoLand 2019.1.
More capable Rename
The Rename refactoring can now rename methods declared in interfaces. When renaming such methods, GoLand will offer to rename their implementations as well.
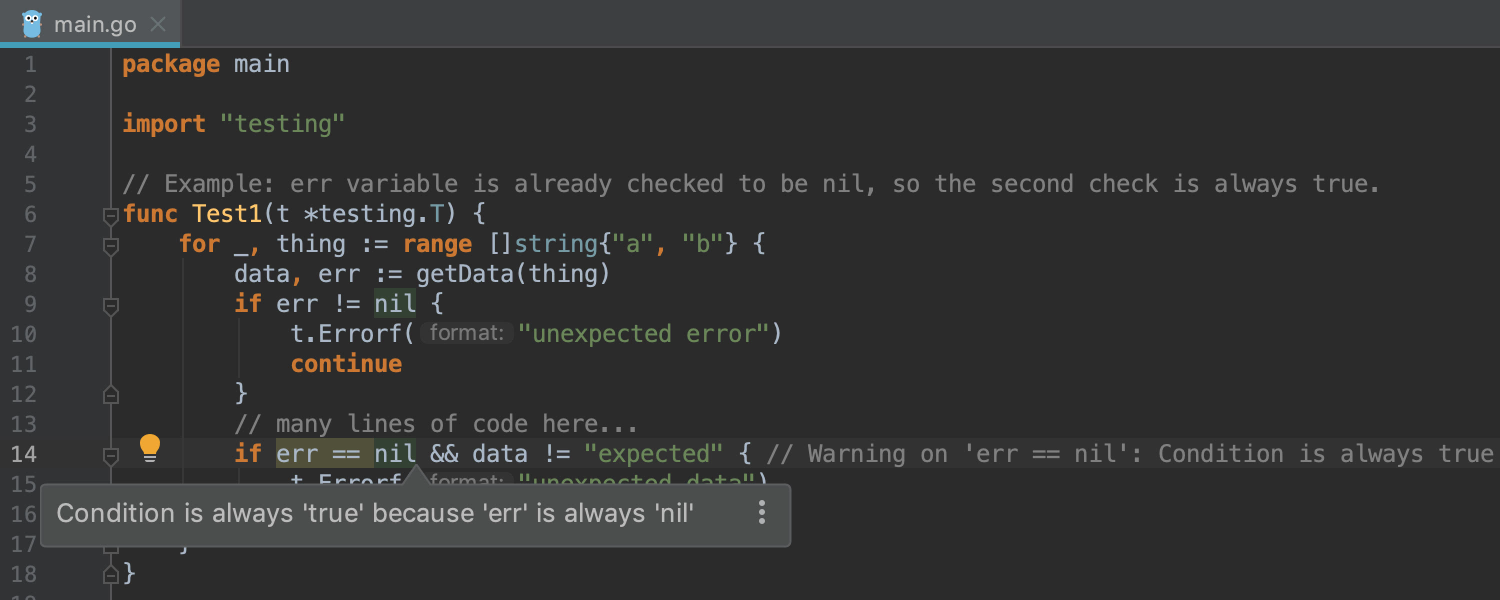
Nilness Analyzer
Go gives us many ways to make the zero value useful, but the more opportunities we have, the easier it is to fall into a trap.
Our brand new Nilness Analyzer is a set of code inspections designed to instantly detect whether variables might have nil or not nil values in a variety of cases.
It warns you about:
- redundant comparisons such as
v == nilifvis known to be alwaysnilor notnil. - trying to access a variable pointing to nothing and faced with ‘nil pointer dereference’.
- unintentionally raising panics when indexing a nil slice.
- and much more.
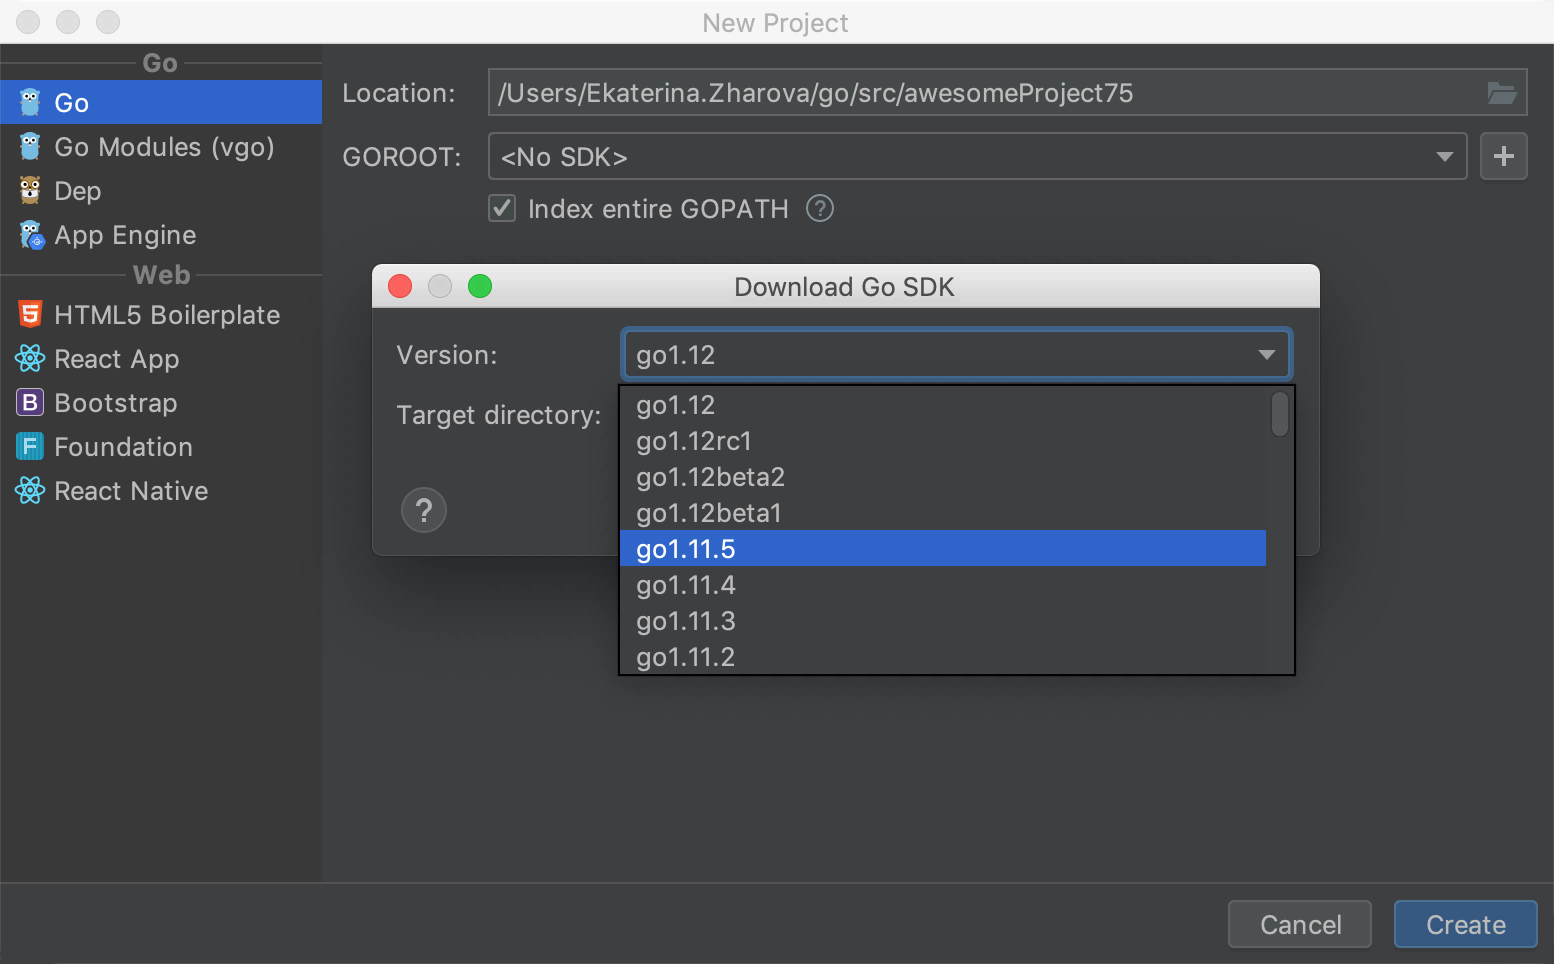
Handy general changes
In the upcoming GoLand 2019.1, you can fully manage your Go SDK downloads and installations right from the IDE.
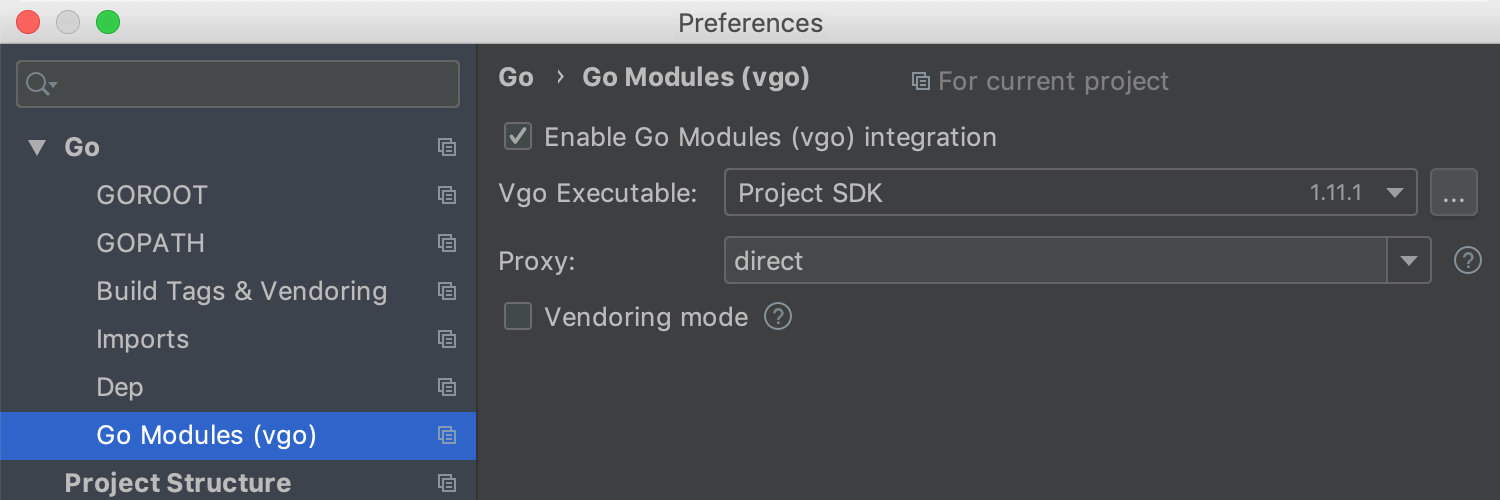
The Go Modules projects template gets a new Vendoring mode checkbox, which lets you use libraries from the vendor folder without any external dependencies or connection to the Internet. The same checkbox is also available via settings in Preferences | Go | Go Modules (vgo).
To learn more about using vendoring with Go Modules, please read this article from the Go team.
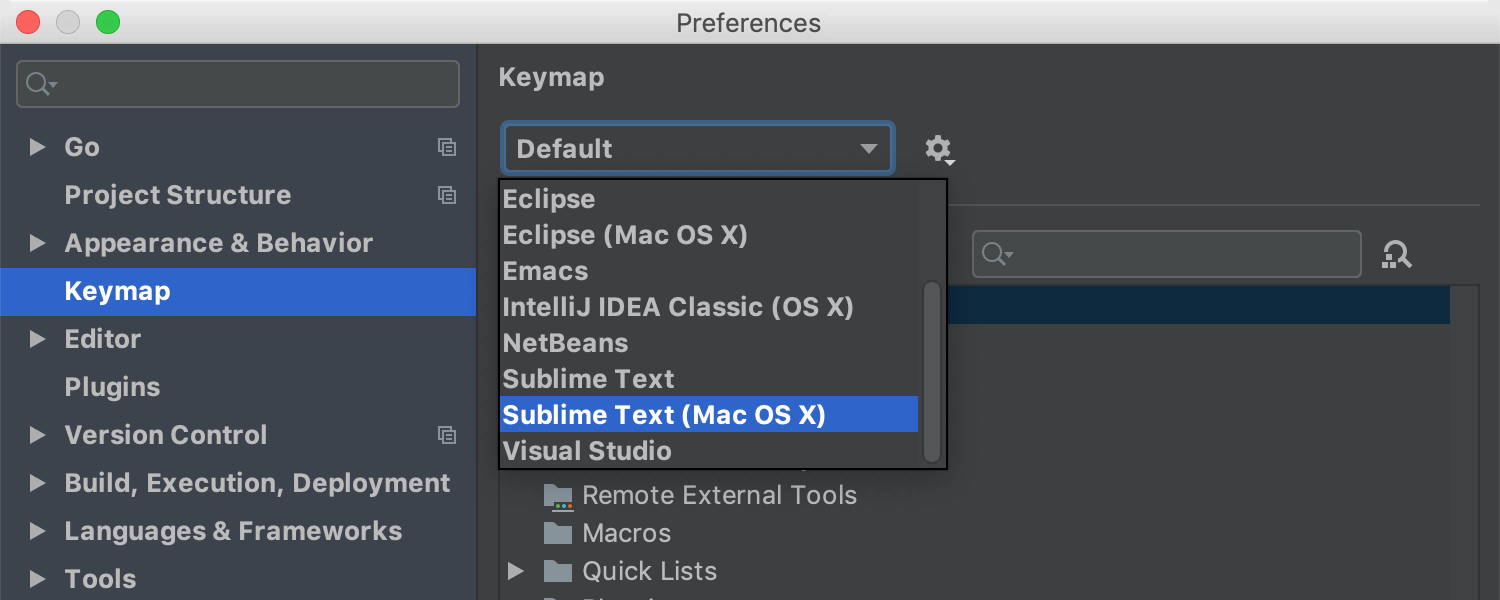
Feel right at home with the new pre-configured Sublime Text keymap available at Preferences | Settings | Keymap, and the pre-configured VS Code keymap available via this plugin.
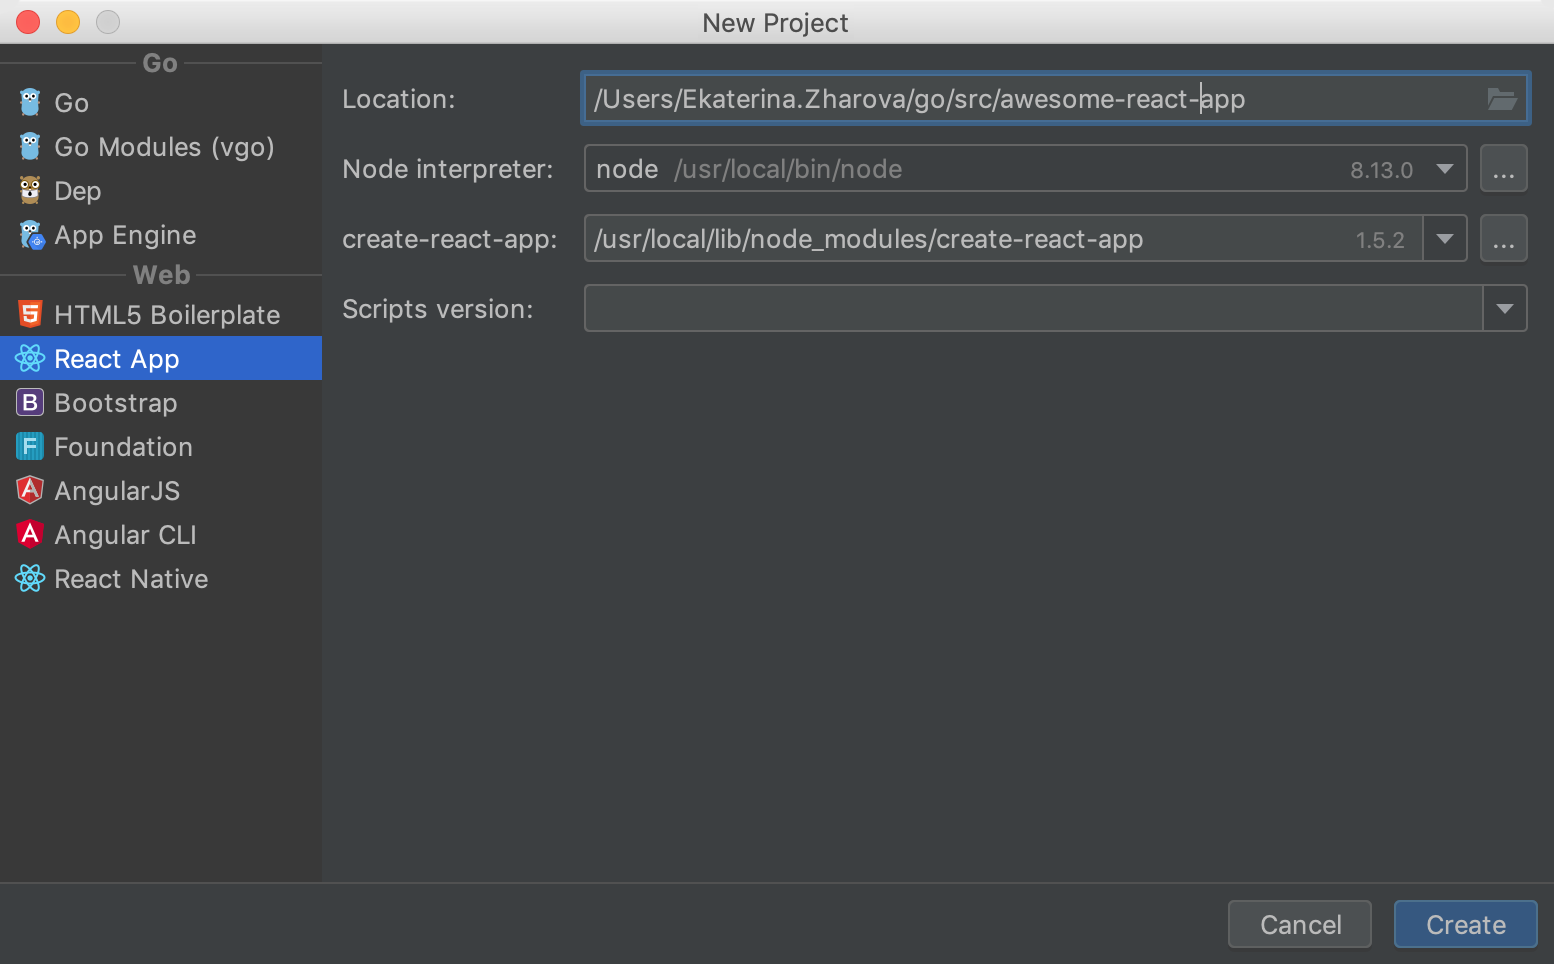
Project templates for web development (such as React App, React Native, HTML5 Boilerplate, and Foundation) are now available from the Welcome screen.
Debugger updates
Goroutines instead of threads
The debugger output now displays goroutines instead of threads. Switch between them, quickly navigate to standard Go libraries, and get more information about how your code is being executed.
View int as binary, decimal, or hex
You can now choose whether to display int variables in the debugger views as binary, decimal, or hex. Right-click a variable and select the appropriate or preferred option under View as.
Support for minidumps
In addition to exploring core dumps, now you can also open and analyze windows minidumps right in the IDE. Like with core dumps, it’s as easy as selecting Run | Open Core Dump.
To learn more, read Debugging in GoLand — Windows Minidumps on our blog.
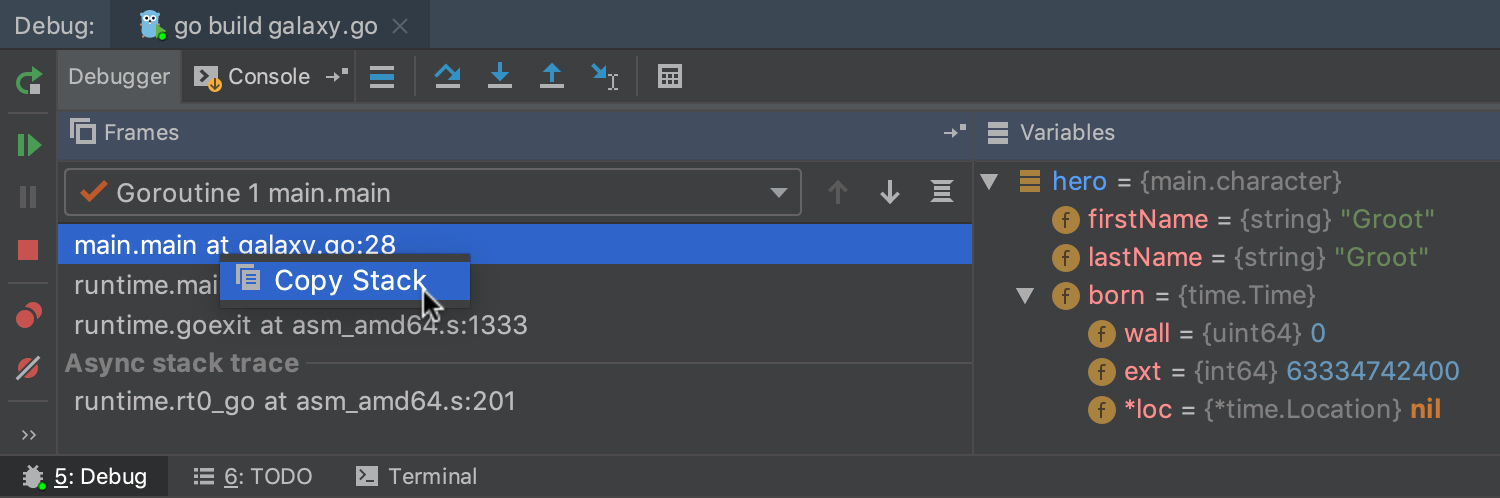
Copy Stack
Copy Stack, available in the Debugger tab by right-clicking on the goroutine list, copies the whole frame stack to the clipboard.
Run to Cursor as mouse gesture
The Run to Cursor action is now available by clicking on a line number while debugging. Hover over a line to highlight it. Click a line number to Run to Cursor.
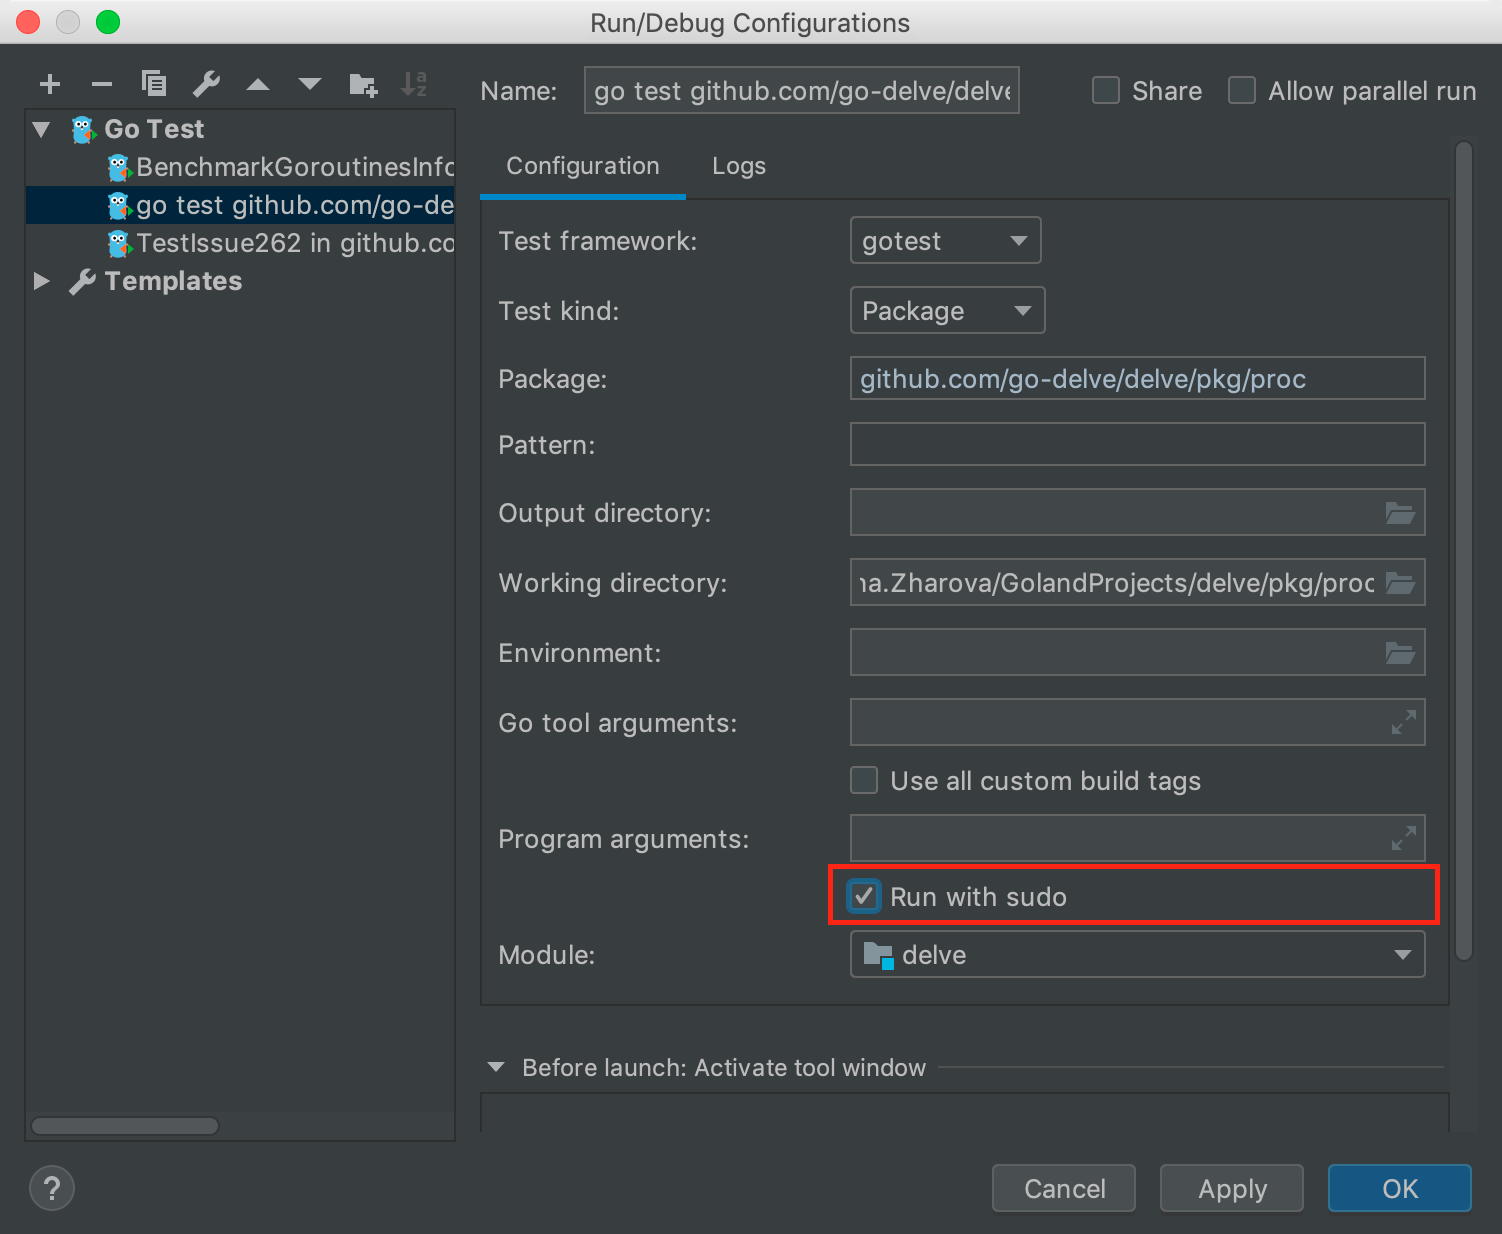
Run Go configurations with sudo
Run/Debug Configurations can now be run with sudo. It allows you to debug applications which require privileged operations as a user.
Intention Actions
We’ve added a set of intention actions to help you reformat declarations the way you want: add or remove parentheses to a declaration, merge a declaration up, split a declaration into two group, by comma, and more.
For the complete list of available actions and their detailed descriptions, go to the Declaration section of Go in Settings/Preferences | Editor | Intentions.
A new Export intention action lets you export a private function, type, or field without switching between packages. In addition, GoLand now resolves references to unexported symbols, but it will still notify you that it’s an error.
VCS updates
The new Uncheck all checkbox for Partial Git commits (git add -p) lets you uncheck all the code chunks at once, and lets you choose the ones you want to commit, too.
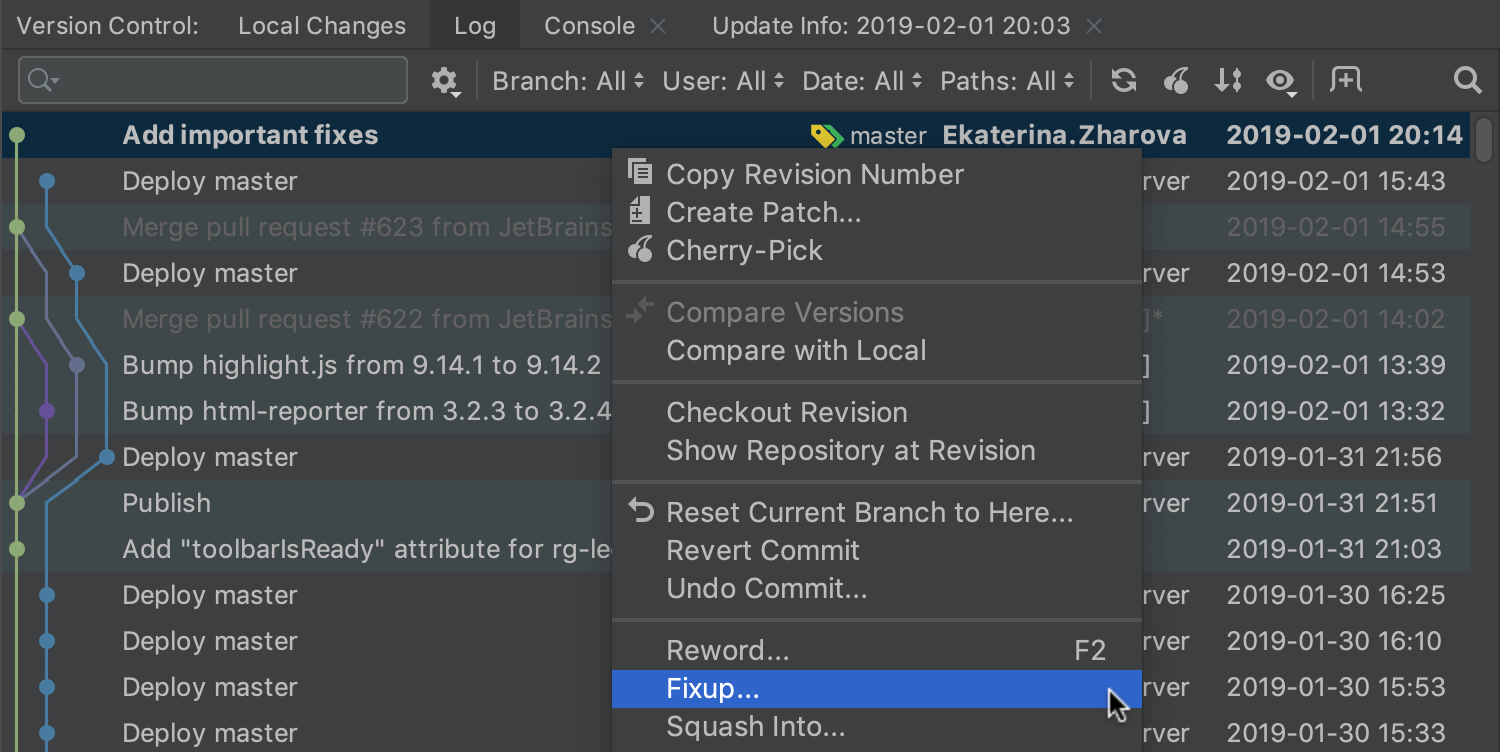
The Log tab in VCS gets Fixup and Squash Into actions to create commits with the correct fixup! and squash! messages.
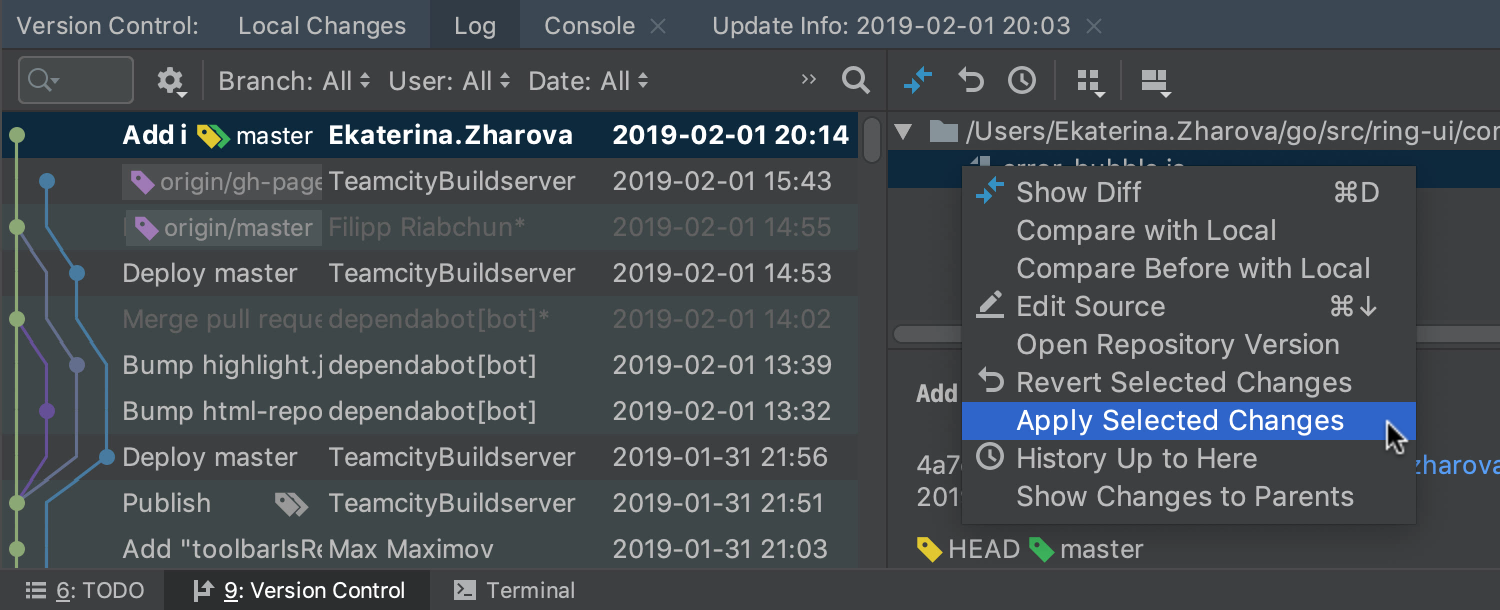
You can now use the context menu on the Log tab to cherry-pick selected files from the commit.
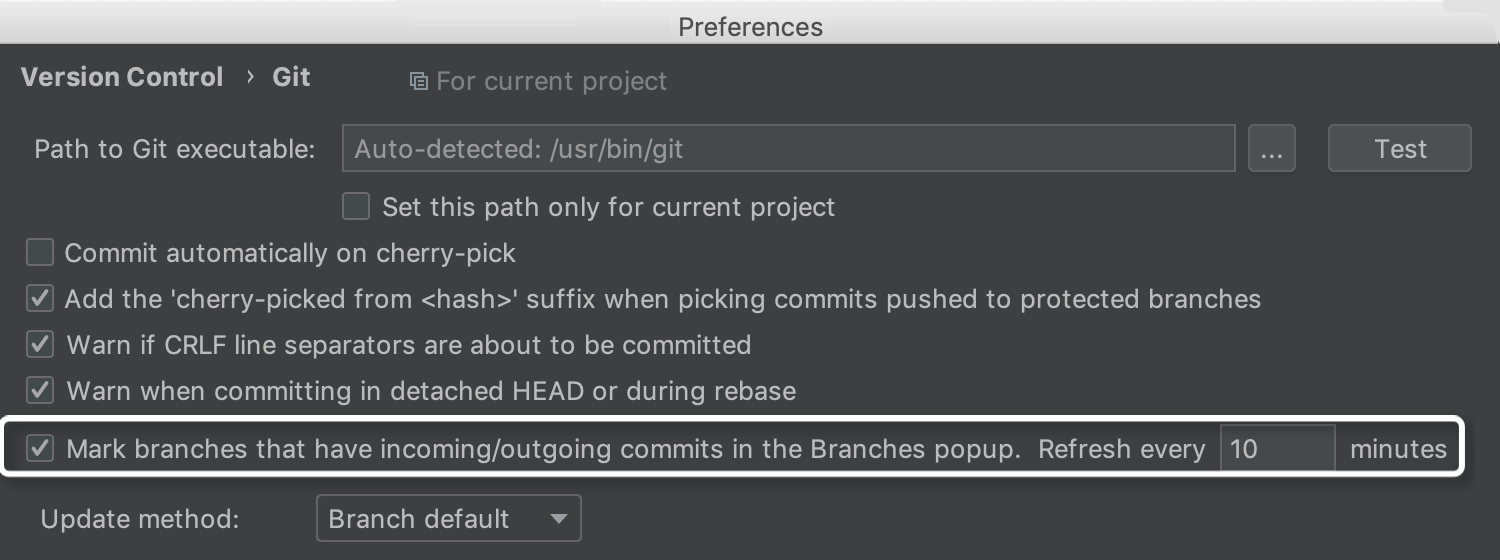
If you go to Preferences/Settings | Version Control | Git and select Mark Branches that have incoming/outgoing commits in the Branches popup, the IDE will indicate if the incoming and outgoing commits are available for individual branches in the Branches popup.
The Recently Deleted node in the Shelf tree shows all the recently deleted files and helps you restore any of them.
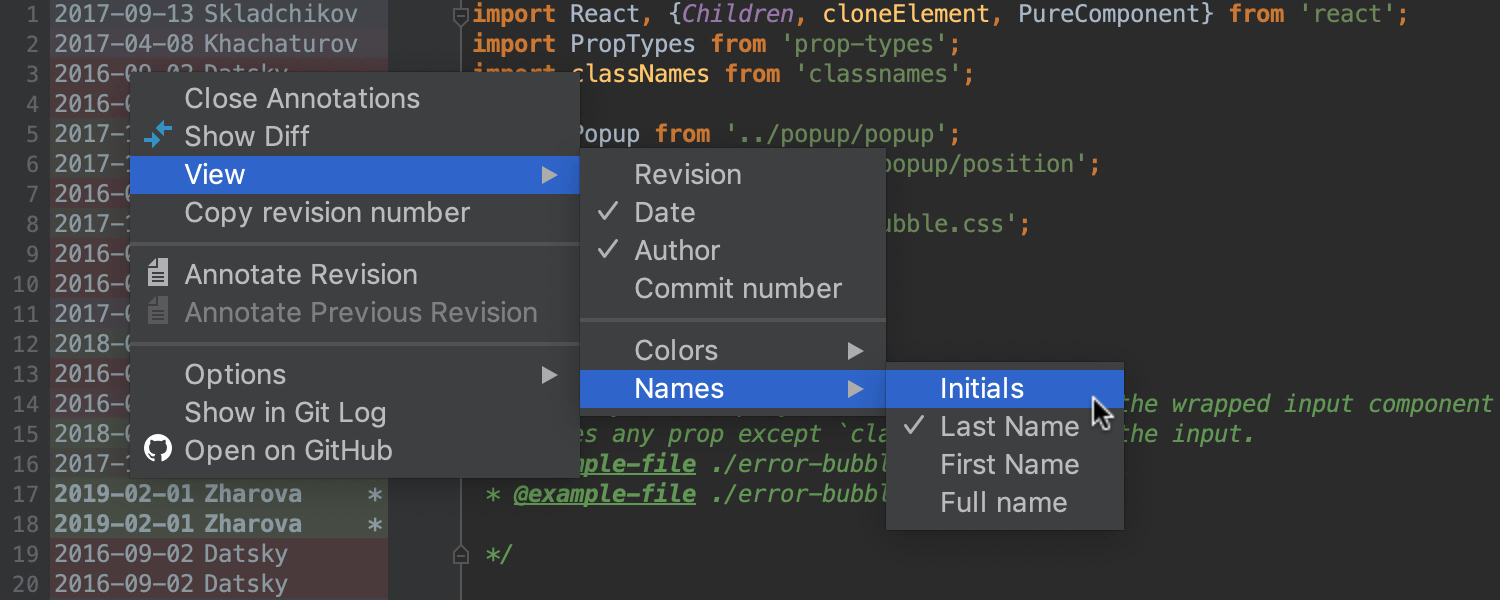
In addition, the IDE gives you a choice to display the initials of authors instead or their full names in the VCS annotations.
Even more nice things
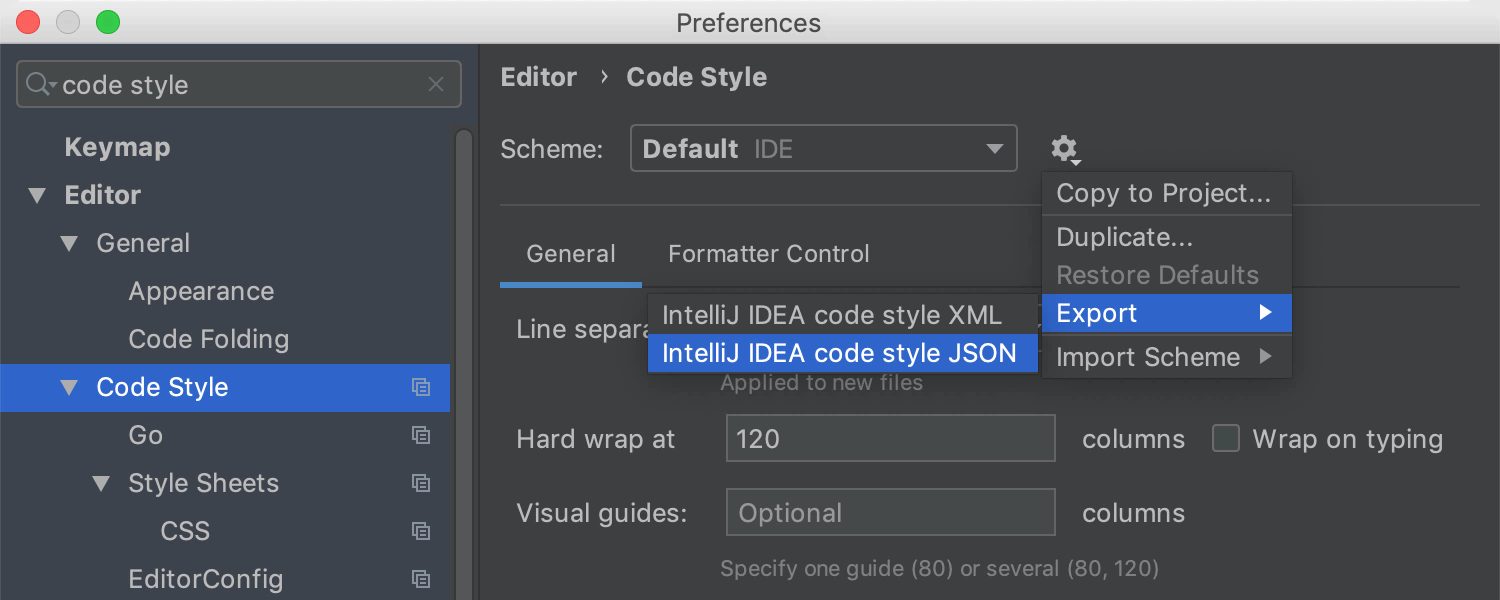
Now it is possible to export Code Style settings to JSON. This is in addition to the already available option export to XML, available under Preferences /Settings | Editor | Code Style.
Copy & paste text to the Blank Diff window by dragging a file to it. Alternatively, you can do the same through file navigation.
In the Project view, the files and folders that are ignored now use olive-green to help you distinguish them from other files. You can modify their color in Preferences/Settings | Version Control | File Status Color.
That’s all! Download the Beta version from the website, via our Toolbox App, or right from the IDE. And do share your feedback with us: here in comments, in our Twitter, or our bug tracker.
Subscribe to GoLang Blog updates