

Debugging with GoLand – Windows minidumps

Updated and validated on January 17, 2022. You can find more tutorials on how to debug Go programs here. You may also refer to the Debugging section of our Help documentation.
- Debugging with GoLand – Getting Started
- Debugging with GoLand – Essentials
- Debugging with GoLand – Advanced Debugging features
- Debugging with GoLand – Windows minidumps (this post)
A while back we talked about debugging the core dumps produced on Linux systems.
Since then, the IDE has had an update that allows it to debug the equivalent memory dumps produced on Windows systems, called minidumps. As with core dumps, minidumps can be analyzed on any operating system, not just on Windows.
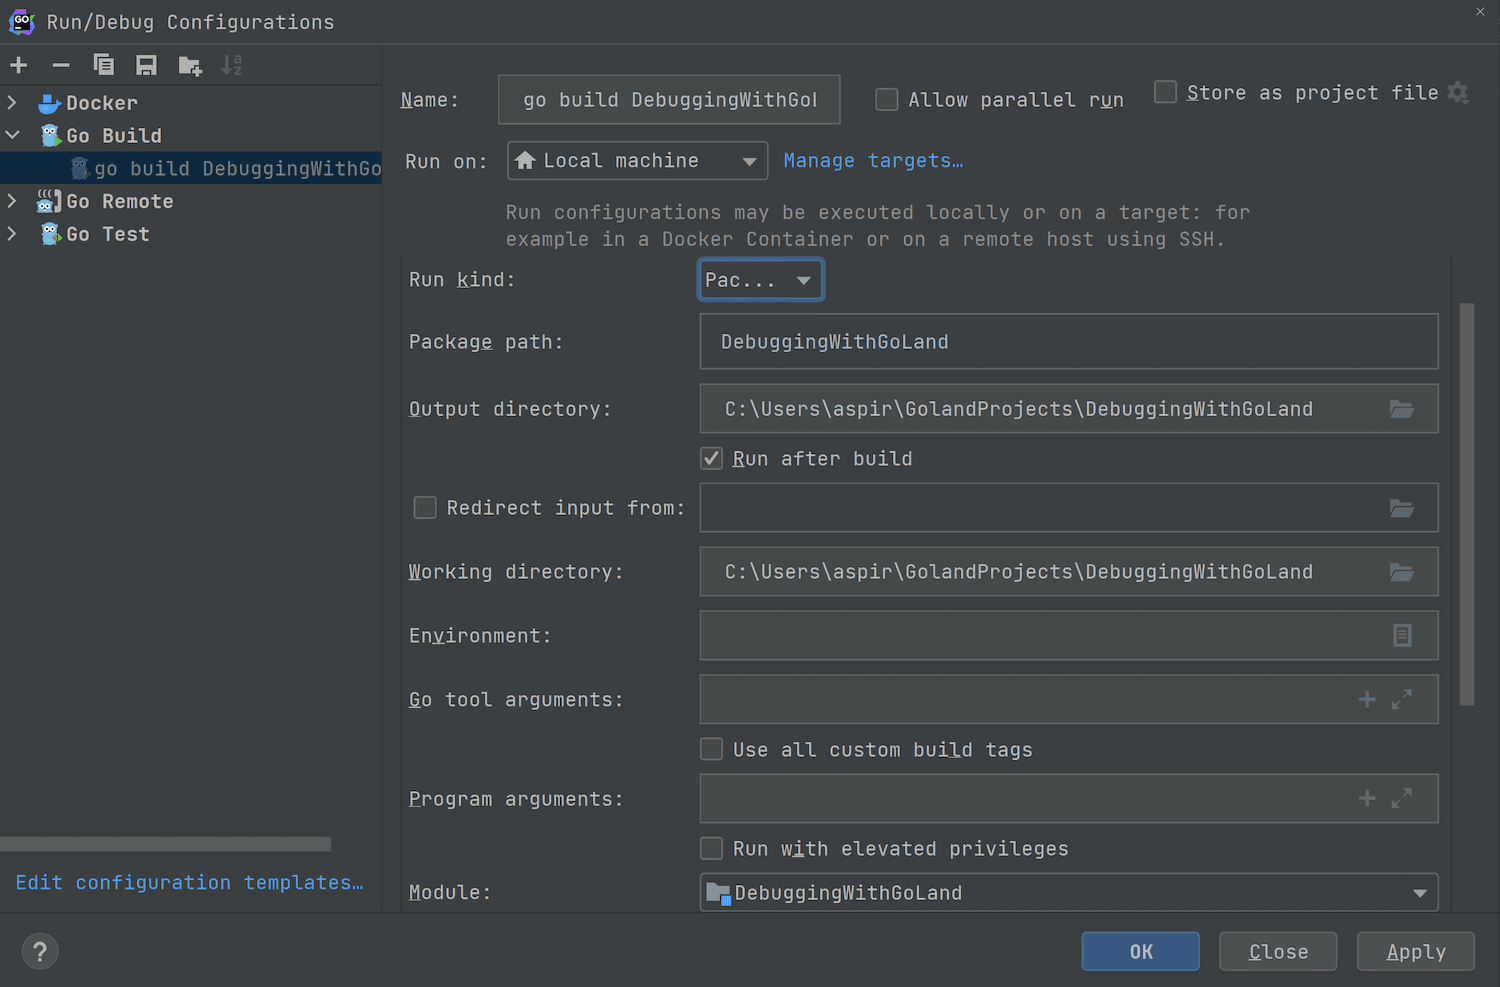
Let’s start with getting the minidump itself. As with coredumps, set the Output Directory of the run configuration; this is where the binary will be created (you can find the code in this repository).
Then, start the application and use it as usual. When you are ready, open the Task Manager, go to Processes, select your application and then right-click it and select Create dump file. This will give you a location for the minidump file, such as %TMP%\<binary-name>.DMP
Now, go to Run | Open Core Dump… , select the application binary, the minidump generated above, and the IDE will show the debugger window.
That’s it for today. Please let us know what feedback you have in the comments section below, on Twitter, or on our issue tracker. We are also looking for your thoughts on what topics you would like to see covered next.
Subscribe to GoLang Blog updates


