How to Find Goroutines During Debugging

Goroutines are an essential part of most programs written in Go. But using lots of goroutines makes a program harder to debug. Or does it? In this blog post, we’ll take a look at labeling goroutines with custom data, one of the latest features in GoLand 2020.1, which is now in EAP.
- Usage from the IDE
- Usage from the command line
- Performance implications
- Using a custom library to enable debugging labeling
Let’s take the example of an application that makes requests to a web server:
package main

import (
    "io"
    "io/ioutil"
    "math/rand"
    "net/http"
    "strconv"
    "strings"
    "time"
)

func fakeTraffic() {
    // Wait for the server to start
    time.Sleep(1 * time.Second)

    pages := []string{"/", "/login", "/logout", "/products", "/product/{productID}", "/basket", "/about"}

    activeConns := make(chan struct{}, 10)

    c := &http.Client{
        Timeout: 10 * time.Second,
    }

    i := int64(0)

    for {
        activeConns <- struct{}{}
        i++

        page := pages[rand.Intn(len(pages))]

        // We need to launch this using a closure function to
        // ensure that we capture the correct value for the
        // two parameters we need: page and i
        go func(p string, rid int64) {
            makeRequest(activeConns, c, p, rid)
        }(page, i)
    }
}

func makeRequest(done chan struct{}, c *http.Client, page string, i int64) {
    defer func() {
        // Unblock the next request from the queue
        <-done
    }()

    page = strings.Replace(page, "{productID}", "abc-"+strconv.Itoa(int(i)), -1)
    r, err := http.NewRequest(http.MethodGet, "http://localhost:8080"+page, nil)
    if err != nil {
        return
    }

    resp, err := c.Do(r)
    if err != nil {
        return
    }
    defer resp.Body.Close()

    _, _ = io.Copy(ioutil.Discard, resp.Body)

    time.Sleep(time.Duration(10+rand.Intn(40)) + time.Millisecond)
}
Usage from the IDE
If we analyze this code in a debugger, how can we tell what the makeRequest goroutines are doing? And where are they when we look at a list like this?
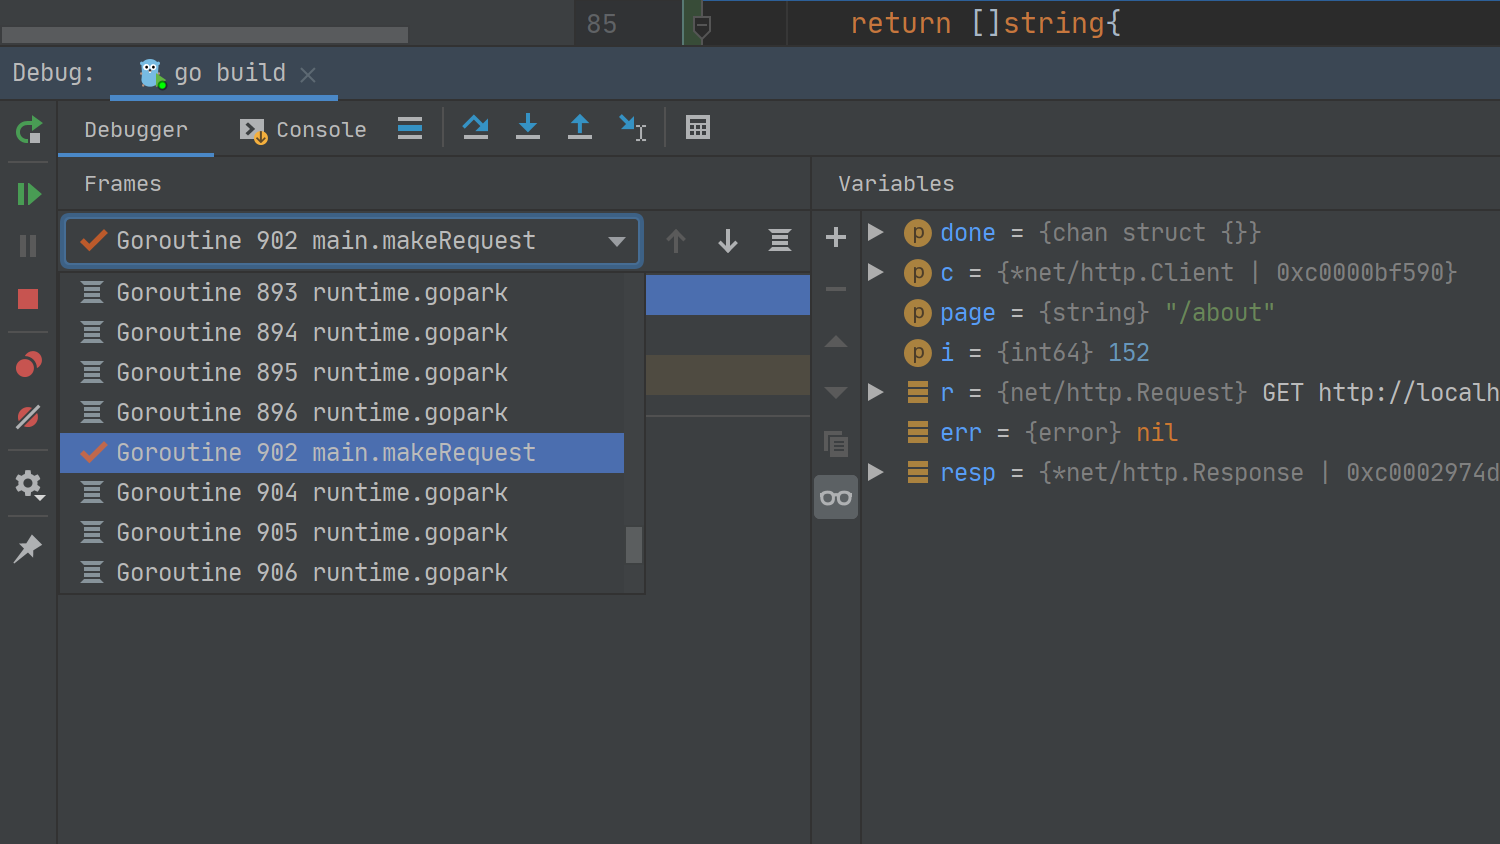
This is where the newly released GoLand feature that supports reading goroutines labels comes to the rescue.
Let’s adjust the code above to read like this:
go func(p string, rid int64) {
    labels := pprof.Labels("request", "automated", "page", p, "rid", strconv.Itoa(int(rid)))
    pprof.Do(context.Background(), labels, func(_ context.Context) {
        makeRequest(activeConns, c, p, rid)
    })
}(page, i)
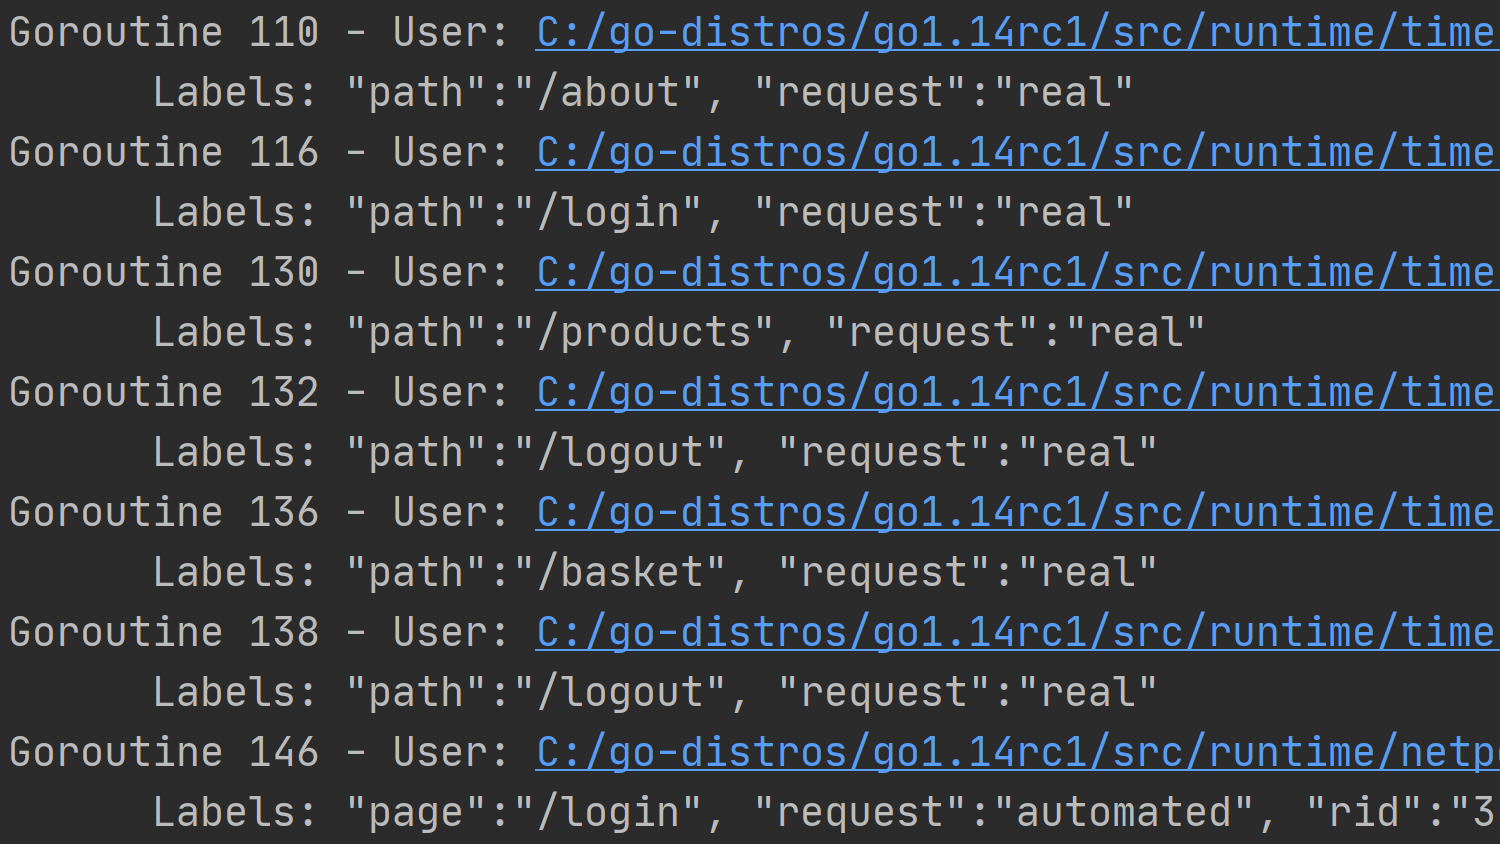
Now when running the same code in the debugger, we’ll have the following view:
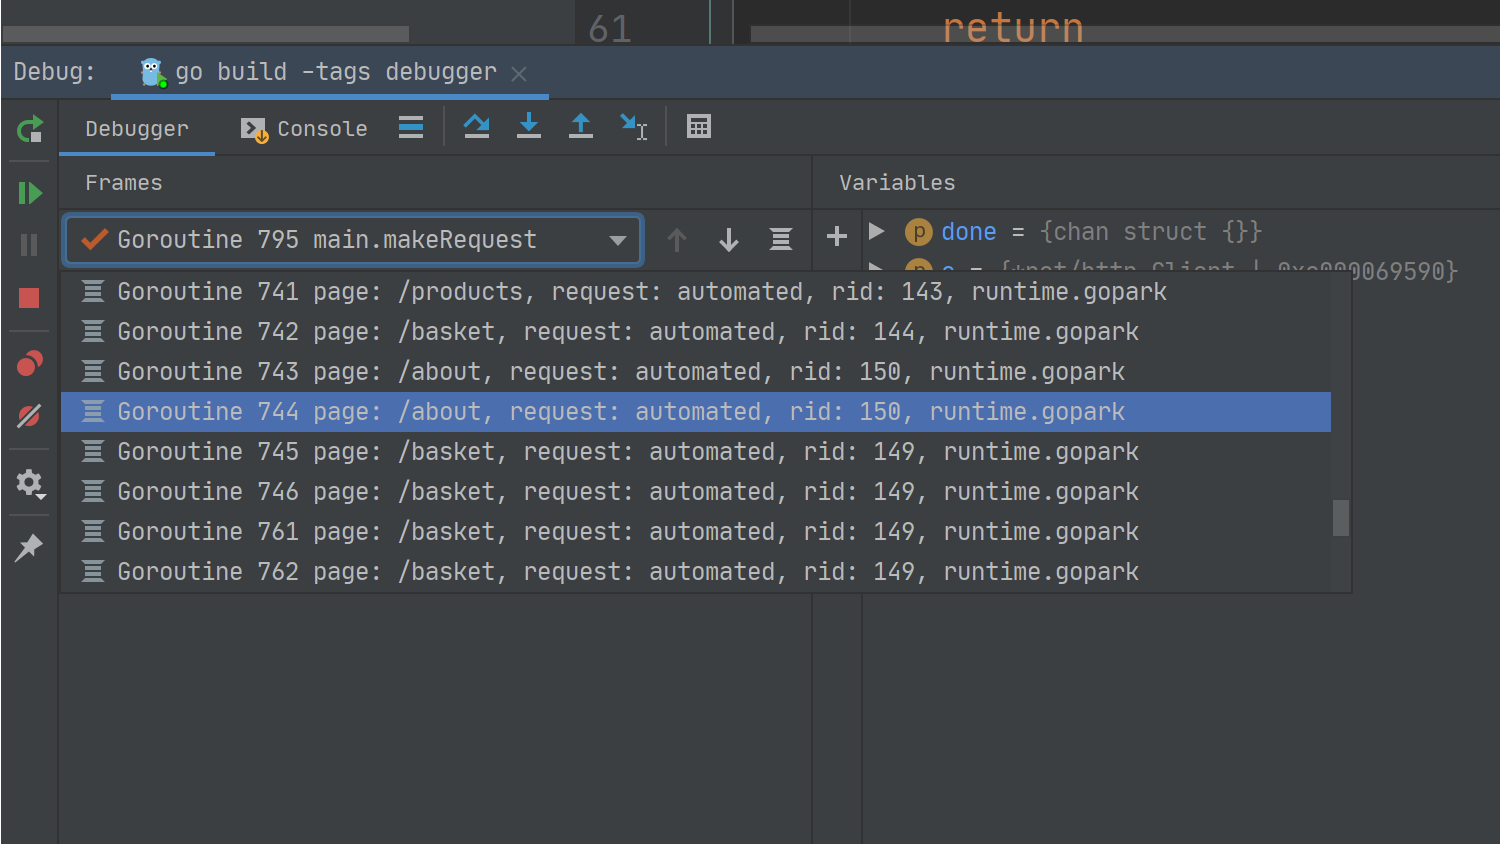
This looks much better. We can now see all the information we set in the labels. And, best of all, we can also see any other goroutines launched in the background by our function calls, which will all carry the labels automatically.
As HTTP handlers are pretty popular in terms of function signatures and can be compared with other handler types, let’s have a look at how we can adjust the code below to have labels set.
Our original code uses `m` as an *http.ServeMux (or a *github.com/gorilla/mux.Router) and it looks like this: `m.HandleFunc(“/”, homeHandler)`
After applying the labeling code, it will look like this:
m.HandleFunc("/", func(w http.ResponseWriter, r *http.Request) {
    labels := pprof.Labels("path", r.RequestURI, "request", "real")
    pprof.Do(context.Background(), labels, func(_ context.Context) {
        homeHandler(w, r)
    })
})
This labels the goroutines that handle each of our HTTP requests, as shown below.
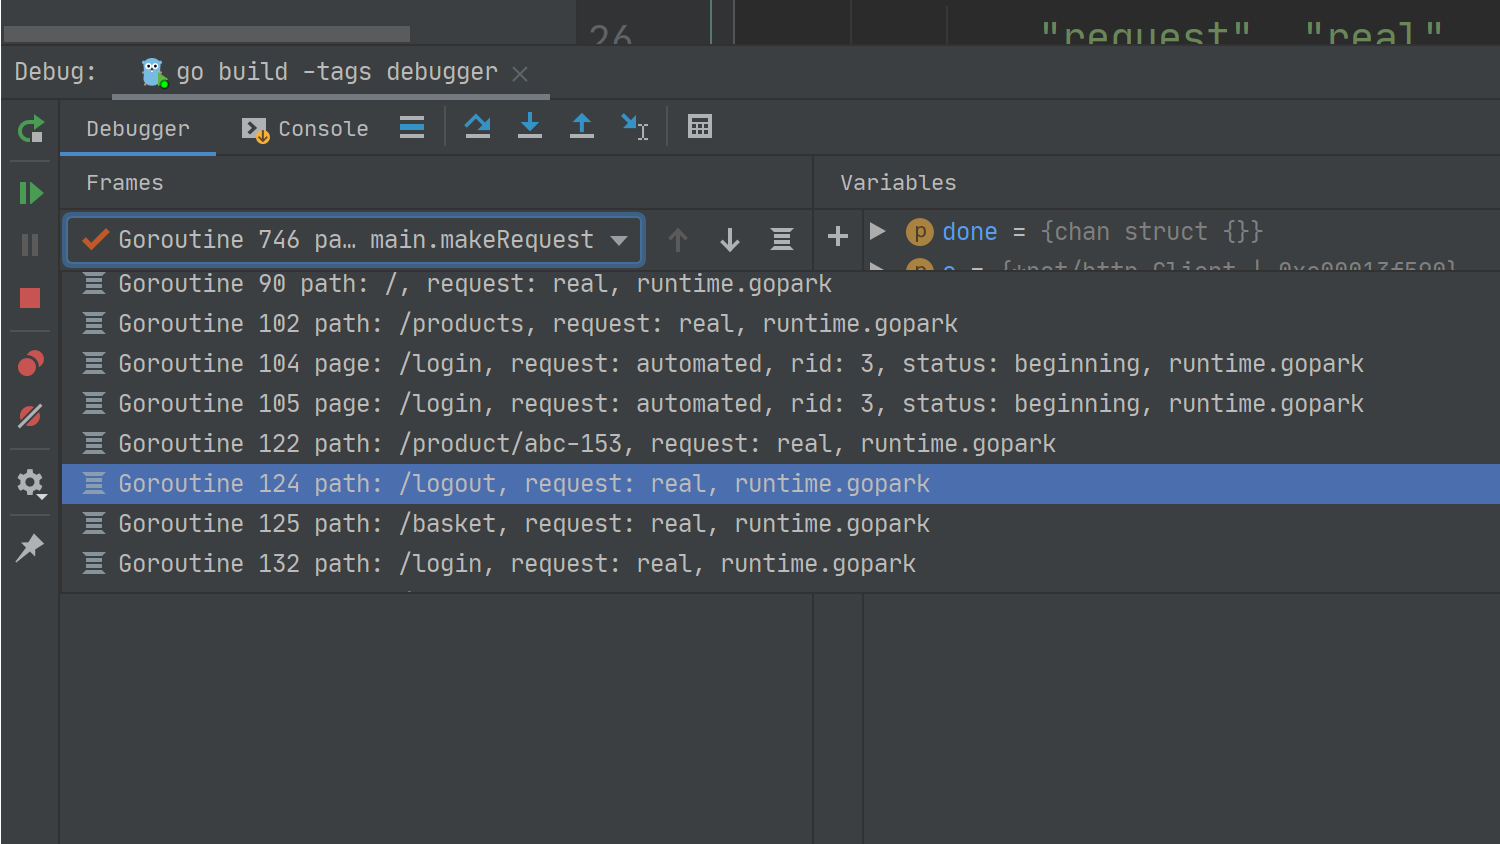
Since we have access to the request object, we can populate the labels with more complex data than in our example code.
Usage from the command line
If you are using Delve directly from the command line, then you need delve at revision 1867862 or newer. These changes will be included in the next release, at the moment this is not included in the current v1.4.0 release.
To see the labels, invoke the `goroutines -l` command during the debug session to see the same data as you’d have in the IDE.
Performance implications
The natural question that comes is: What about the performance implications of using the code like above?
The answer is yes, setting these labels does have a performance penalty. Generally, it’s a fairly minimal impact, but it will be there nonetheless, so it’s best to use some benchmarking code to test this on your own hardware.
Given this implication, then the next question occurs: If there are performance implications, it means that I’ll need to apply and undo the code every time I need to do some debugging. This will have an impact on my development speed, can this be done a bit better?
Using a custom library to enable debugging labeling
To answer the above question and allow our debugging code to be compiled without a performance impact, let’s use the github.com/dlsniper/debugger library and change our `makeRequest` code to include the following function call:
func makeRequest(done chan struct{}, c *http.Client, page string, i int64) {
    defer func() {
        // Unblock the next request from the queue
        <-done
    }()

    debugger.SetLabels(func() []string {
        return []string{
            "request", "automated",
            "page", page,
            "rid", strconv.Itoa(int(i)),
        }
    })
	// ..
}
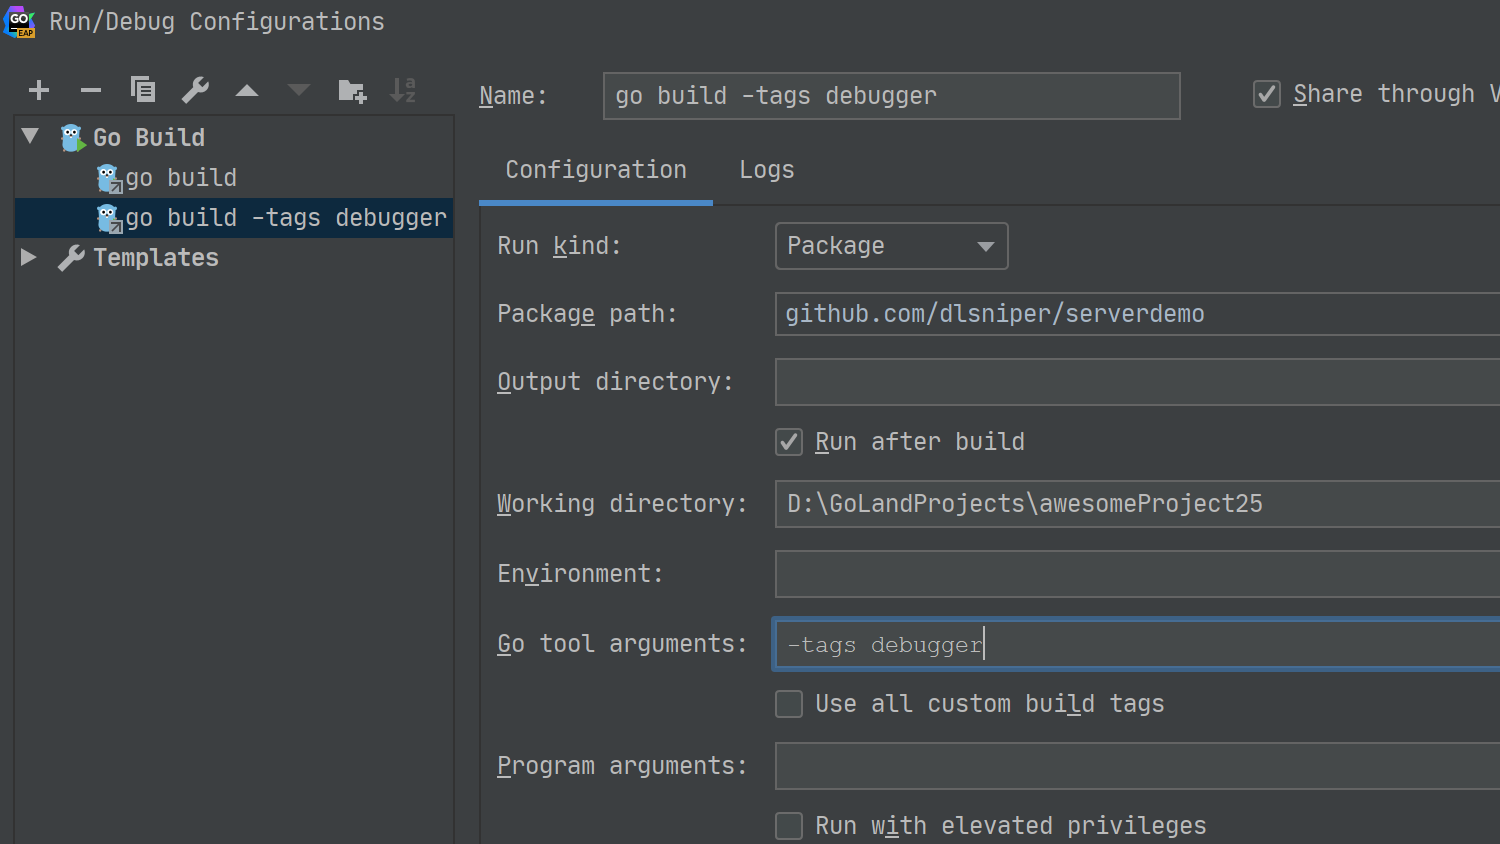
Before we can run this in the debugger, there’s one additional change we need to make. We need to add `-tags debugger` to the Go tool arguments field in the run configuration. Otherwise, the library will load the production code, which won’t have any effect.
The library shown here supports the standard http.HandlerFunc signature to enable easy usage in the existing applications.
Going back to our code that looks like this: `m.HandleFunc(“/”, homeHandler)`
To add labels to these handlers, we can change the code to look like this:
m.HandleFunc("/", debugger.Middleware(homeHandler, func(r *http.Request) []string {
    return []string{
        "request", "real",
        "path", r.RequestURI,
    }
}))
Pro tip:
Placing more calls for the debugger.SetLabels function in a single function or method makes it possible to track the execution progress more easily and filter out the data that you don’t need.
Pro tip:
Run configurations can be duplicated to make it possible to use the code both with and without the debugger build tag.
Note:
As seen above, setting the labels incurs some performance penalties. As such, only use the `-tags=debugger` built binaries in environments that are not performance-critical or make sure that the performance penalties are outweighed by the improvements to the debugging experience.
That’s it for today. We learned how to make our life a little easier when debugging complex Go applications using GoLand and adding labels to goroutines.
All the code in this post is available at github.com/dlsniper/debugger. The sample code for testing the library is available at github.com/dlsniper/serverdemo.
Let us know your thoughts in the comments section below, on our issue tracker, or on Twitter.
Subscribe to GoLang Blog updates