Debugger for JDK8’s Nashorn JavaScript in IntelliJ IDEA 13.1
Last Friday we announced the availability of IntellIJ IDEA 13.1 RC2, a new release candidate for IntelliJ IDEA 13.1 bringing final support for Java 8. In other awesome news, besides coding assistance for Java 8 the new build also provides a built-in debugger for JDK8’s Nashorn. Nashorn is the new lightweight high-performance JavaScript runtime built on top of JVM.
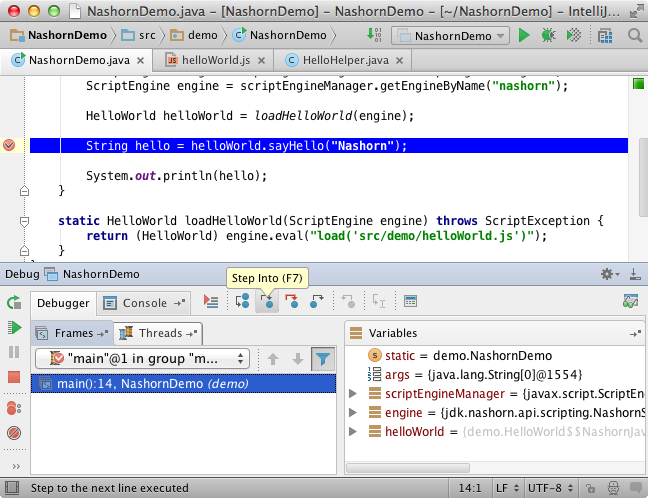
With IntelliJ IDEA 13.1 RC2, now you can add breakpoints to your Nashorn scripts and go through them when debugging your Java application. Let’s see how it works on a simple example. Here we have an application which loads a Java interface implementation from in a Nashorn script. The interface has a “sayHello” method with a single String parameter and returning a String.
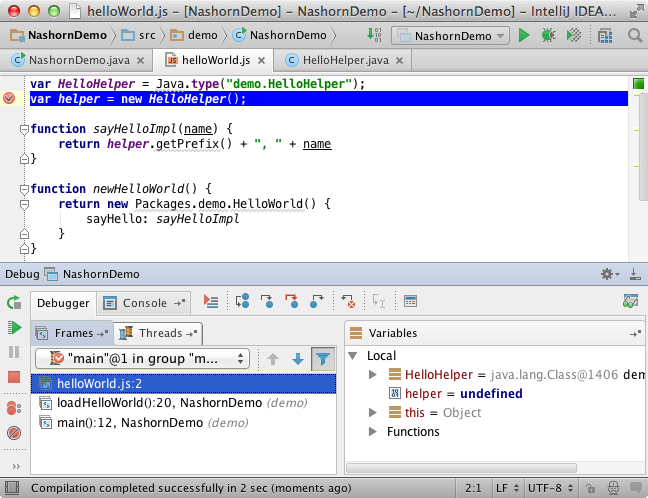
If we open the Nashorn script, we’ll see an almost regular JavaScript file. The only difference here is that this scripts accesses the Java runtime to instantiate an instance of the “demo.HelloHelper” Java class and to define an implementation for the “demo.HelloWorld” interface. Let’s add a breakpoint here to stop when the script is running.
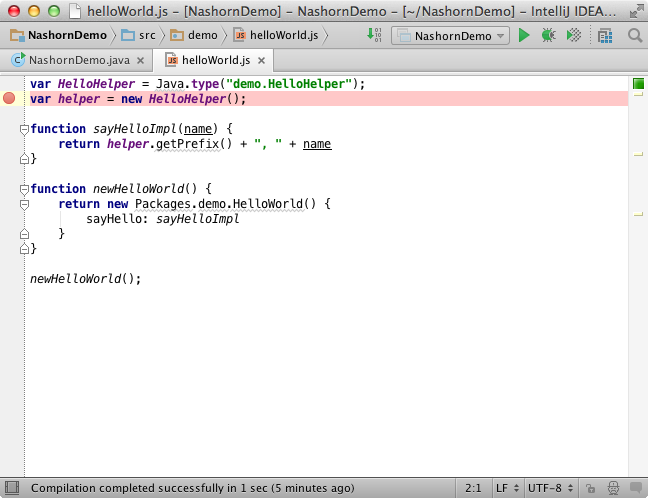
When we run the application in the Debug mode, it stops at our breakpoint so we can see the state of local variables and step through the script statements.
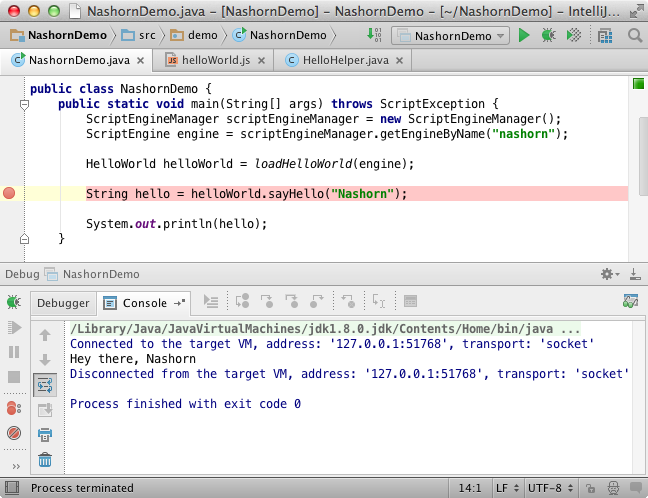
Then we stop at another breakpoint we added, but already on the Java side. Here we can see the state of the “demo.HelloWorld” instance, returned by the script.
Now if we call the Step Into action, we’ll be able to step inside the script.
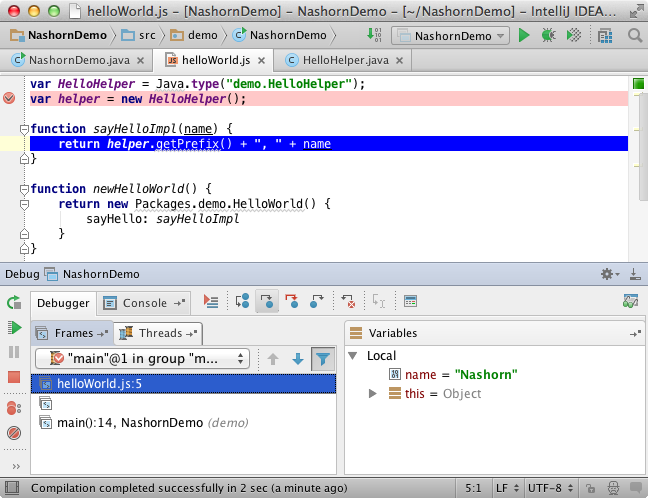
Note that here we use an instance of “demo.HelloHelper” Java class to get a “prefix.” This means that if we use the Step Into action again, we’ll get back to the Java side.
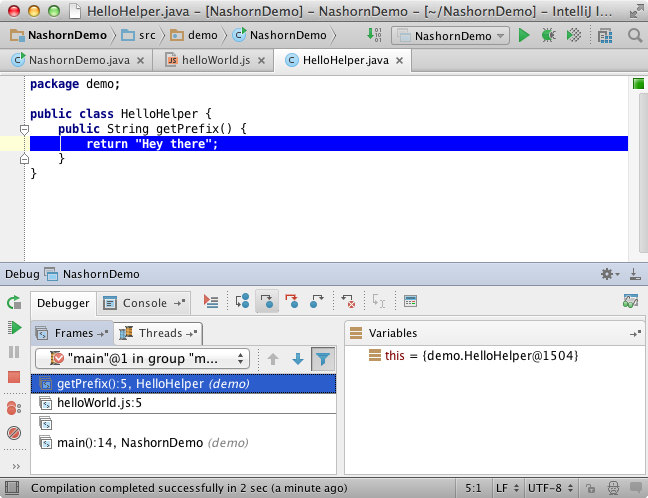
Also notice, that the Frames tab shows the exact stack of the invoked methods from both Java and Narshorn code.
As you can see, with IntelliJ IDEA it’s really easy to debug your Nashorn scripts. We’ll hope this feature will come useful for you as Nashorn is a very powerful tool for scripting your Java application.
As always your feedback is very welcome in our discussion forum and your bug reports in our issue tracker. Time’s limited though, as the release is just around the corner.
Develop with Pleasure!
Harry says:
March 19, 2014Hi Andrey,
I have upgraded my IntelliJ to 13.1. But not sure it’s the RC2 you mentioned above, could you please confirm?
I tried to sample codes here, which can’t pass the compile since class HelloWorld can not be located in Java code.
Please give some hints.
Thanks
Harry
Andrey Cheptsov says:
March 19, 2014It should work with 13.1. Can you share your code sample? You can send it to andrey.cheptsov at gmail.com.
Brad says:
March 27, 2014Had the same problem, the ‘HelloWorld’ interface isn’t show in the article:
public interface HelloWorld {
public String sayHello(String name);
}
Someone posted the same example to github here:
https://github.com/jbandi/Nashorn/tree/master/01-HelloNashorn
Sorin Postelnicu says:
June 12, 2017I have tried this github example in Intellij 2017 Ultimate, but the debugger does not step into the javascript file. Instead, the following is shown in the stacktrace (Frames): sayHello:-1, HelloWorld$$NashornJavaAdapter
Is this nashorn debugging still functioning in Intellij 2017?
fishgel says:
January 3, 2018I also can not debug.
Brad says:
March 27, 2014Also, just in case someone else tries this example in 13.1+, the JS debugger is only enabled in Ultimate Edition.
http://devnet.jetbrains.com/message/5512395
Arvind says:
March 27, 2014Kind of similar to the first issue. I have the ultimate 13.1 with Build#IU-135.475 built on March 17 2014. But I can’ step into the js file as shown in the screenshot. But the sample prints out the hello-world as shared by Brad.
Nirav says:
March 28, 2014Thanks Brad for pointing an important missing component.
John Hann says:
April 1, 2014Will Nashorn support be added to WebStorm, too? *crosses fingers*
Benjamin says:
April 3, 2014Nashorn debugging works great, but IDEA seems to ignore the nashorn javascript dialect. e.g. For Each statement is marked as error or Java.type is unrecognized.
Am I missing something?
Handong Wang says:
May 26, 2014I tried the steps and it works.
Does the debugging for Nashorn & JS code still work if I debug a Java application remotely? A typical case is my java code is running inside some kind of container.
Handong Wang says:
May 27, 2014the debugger stops at breakpoints in .js file, but does not stop at breakpoints in .ts files(typescript files). Does it support breakpoints in .ts file or I did something wrong?
Handong Wang says:
May 28, 2014I found an issue with the implementation:
I tested it on Windows, js-file-name can not be absolute path in engine.eval(“load(‘js-file-name’)”). Otherwise debugging does not work though the js code got executed.
Dmitry Serpakov says:
June 11, 2014Same problem appears on MacOS
Also the same issue found in multi module project even with relative path
Dmitry Serpakov says:
June 12, 2014Opened 2 issues
IDEA-126149 Nashorn debugging doesn’t work with absolute paths
IDEA-126148 Nashorn debugging doesn’t work with submodules
David Buccola says:
February 1, 2015Was there any resolution to this? I can get the debugger in a simple single module practice but the exact same program and javascript was not debuggable in a multi-module project. Without that it is useless.
Java 1.8 + JavaScript Engine Nashorn + Debugging javascript file - Umut's Weblog says:
July 25, 2014[…] is as just easy as debugging java files using IntelliJ IDEA 13.1. Here you can find here the IntelliJ blog for the debugging feature. The only point is that you suppose to use “nashorn” engine […]
Nick says:
October 27, 2014The two above issues basically make the nashorn debugging support completely useless. If you have a multi module project, and who doesn’t in more than a quick test project, doesn’t work at all =(
Richard Richter says:
November 13, 2014This feature is great, but what if I want to preload script as string and then eval this? I know exactly what file it is – is ther any way how to tell Idea so I can debug such eval?
Is it working only with load(…) command in eval or are there any other options?
David Buccola says:
February 2, 2015I encountered some of the same problems mentioned in the comments above. After some amount of experimentation, however, I was able to get things working satisfactorily. I wrote up some of my notes here:
David Buccola says:
February 2, 2015Oops. Previous post didn’t include the URL. Try this: http://davidbuccola.blogspot.com/2015/02/debugging-nashorn-javascript-with.html
Inshua says:
July 14, 2016cannot view object of js, object become nashorn JO, need do more for this feuture:
function f(){
var a =1;
var b = 2;
a ++;
b ++;
var c = {result: a+b}; // * become JO, in netbeans it’s {result:4.0}*
print( c);
}
f();
fishgel says:
January 3, 2018I have clone this project. https://github.com/winterbe/java8-tutorial/
And I want to debug the Nashorn JavaScript use the IntelliJ IDEA debugger. But it not working.
My work envinments as follows:
IntelliJ IDEA 2017.1.1
Build #IU-171.4073.35, built on April 7, 2017
Licensed to yudong ding
Subscription is active until April 20, 2018
For educational use only.
JRE: 1.8.0_112-release-736-b16 x86_64
JVM: OpenJDK 64-Bit Server VM by JetBrains s.r.o
Mac OS X 10.11.6
Andrey Dernov says:
January 4, 2018Make sure to mark `res` folder as a resource root: https://www.jetbrains.com/help/idea/configuring-projects.html#project_tool_window after opening the project.
Alexey Subach says:
January 14, 2018Hi, thanks for this great feature! Are sourcemaps also supported? I couldn’t find any example on debugging JS scripts with sourcemaps for Nashorn in IntelliJ.
Giridhar says:
August 27, 2018Is this supported in windows (Windows 7)?
I am able to debug in mac but not in windows.