IntelliJ IDEA
IntelliJ IDEA – the IDE for Professional Development in Java and Kotlin
Try Chronon Debugger with IntelliJ IDEA 13.1 EAP
Exciting news! The upcoming IntelliJ IDEA 13.1 will bring you integration with Chronon Debugger (via this plugin). You can try it right away with the latest preview build. In case you’re wondering, Chronon is a new revolutionary tool keeping track of running Java programs and recording their execution process for later analysis, which can be helpful when you need to thoroughly retrace your steps when dealing with complicated bugs.
Chronon is a commercial tool and normally you would need to buy a license to use it, but the awesome news for you is that it’s completely free to use with IntelliJ IDEA 13.1 Ultimate.
In this post I will give you a quick intro into how Chronon works and how you can use it with IntelliJ IDEA 13.1 EAP.
Install Plugin
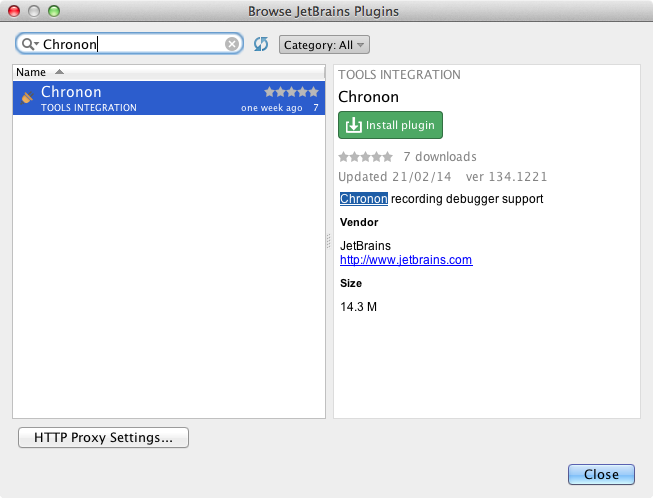
To enable Chronon, you need to go to Settings → Plugins → Install JetBrains plugin, select Chronon, and click Install plugin.
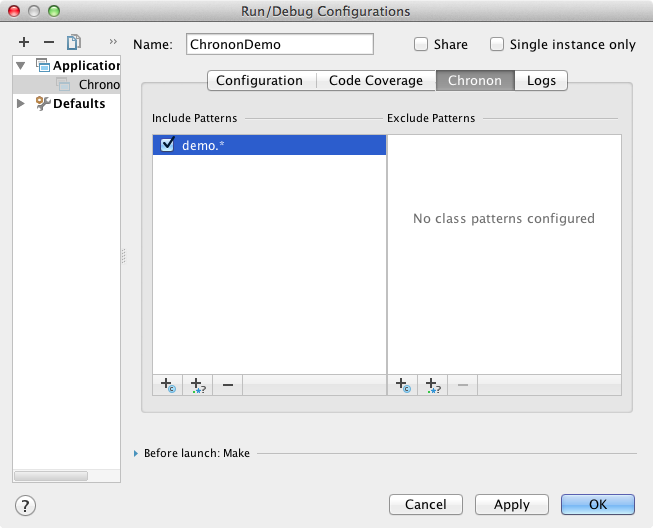
Chronon Include/Exclude Patterns
Chronon uses code instrumentation to record the data, so we need to tell it which classes it should look at. For that, open the run configuration that you’re using for your application and specify Include / Exclude Patterns on the Chronon tab. Choose the classes carefully, because tracking too many of them at the same time would have significant negative performance impact.
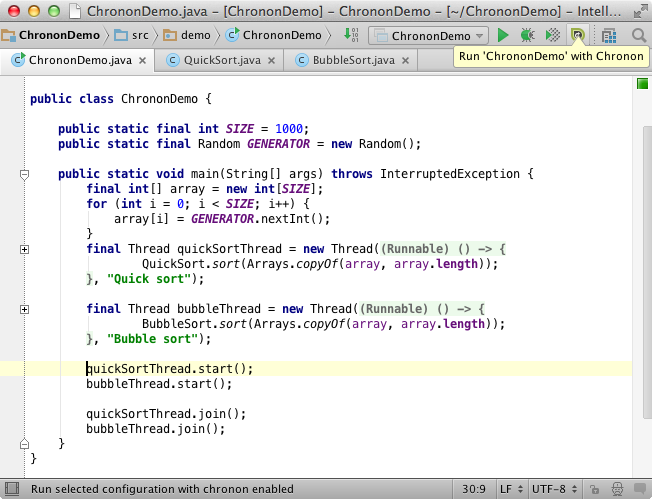
Let’s see how Chronon works on a simple example of the two-threaded array sorting, where one thread performs quicksort, and the other one does bubble sorting. It’s essential to understand that Chronon is not literally a debugger, as it only helps you record the execution progress and then, play it back, like a videotape.
Run with Chronon
Well, it’s time to run our app. For that we can either click the toolbar button or use the Run → Run ‘ChrononDemo’ with Chronon menu.
When the app finishes, IntelliJ IDEA unpacks the recording data and opens the Chronon tool window (which looks very similar that of Debugger.) Of course, you can open a previously recorded session and play it back via the Run → Open Chronon Recording action in the main menu.
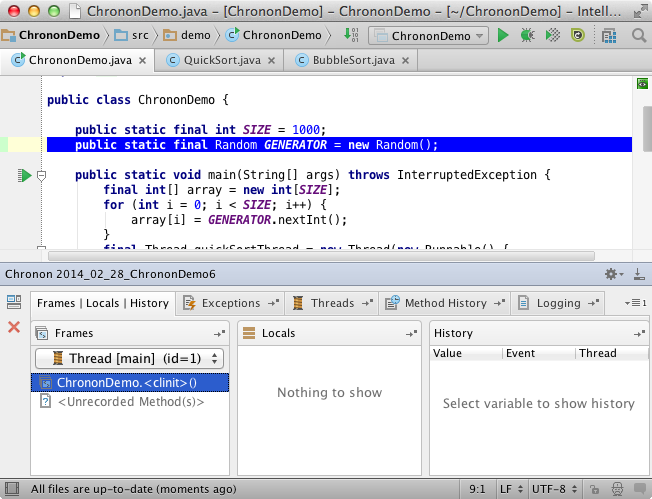
Debug actions
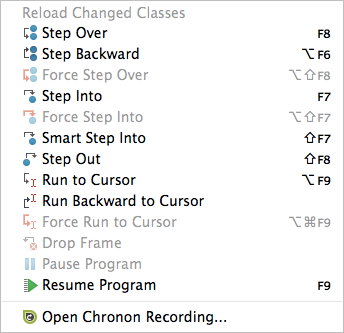
Here we can step through the recorded data forward or backward by using the actions from the Run menu.
Variable history
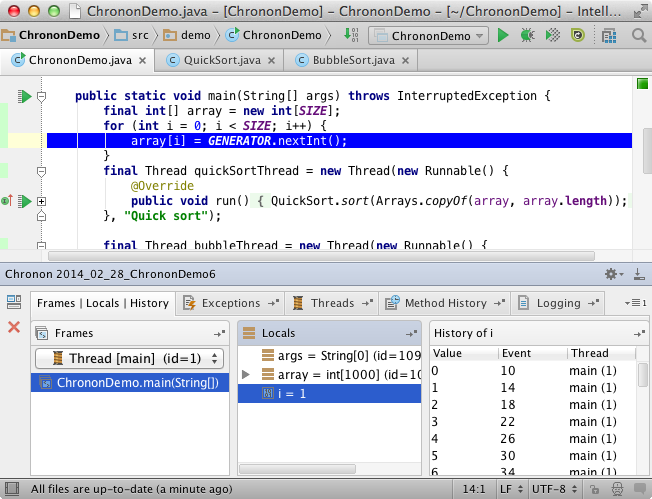
As the current position changes, the Locals tab displays values of local variables. If you select a local variable, the History tab displays the entire history of changes made to that variable during the recorded runtime. Note that the variables data is only shown for the primitives types and the classes specified in the Include Pattern.
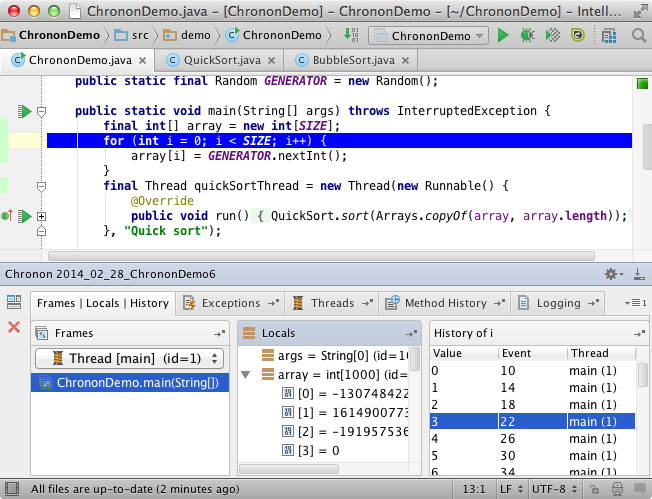
Double-clicking a change in the History tab will take you to the code where it has occurred.
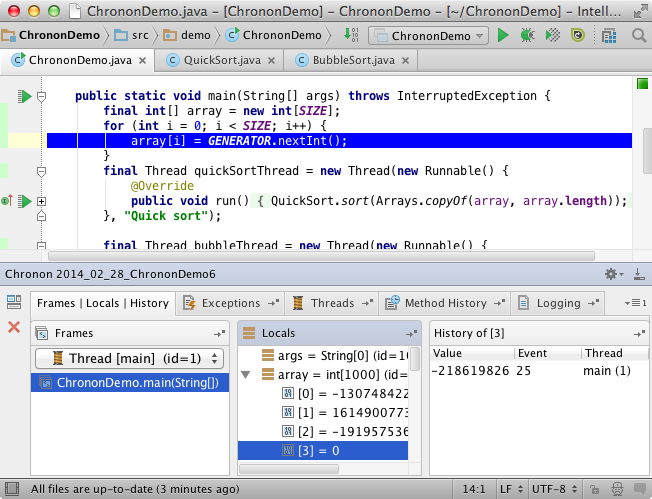
History of changes is available for elements of local arrays and collections as well.
Switch between threads
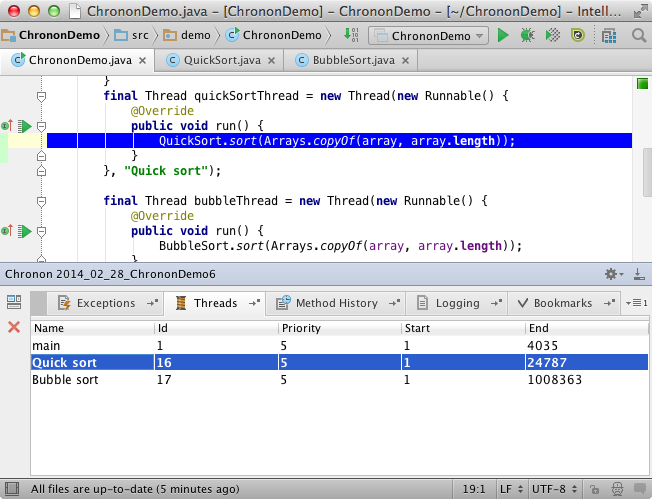
The Threads tab lets you switch between different threads that have been recorded.
Method history
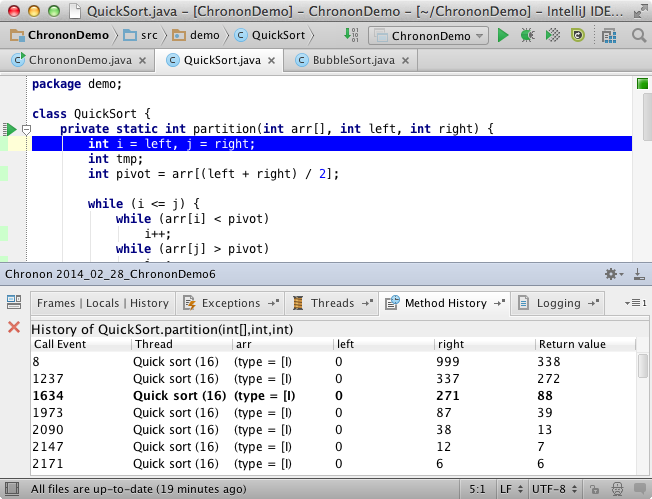
One of the tabs in the Chronon tool window is the Method history. In it you can track the execution history of a method, with the input and output data, which makes it easy to see how and where a method has been invoked.
Logging
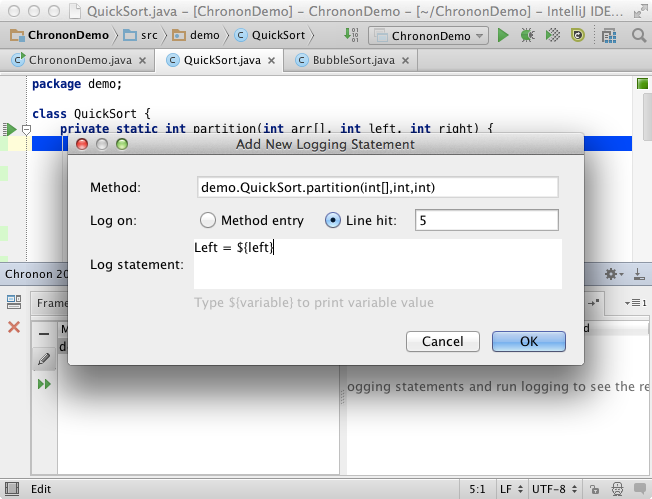
The Logging tab lets you define custom logging statements and track their output during the program execution.
Exceptions
Chronon is especially helpful when debugging failed tests. The Exceptions tab displays all recorded exceptions and you can double-click them to see a playback of how and when they occurred.
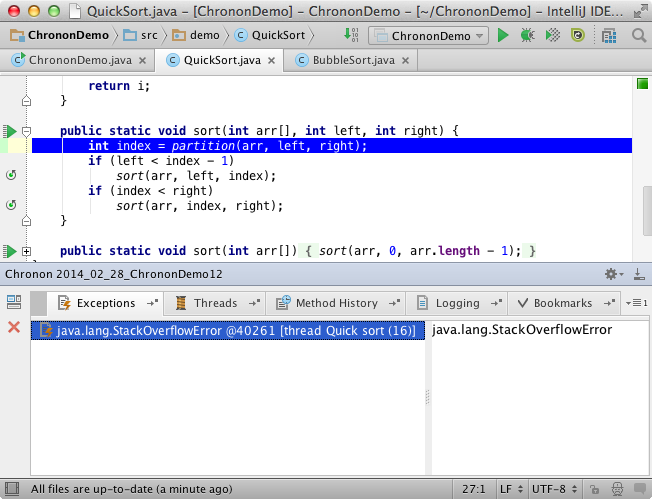
By the way, this is exactly what we’re doing to investigate problems that are otherwise very hard to reproduce when tests fail on our Teamcity build server. TeamCity uses Chronon to run tests so we can use its recordings at any time to examine problems and spot bugs.
We hope you’ll find Chronon helpful, and as always, are waiting for your feedback in our discussion forum and issue tracker.
Develop with Pleasure!
Subscribe to IntelliJ IDEA Blog updates


