IntelliJ IDEA
IntelliJ IDEA – the Leading IDE for Professional Development in Java and Kotlin
IntelliJ IDEA 2017.3: Debugger Improvements

As usual, the latest release of IntelliJ IDEA comes with improvements to help with debugging applications.
New Overhead Tab
Debugging an application comes with an inevitable cost. While we may know this, it’s not always obvious what this might be. IntelliJ IDEA 2017.3 comes with a way to visualize this cost. There’s now a new tab, Overhead, which gives a view of the cost of debugging. If you don’t see this in the Debugger Tool Window, you may need to click the “Restore Overhead View” button:
As you can see, this window shows how much time was spent stepping over code, or rendering values with custom Type Renderers in watches and variables. Seeing this overhead may help you to understand the difference in behavior between running and debugging your application, and will help you reduce unnecessary performance costs when debugging.
On-Demand Data Renderers
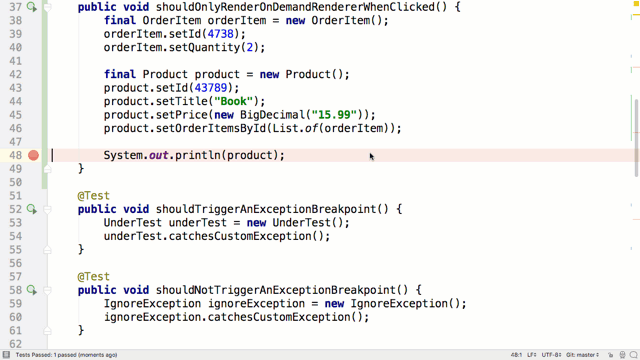
Given that using Type Renderers can be a source of overhead while debugging, there’s a new feature that can reduce or eliminate this cost. By using on-demand data renderers, the value for the type will only be calculated when the watch or variable is clicked on rather than being evaluated automatically all the time.
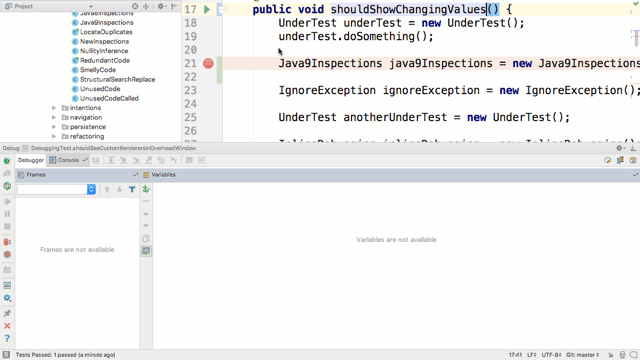
In the GIF below, you can see the Product renderer takes quite a lot of time (relatively speaking). If you set this to “On Demand” in Settings | Build, Execution, Deployment | Debugger | Data Views | Java Type Renderers, the renderer will not be used automatically; only clicking on that value in the Variables view will trigger the renderer.
Alternatively, you can turn off all the type renderers by right clicking and selecting Mute Renderers.
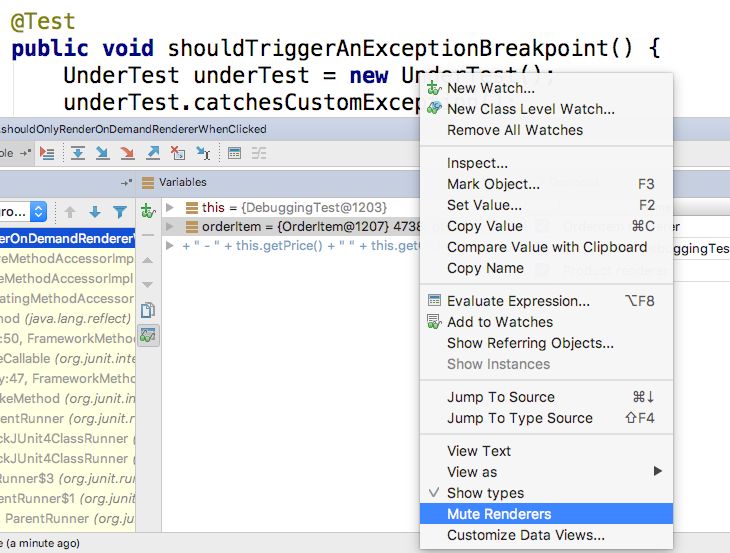
This persists between debug sessions, so when you want to turn them back on again all you have to do is right click again and untick Mute Renderers.
Stream Debugger
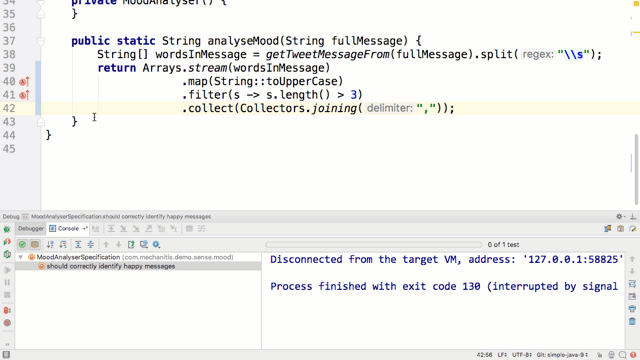
IntelliJ IDEA 2017.2 had a separate plugin to help you see what was going on in Java 8 Stream operations. This functionality is now bundled in IntelliJ IDEA 2017.3 and available by default from the debug window.
This tool is a really useful way to understand which operations are happening and how it impacts the data being processed.
Click here to learn more about the Java Stream Debugger.
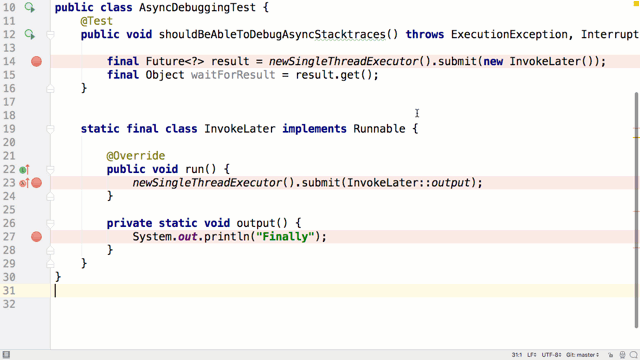
Async Stacktraces
IntelliJ IDEA 2017.3 has improved functionality for debugging asynchronous code via the introduction of a new Instrumenting Agent. This is enabled by default:
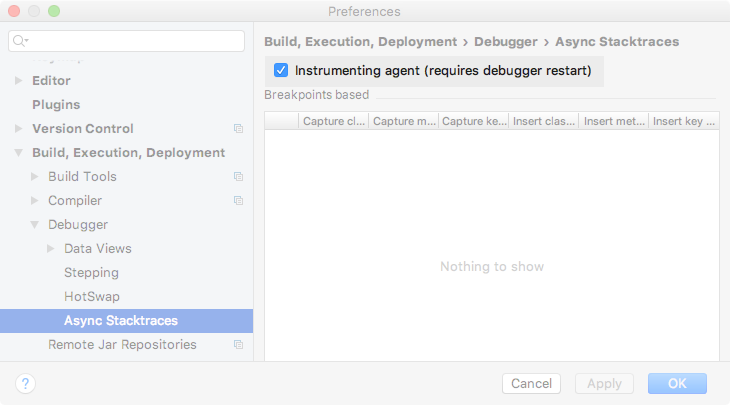
This makes debugging asynchronous code easier and reduces the overhead.
For more information about this feature, check out the JVM debugger section of this blog post.
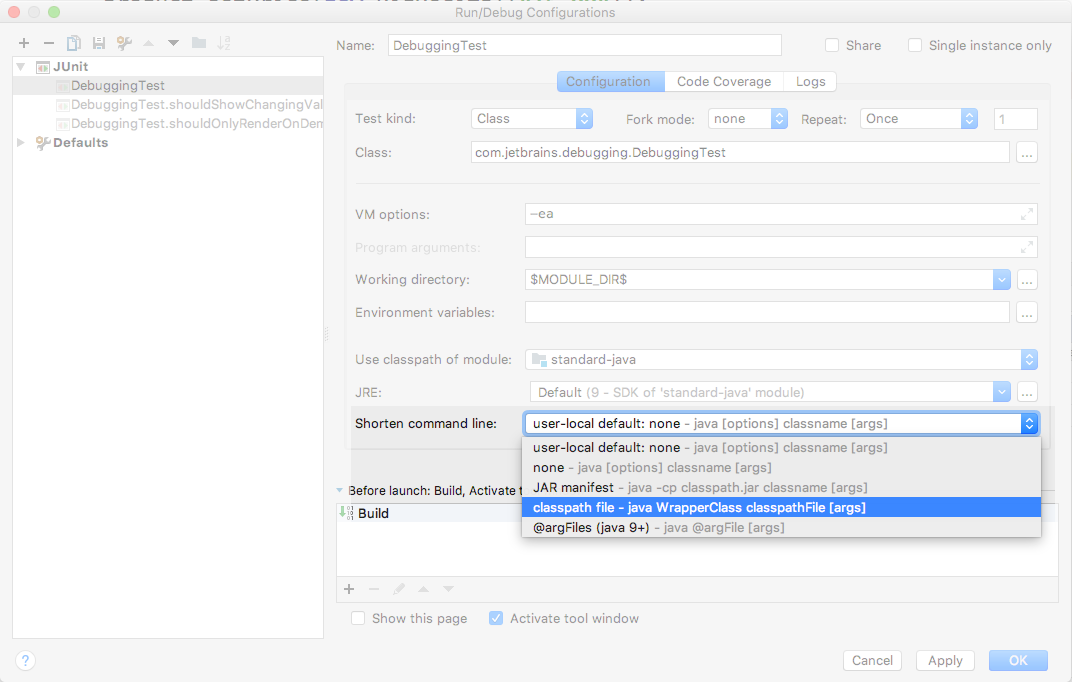
Configurable Command Line Shortener
IntelliJ IDEA has a number of different ways to shorten the command line used to run or debug your application if you have a very long classpath or a lot of VM arguments. In IntelliJ IDEA 2017.3, we’ve made these options available for the user to choose according to the specific requirements of their application.
Read this blog post for more detailed information on this feature.
So you can see there’s a whole range of new and updated features in IntelliJ IDEA 2017.3 which make debugging easier, faster, and help you visualize more of what’s happening inside your application.