IntelliJ IDEA
IntelliJ IDEA – the Leading IDE for Professional Development in Java and Kotlin
IntelliJ IDEA 2019.2 EAP 4: Profiling Tools, Structural Search Preview, and More
The new EAP build for the upcoming IntelliJ IDEA 2019.2 is here! Download it right now from the website or update to it using the Toolbox App.
Check out the previous EAP blog posts to learn about the other cool new features that the next major update v2019.2 will have for you!
Profiling Tools
We have exciting news to share – you can now analyze the performance of your application right inside your IDE, as the upcoming IntelliJ IDEA 2019.2 will have CPU Profiler integration and Memory Profiler integration on macOS, Linux, and Windows!
IntelliJ IDEA 2019.2 will integrate Java Flight Recorder on Windows, macOS, and Linux. On macOS and Linux, but not Windows, the IDE will also have integration with Async profiler – a low-overhead sampling profiler that shows you the native parts of the execution stack.
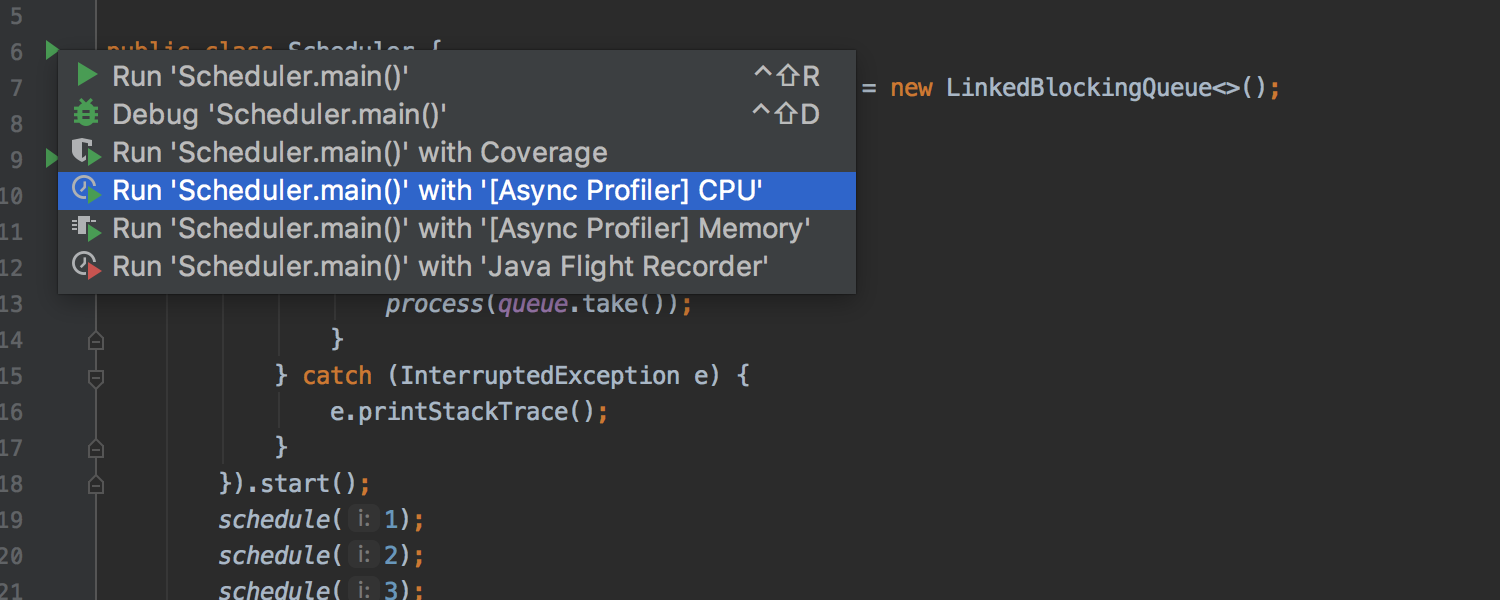
This should be very helpful to understand how the CPU and memory resources are allocated in your application. You can run Java Flight Recorder or Async profiler by clicking the icon on the main toolbar or the run icon in the gutter.
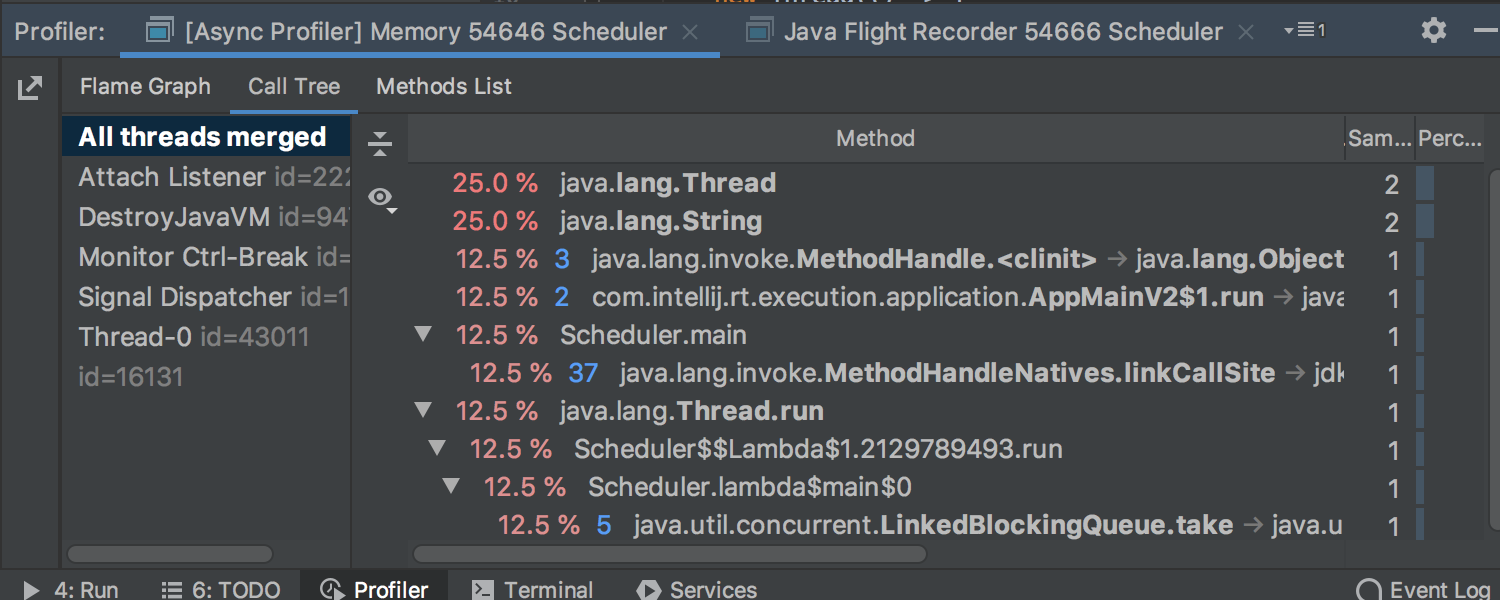
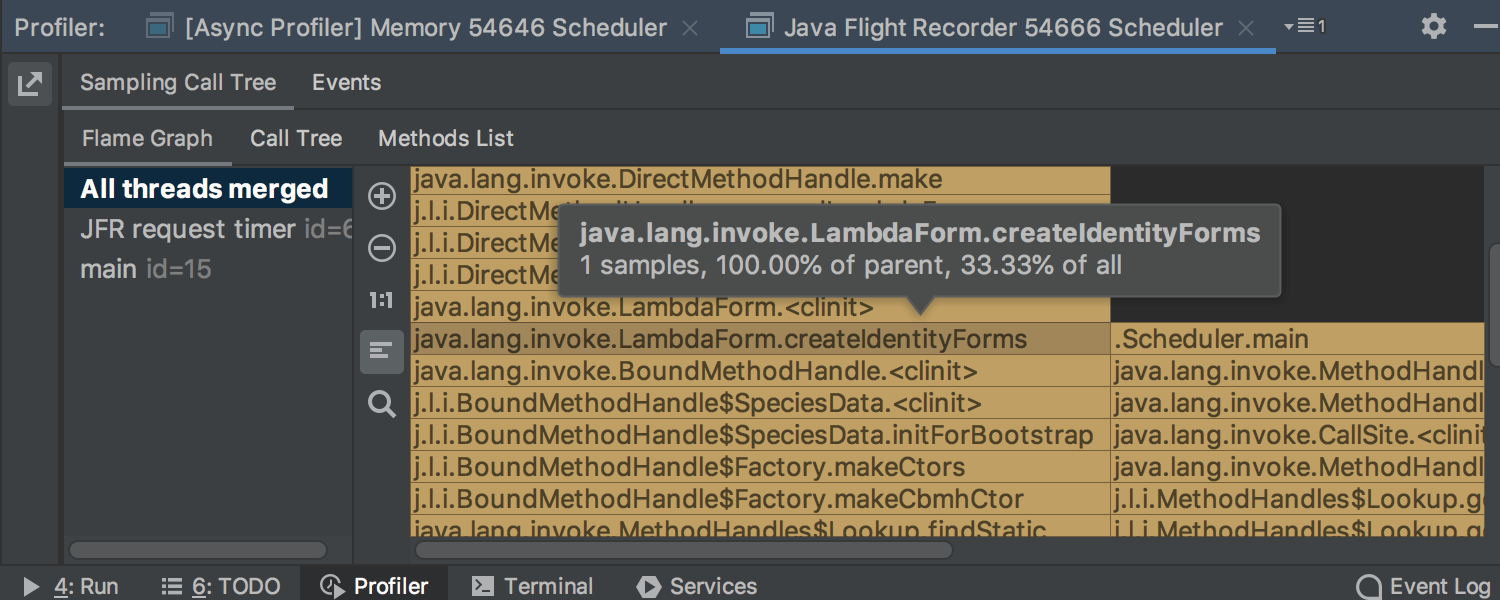
After the profiling data is collected, you will see a confirmation popup to navigate to the Profiler tool window, where the output data will be presented as a Flame Chart, Call Tree, or Method List. Look around, find some performance issues, and when you’re ready, return from the tabs back to the source code by using the Jump to Source context action.
While using the tabs of the Profiler tool window, you can use a speed search. In the Flame Chart specifically, you can focus on any method by simply double-clicking it, and you can scroll to resize the chart.
Just a heads up: these Profiling Tools will only be supported in IntelliJ IDEA Ultimate.
Syntax highlighting for over 20 different programming languages
The upcoming IntelliJ IDEA 2019.2 will provide out-of-the-box syntax highlighting for over 20 different languages, such as Lua and Сlojure.
There will be no need to install a plugin to get proper syntax highlighting for code which is written in a language that you rarely use. This syntax highlighting is made possible thanks to the built-in integration with the TextMate text editor, along with a collection of built-in grammar files for various languages. The full list of supported languages can be found in Preferences / Settings | Editor | TextMate Bundles.
If you need to add syntax highlighting for any additional languages, download the TextMate bundle for the selected language and import it into IntelliJ IDEA.
Structural Search Preview
Structural search is a powerful feature that allows you to search for a specific code pattern in your project. Structural Search can be especially useful when you are searching through a really large project, as a simple search may find too many occurrences. Although sometimes when you perform a structural search, it can be tricky to create a good search pattern.
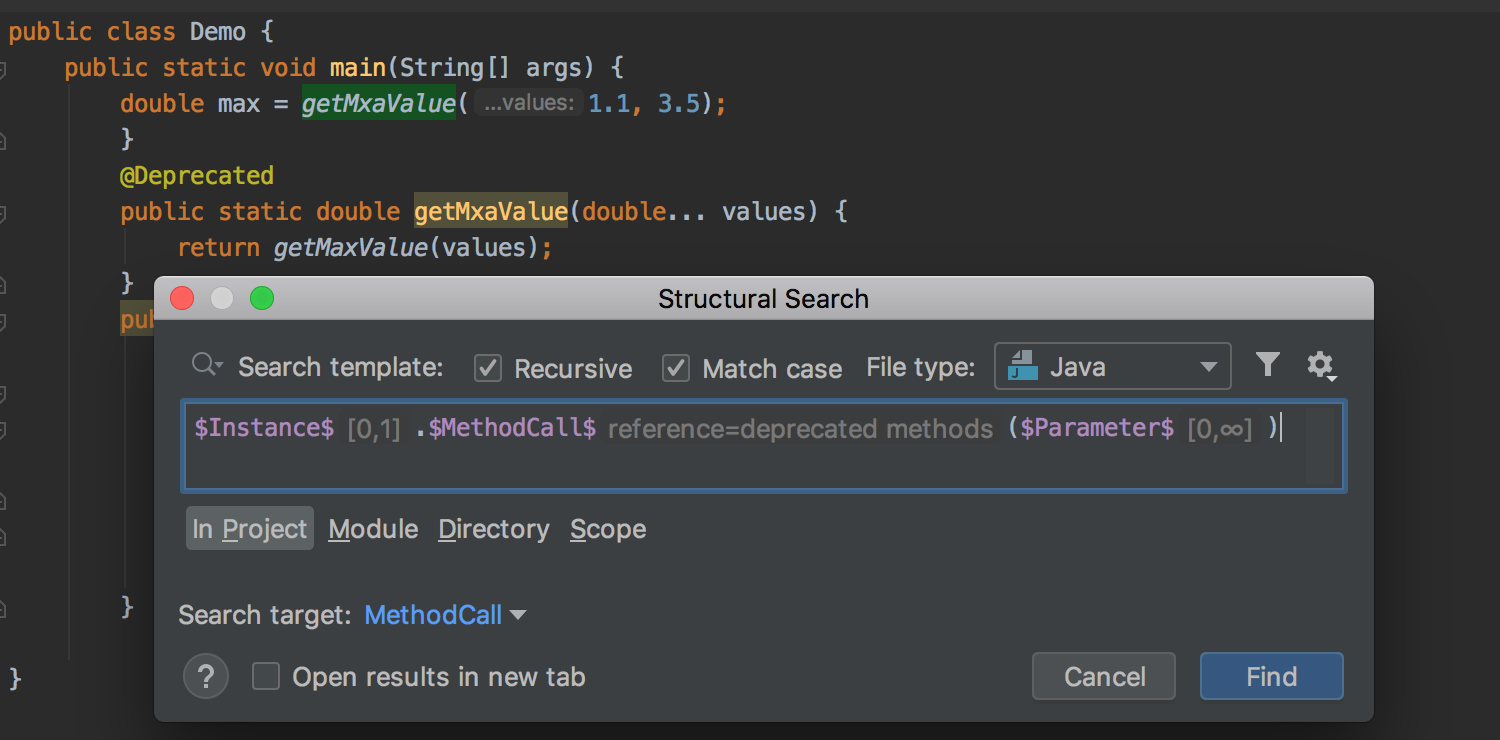
The upcoming IntelliJ IDEA 2019.2 will come with a welcome change – now the IDE will instantly highlight the found occurrences of your structural search in the editor. There is no more any need to run a modified pattern again and again while you are experimenting with your search pattern.
Now the IDE will display the values of the filters right in the editor area of the Structural Search dialog. Previously, the filters were shown in the tooltips, so you were required to hover over the variable to see it, and it was only possible to view one filter value at a time.
Update Info after Update Project action is shown as Log tab
Previously, after using the Update Project and Pull actions, the IDE would show a tree of updated files in the Update Info tab of the Version Control tool window.
In v2019.2, the Update Info will be displayed as a list of commits, which were received during the update. The Update Info tab now looks like the Log tab.
Improved Compare Branches action
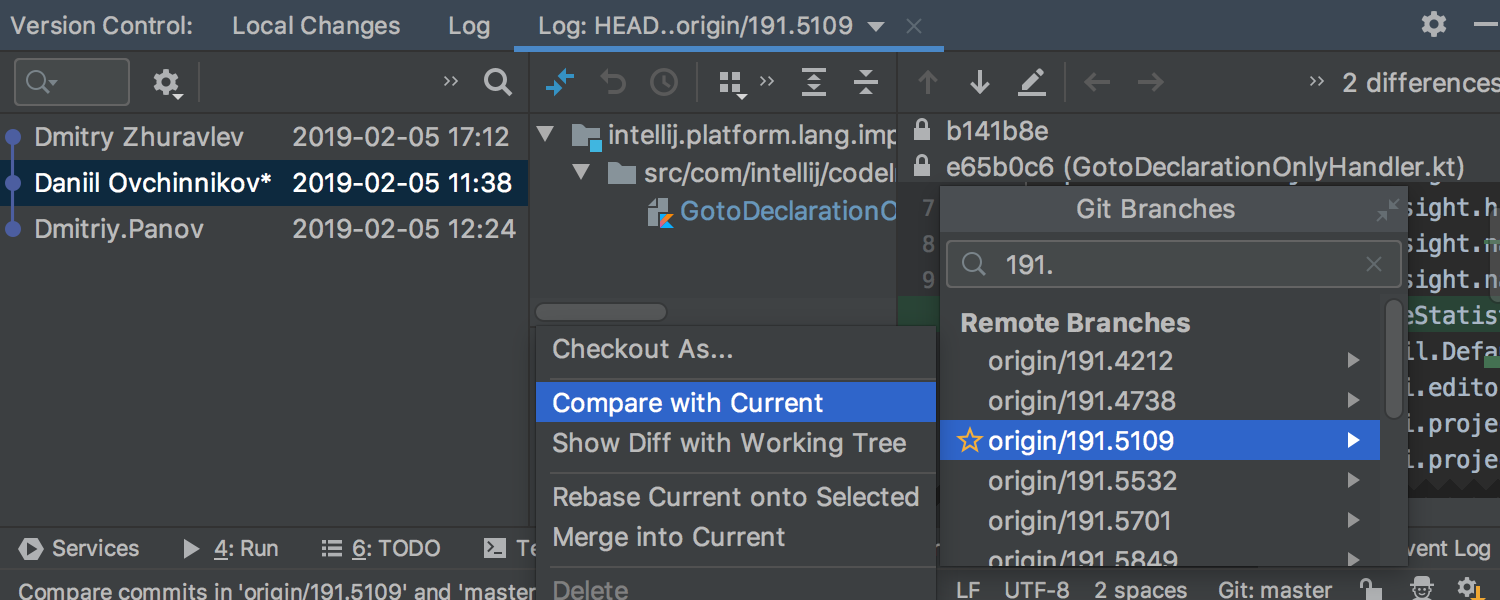
When you compare two Git branches with each other using the ‘Compare with Current’ action from the Git Branches popup menu, the IDE will display a Log tab which will list all commits that exist in one branch and do not exist in the other.
Show Diff with Working Tree action
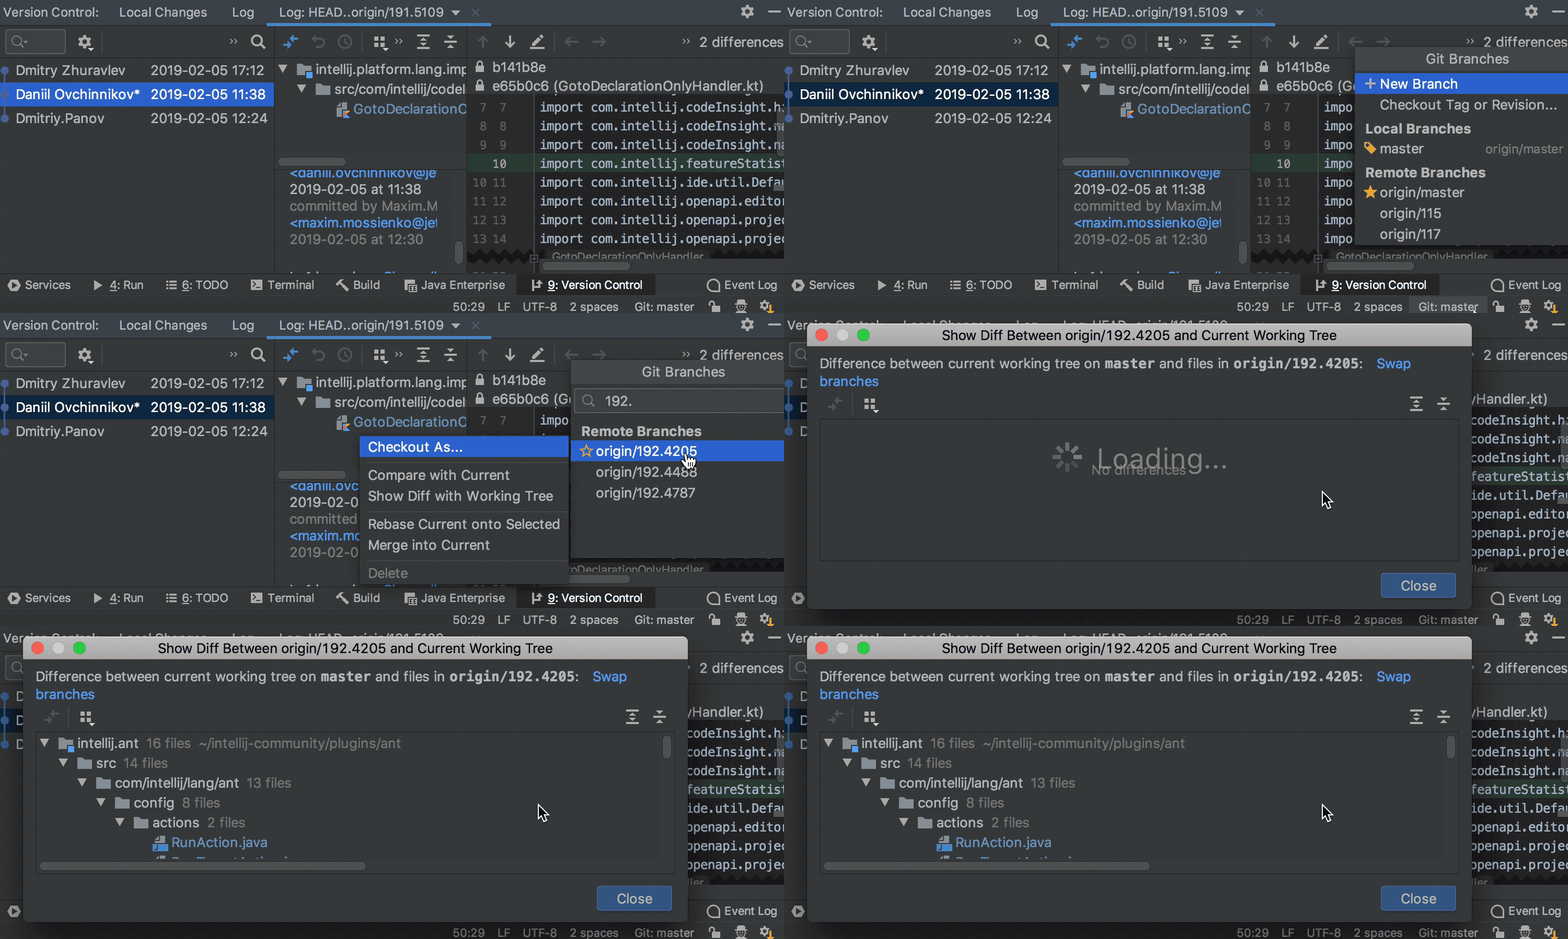
One more improvement in this area is that we’re adding a separate action called “Show Diff with Working Tree” to the Git Branches popup to provide you with the ability to view the Diff between the current and selected branches.
Shell Script Run Configuration
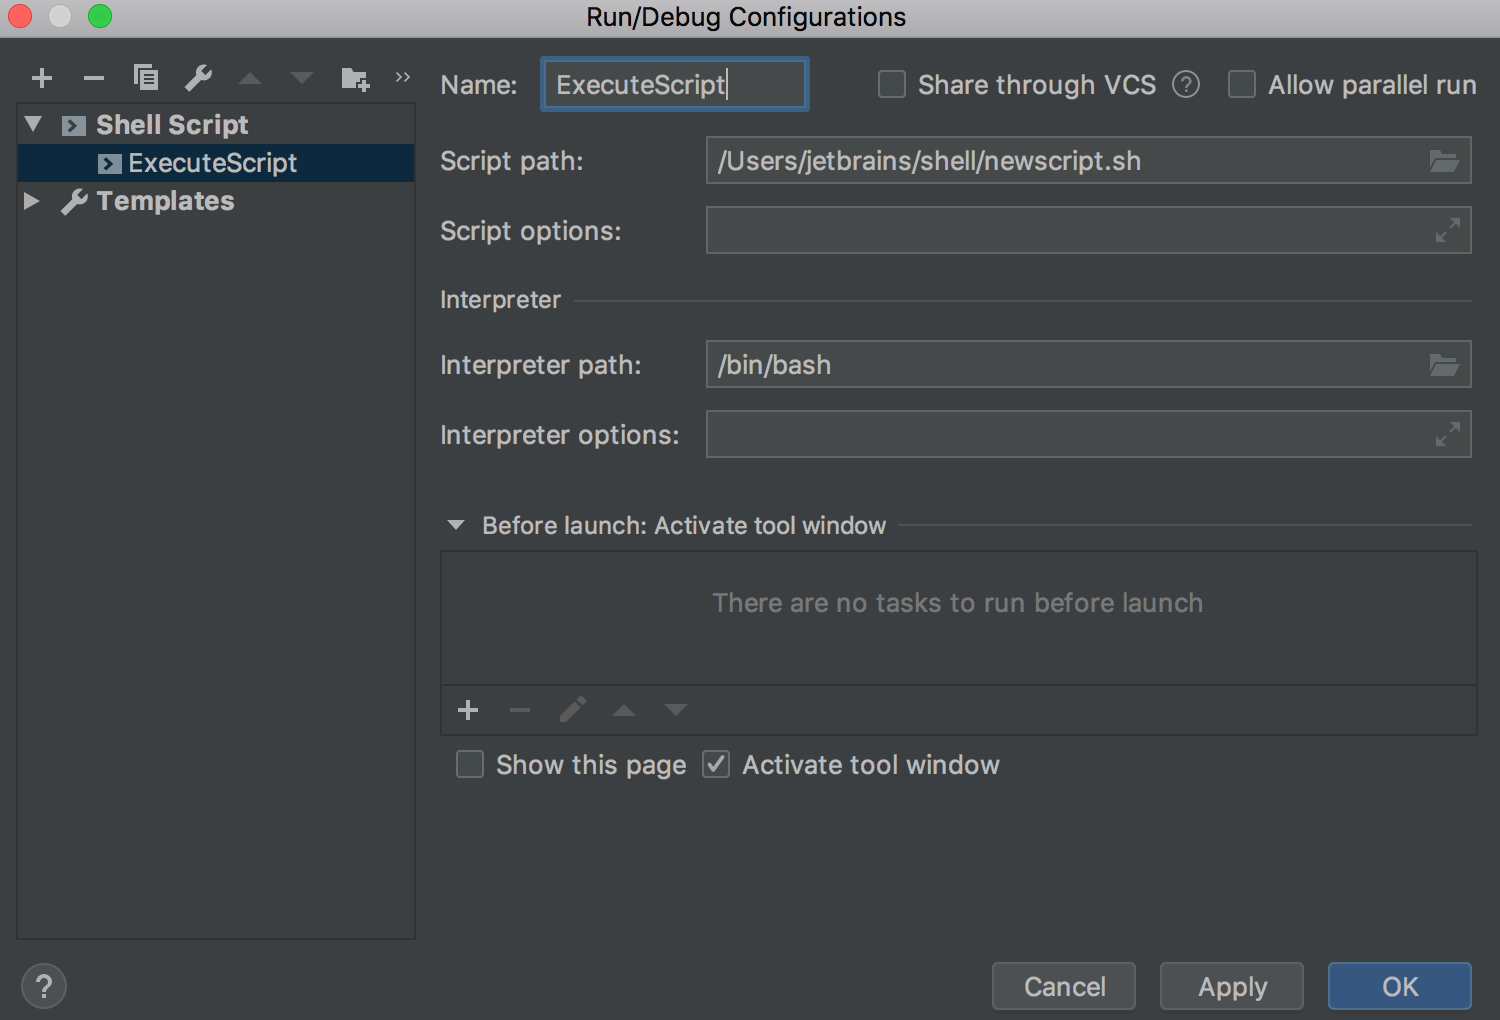
The upcoming IntelliJ IDEA 2019.2 will come with Shell Script support. With this new EAP build, we have enhanced this support even further, so now you will be able to create a Run Configuration to execute a script.
Maven
We’ve updated the bundled Maven version to 3.6.1.
JetBrains Runtime
JBR 11 (default) was updated to v11.0.3+12-b304.2:
- Font discovery and loading were improved by bundling the required fonts: JBR-1399.
- Robot screen capturing was repaired for screens with a scale other than 1:1: JBR-1544.
- Screen bounds in the full-screen mode were fixed on Windows: JBR-1552.
- Transparent title bars were repaired: JBR-1569.
- The issue with the unresponsive keyboard on Ubuntu 18 was fixed: JBR-1573.
JBR 8 was updated to 1.8.0_212-release-1586-b2:
- The fix for the persistent IDE crashes related to menu activities was backported to JBR-8 JBR-1400.
- Font discovery and loading were improved by bundling the required fonts: JBR-1399.
- Screen bounds in the full-screen mode were fixed on Windows: JBR-1552.
For the full list of changes please see the IDE and JBR 11 release notes (or JBR 8 release notes).
Please don’t forget to share your feedback with us by leaving a comment below, creating an issue in our issue tracker, or tweeting us!
Happy Developing!

