IntelliJ IDEA
IntelliJ IDEA – the Leading IDE for Professional Development in Java and Kotlin
Working with code problems in IntelliJ IDEA

One of the most important features of IntelliJ IDEA is its ability to quickly understand problems with your code and to suggest fixes for them. In IntelliJ IDEA 2020.2, we decided to focus on this feature, introducing several changes to simplify working with problems in your code. Our main goal was to make it easier for you to view all the problems at once and to navigate between them.
Inspections widget
Previously, problems in the current file were shown with a single icon in the upper right-hand corner of the editor. It was unclear how to navigate through the problems, however, and the icon was uninformative and hard to see.
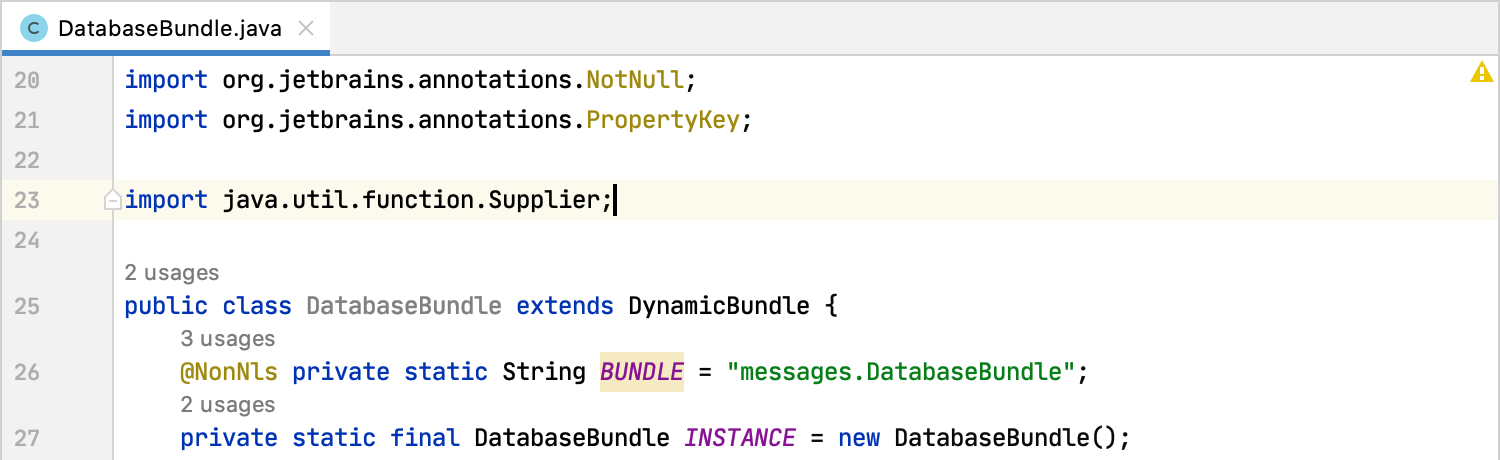
In IntelliJ IDEA 2020.2, we’ve replaced the old icon with the Inspections widget. It provides detailed information about warnings, errors, and other problems in the current file.
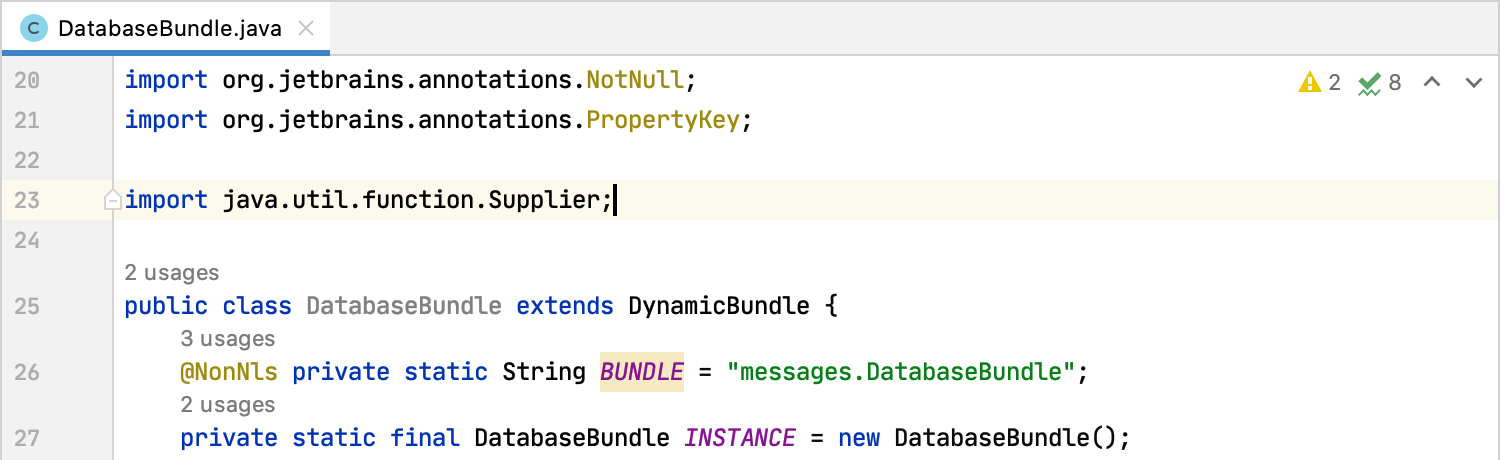
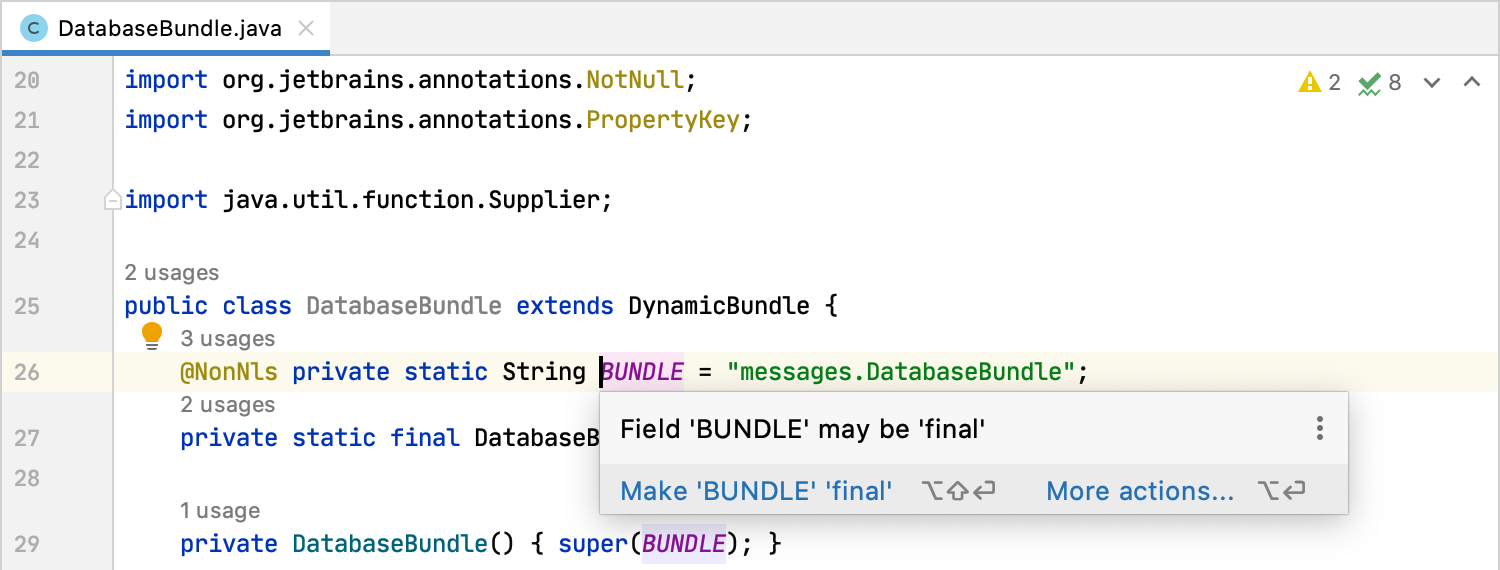
The Inspections widget allows you to navigate through the problems in your file using the arrow icons. You can also use the F2 and ⇧F2 shortcuts, and then press Alt+Enter to see the available fixes.
If code analysis is in progress, the icons are either replaced with the analysis progress text or dimmed out.
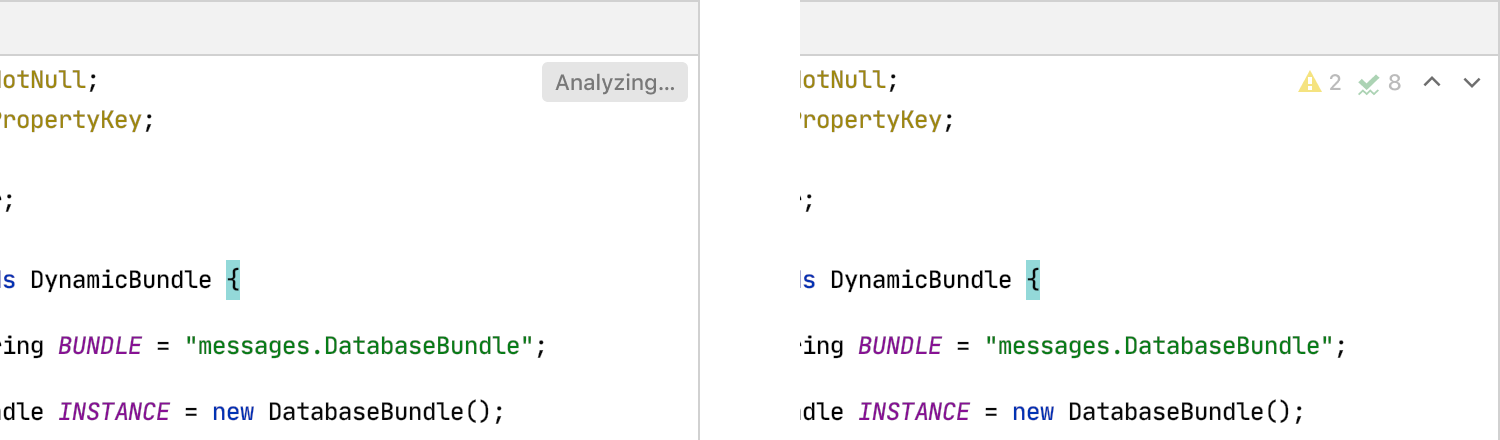
Hover over the widget to see detailed information about the current state of the analysis process and about the problems that have been found.

If you’re in the process of writing new code and warnings are not that important to you at the moment, you can change the highlighting level to Syntax. This way, warnings won’t distract you. To make this change, hover over the Inspections widget and use the link at the bottom of the popup to change the highlighting level to Syntax or None.
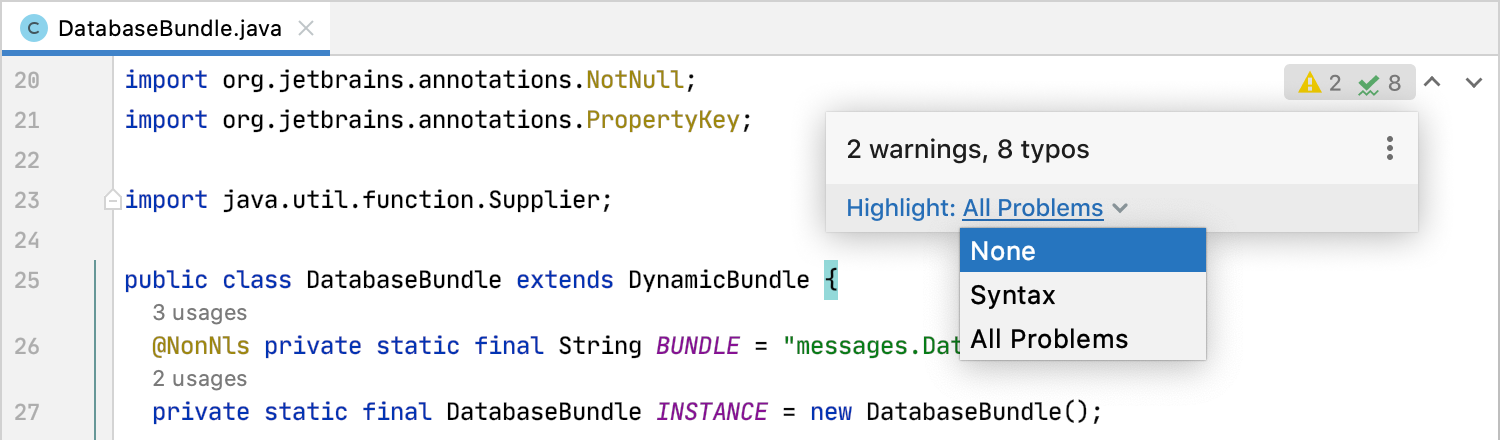
Just be sure to change the highlighting level back to All Problems when the time comes for you to polish your code.
Related problems
Starting from version 2020.2, IntelliJ IDEA shows problems that occur in other files as a result of changes made in the file you are currently working on.
If you’ve changed a non-private part of class API in some way – for example, by renaming a public field or updating the number of parameters in a package-private method signature – IntelliJ IDEA will analyze files related to that change and will notify you of any problems it finds with an inlay hint.
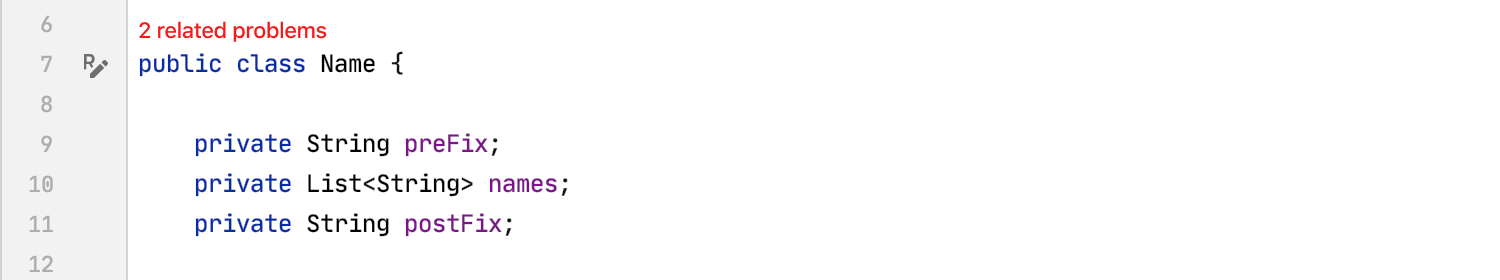
You can click on the hint or use an action from the Alt+Enter menu to see the full list of related problems in the Find tool window. Currently, this feature works only for Java.
Problems tool window
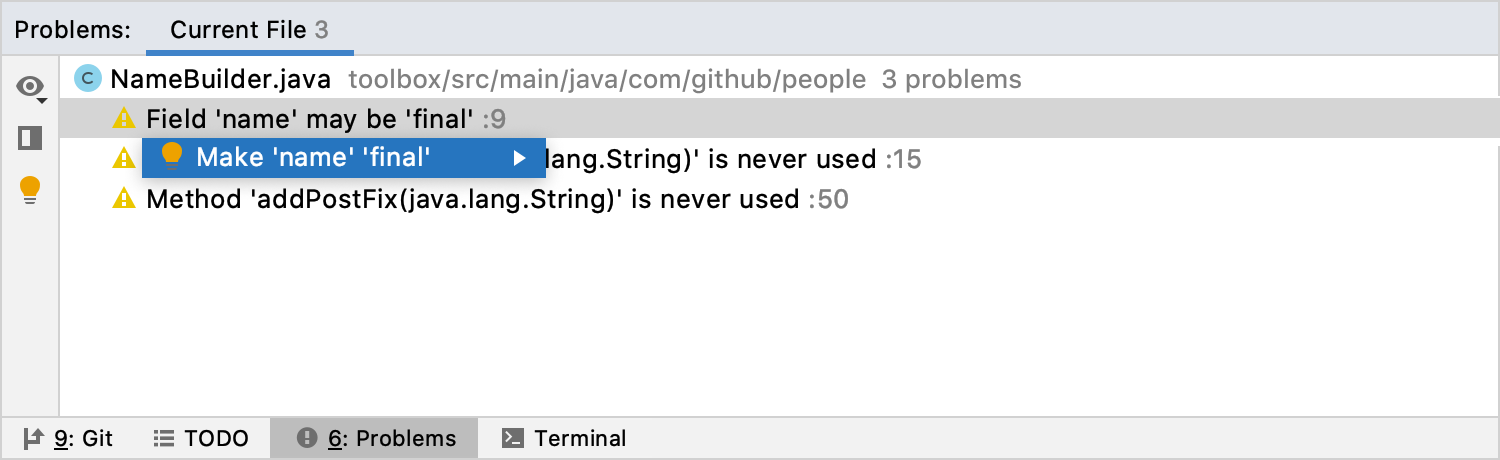
We’ve introduced a new Problems tool window. Click on the Inspections widget in the editor or use the Ctrl/Cmd+6 shortcut to open it.
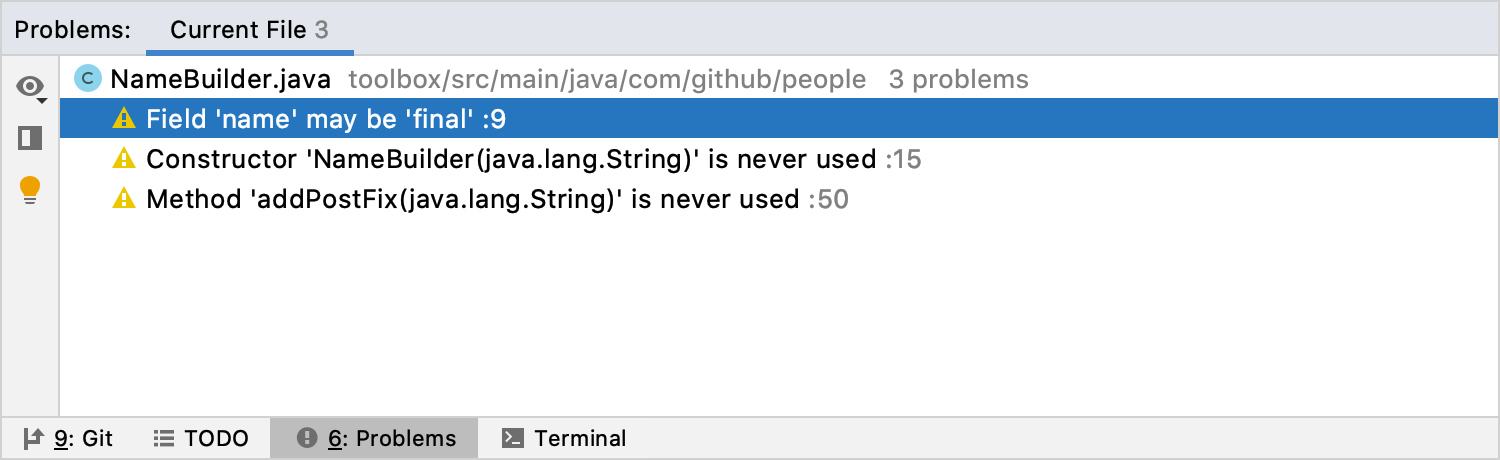
The Current File tab shows the list of problems in the file that is open in the editor. Select a problem and press Enter or double-click to navigate to it. You can also open a preview right in the tool window, and you can use the eye icon to filter the problems by type and to change the sorting.
The light bulb icon on the toolbar turns on if there are quick fixes for the selected problem. You can also press Alt+Enter on a problem to see the list of available quick fixes.
What’s next
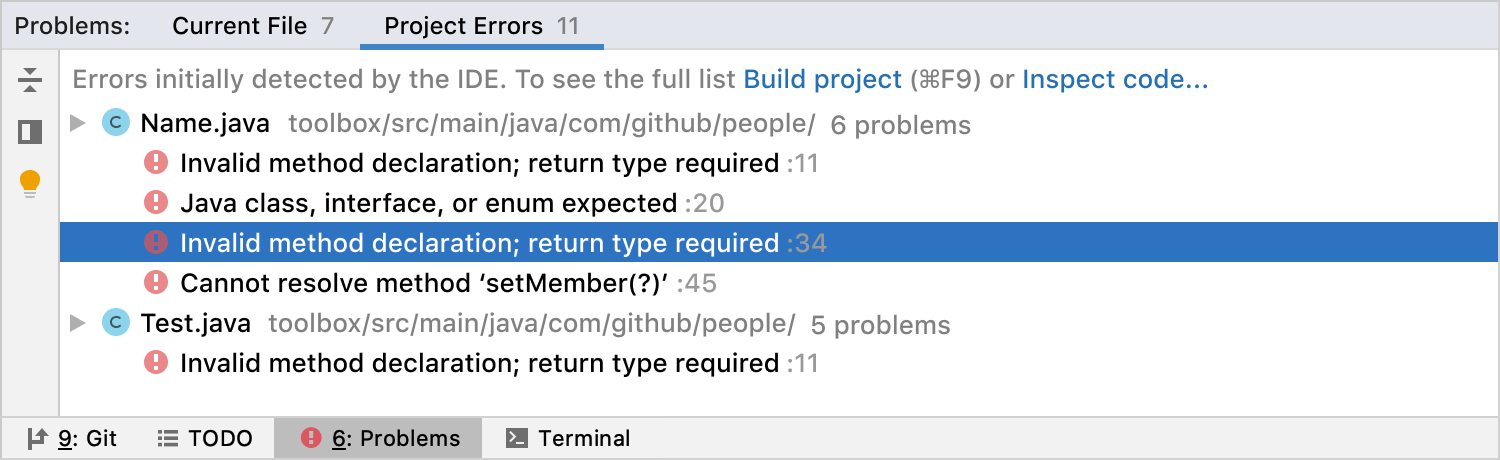
Our plans don’t end here. With v2020.3, we will continue to make it working with errors in IntelliJ IDEA easier. We are going to add the Project Errors tab to the Problems tool window. This tab will display the errors detected by the IDE for open files and dependent files. To get a full list of problems for the whole project, you will still need to build the project or use the Inspect Code action.
Upgrade to IntelliJ IDEA 2020.2 if you haven’t already and try all those new features. Don’t forget to share your thoughts and suggestions with us here in the comments or on Twitter.
Happy Developing!