IntelliJ IDEA
IntelliJ IDEA – the Leading IDE for Professional Development in Java and Kotlin
Explore Your Program with Static Analysis

When writing code, we constantly receive assistance from static analysis. Invisible mechanisms work behind the scenes to provide us with all sorts of suggestions and warnings. It would not be an exaggeration to say that IntelliJ IDEA knows more about our code than we do.
Now what if we could access the static analysis data, either to examine how the program works or to debug complex issues? Actually, this feature already exists and has in fact been around for quite a while.

It is called Dataflow to/from here, and it allows you to identify which values are possible at a given stage of data processing. This knowledge helps us detect potential runtime errors before they happen and optimize our code by removing redundant checks, conditions, and so on.
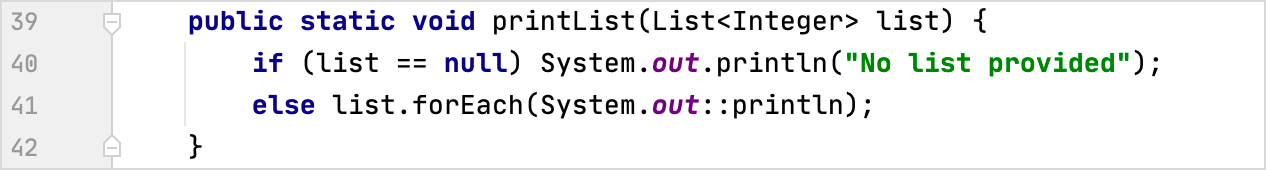
Consider the following example:
In the method printList, we have a null check to account for cases when null is passed as an argument. This protects us from a NullPointerException in the event that we try to print out the contents of the list when it is null.
Let’s see how this feature can help us optimize this code.
Right-click the parameter, select Analyze | Data Flow to Here and specify the scope of the analysis. In the Analyze Dataflow tool window, click Group by Leaf Expression Nullness and open the respective tab.
The results of the analysis clearly show that no upstream code ever passes null as a parameter when calling this method. We see that because all calls fall under the NotNull Values node.
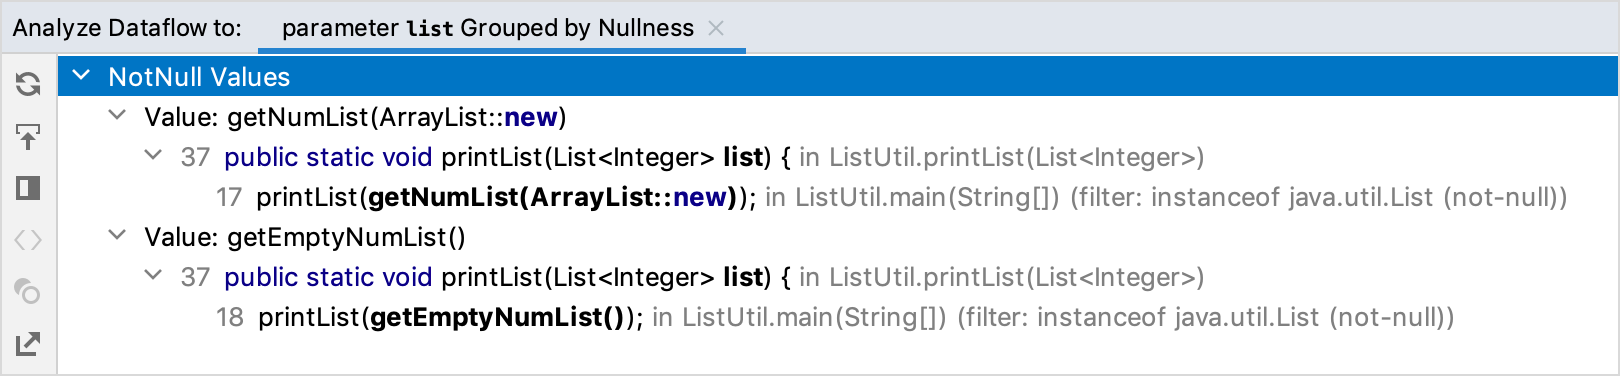
Thus we are safe to eliminate the redundant null check and annotate the parameter as @Notnull. Whenever you want to optimize your code but need more information to guide your decision about how to do so, data flow analysis is a tool that may save you a lot of time and help you avoid errors.
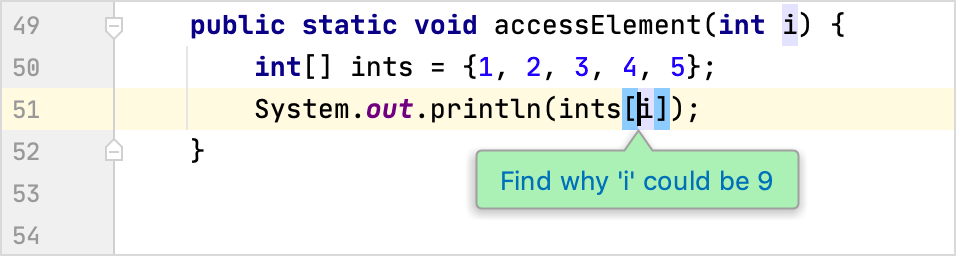
Using the same procedure, you can examine the entire range of input values. With this information available, you can prevent errors like unexpected ArrayIndexOutOfBoundsExceptions.
If an exception is thrown at runtime and you have a stack trace, identifying the cause becomes even easier. There is no need to look for the method that threw it and scrutinize the call tree. Instead, just click the frame where the exception was thrown.
If you haven’t used this feature before, we recommend giving it a try. And if you’d like more information about it, our documentation describes it in detail, so you may be interested in checking that out too.
If there are other features you would like us to investigate in more detail, please drop us a note in the comments.
Happy developing!