IntelliJ IDEA
IntelliJ IDEA – the Leading IDE for Professional Development in Java and Kotlin
IntelliJ IDEA 2021.1 EAP 1: Support for Java 16, WSL 2 Support, Run Targets, and More

New year – new Early Access Program! We are primarily treating IntelliJ IDEA 2021.1 as a quality release that will enhance the product’s usability and its UI. We’ll also be focusing on the pain points identified by you in our issue tracker, and we have plans to deliver several new features as well. Follow this series of EAP blog posts to get the latest information about the changes coming in IntelliJ IDEA 2021.1.

The Early Access Program for IntelliJ IDEA 2021.1 is open, and you can now try the pre-release build of the upcoming v2021.1. It delivers basic support for JDK16, the first round of features to support WSL 2, and UI and usability updates in the Profiler tool window. We’ve also introduced a new Run Targets feature that makes it possible to easily run and debug Java applications in Docker and on remote machines.
We encourage you to join the program to try out the new and improved features. By testing these updates and giving us feedback, you can help us make IntelliJ IDEA better for you. As always, you can download the new EAP from our website, get it from the free Toolbox App, or update using snaps if you’re an Ubuntu user.
In this post, we’ll take a look at the most notable updates from week one of the EAP.
Java
Support for Java 16
We’re getting ready for the release of JDK 16 in March 2021. We’ve already added new Language Levels to File | Project Structure | Modules, and we’ve also introduced basic support for Java 16, including the following updates:
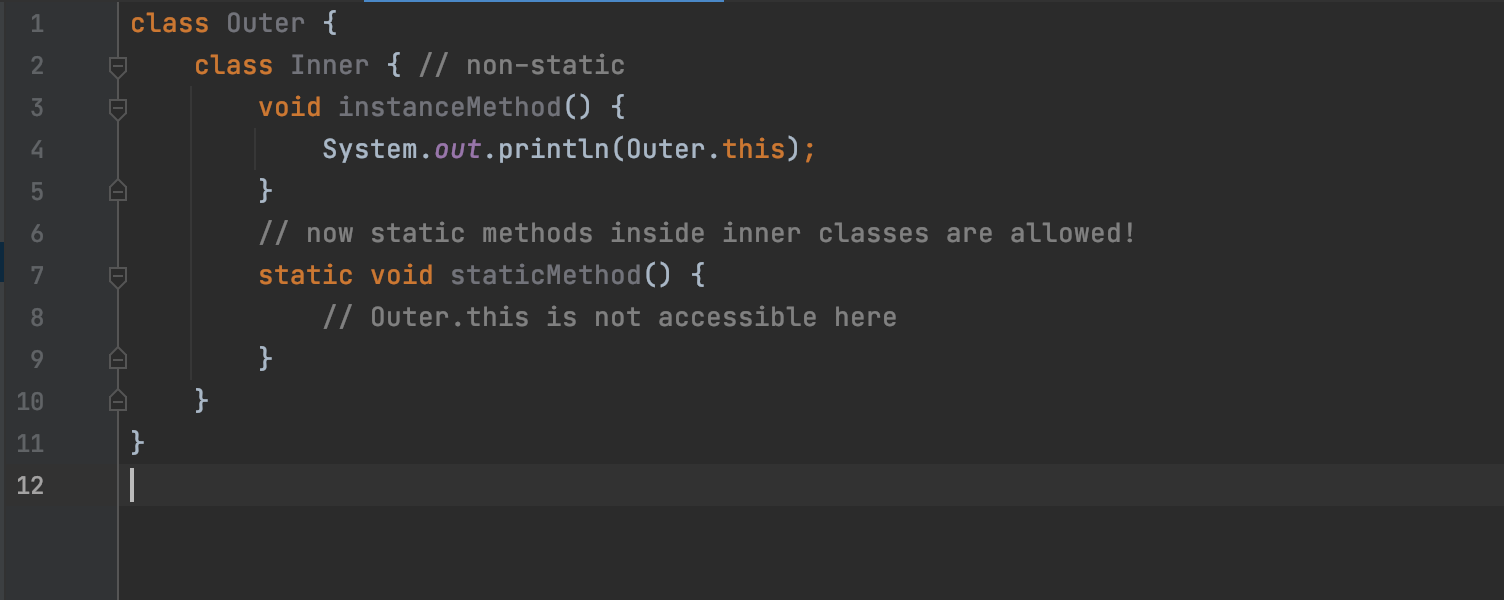
- An inner class can now declare members that are either explicitly or implicitly static.
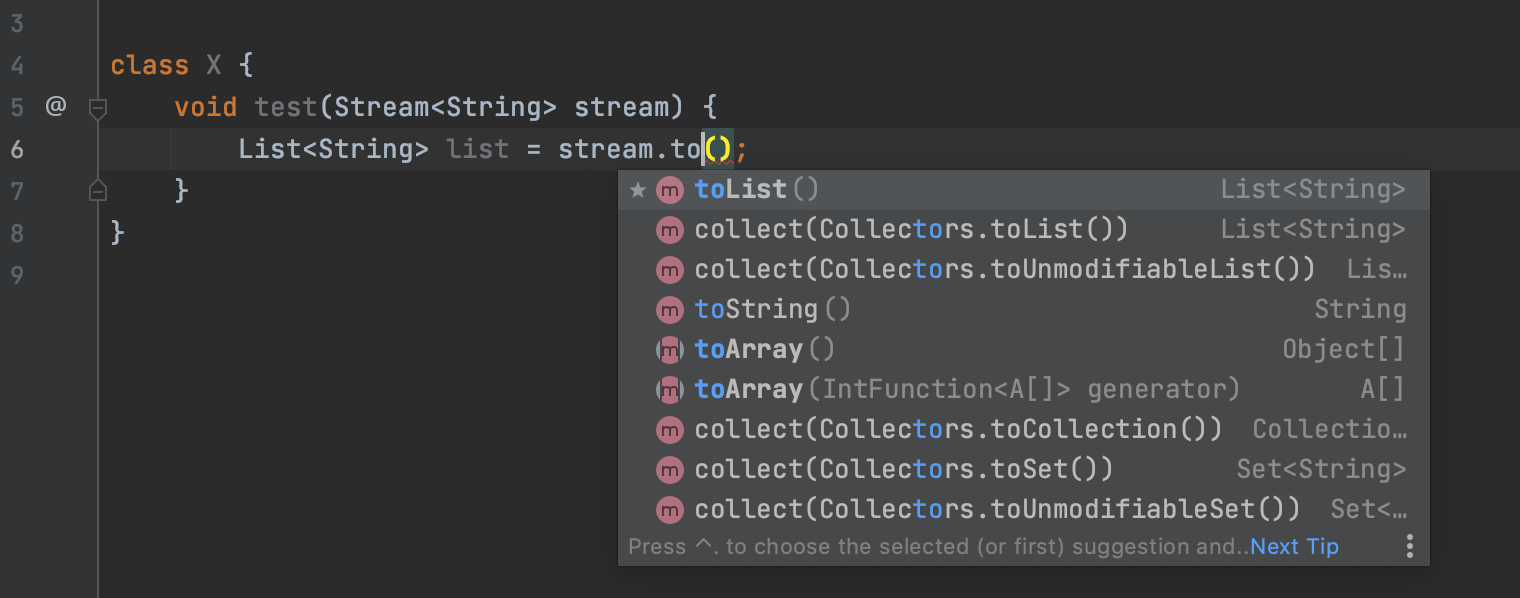
- Stream.collect(toUnmodifiableList()) is converted to stream.toList(). The toList() item is now displayed first on the code completion list for stream.
WSL 2 support (part 1)
This EAP includes the first installment of our support for Java projects inside WSL 2 when your IDE is running on Windows. IntelliJ IDEA can now perform the following actions inside WSL 2: detect JDK installations, install JDKs, and compile and run projects using the IntelliJ IDEA build system. Support for Maven and Gradle projects in WSL 2 is in progress and will be released in subsequent EAP builds. Stay tuned for updates!
For now, it is crucial that you try out WSL 2 support and share your thoughts. Your feedback will help us fine tune the feature before the major release.
Run Targets
Starting from v2021.1, our new Run Targets feature allows you to run, test, and debug your application on a target – a configured environment where the IDE will execute your code.
IntelliJ IDEA Ultimate currently allows you to run Java applications, JUnit tests, and Maven commands from Java, Maven, and Spring Boot projects on Docker, SSH, and WSL targets. Stay tuned for a blog post with a more detailed step-by-step demo of this new feature!
VCS
Built-in Space
The Space plugin is now available out of the box. This means that you can connect your IDE to your organization in JetBrains Space to view and clone project repositories, write complex scripts that use Space APIs, and review your teammates’ code. To log in to Space, click the Get from VCS button on the Welcome screen, select Space on the left, and enter your organization URL in the dedicated field. It is also possible to log in via Tools | Space | Log in to Space.
Once logged in, you can clone the desired repository and open it in IntelliJ IDEA. When you open it, Space Code Reviews will appear on the left-hand pane. From there, you can see a list of issues that contain your changes or require your attention. For example, if you are a reviewer, you can open an issue to see its author, look at the timeline, add comments inside a diff view, and more.
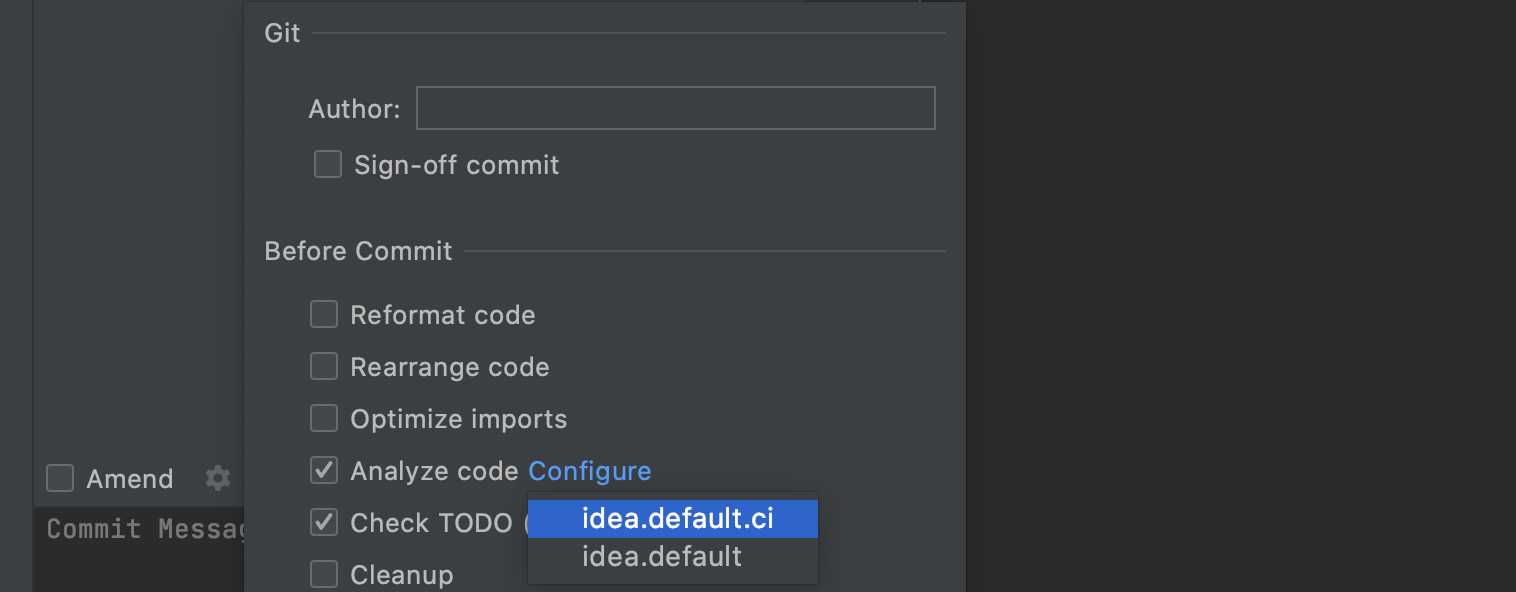
Configure a profile for pre-commit inspections
We’ve added the possibility to choose a code inspection profile before committing changes to VCS. To access this feature, click the gear icon to show commit options, select Analyze code checkbox, click Configure, and choose the desired profile. Profiles can be created in Preferences / Settings | Editor | Inspections. The IDE will use the selected profile when inspecting your code before the commit.
User experience
Built-in HTML preview
We’ve added a new built-in browser preview to IntelliJ IDEA that allows you to quickly preview HTML files. Any changes you make to HTML files in the IDE, as well as in the linked CSS and JavaScript files, will be immediately saved and the preview will update on the fly.
To open the preview, click on the icon with the IntelliJ IDEA logo in the widget in the top-right side of the editor.
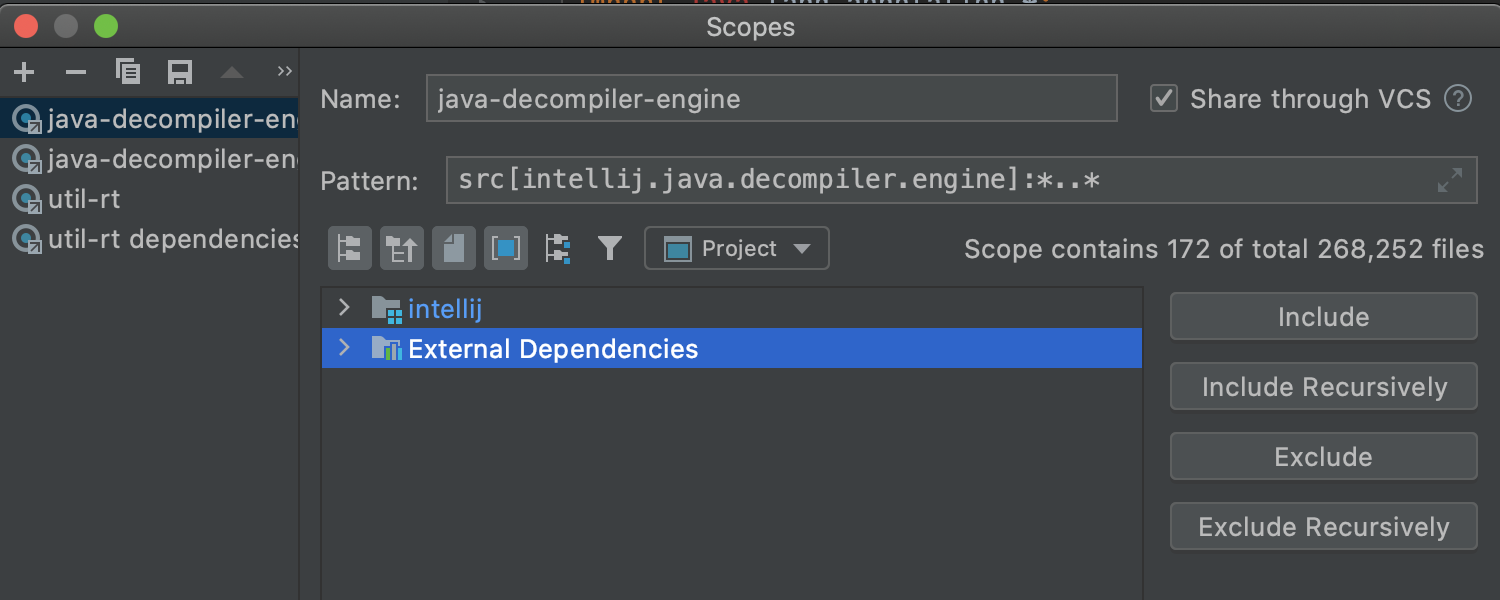
Customize external dependencies in the search scope
It is now possible to configure how the IDE will treat external dependencies when searching a text string within a project. Open Find in Files by pressing ⇧⌘F on macOS or Ctrl+Shift+F on Windows or Linux, select Scope, and click the “…” button next to the filters field. This will open the Scopes window, where you can see whether External Dependencies are included or excluded from the scope. You can change their status using the buttons on the right.
Profiler
In the left-hand area, you can see the process ID (PID) and percentage of CPU load for each running application. When you click anywhere on a running application, the IDE opens a context menu for it. From there you can quickly attach a profiler to the process or edit your Java Profiler’s configurations.
When you right-click on a running application, the IDE opens a context menu with two new actions:
- Capture Memory Snapshot allows you to take *.hprof snapshots of your applications to identify performance problems.
- CPU and Memory Live Charts helps you visualize resource consumption for running processes. When you click on this action, it opens a dedicated tab for setting a timeframe of the analysis, capturing memory snapshots, and performing garbage collection.
You can now open snapshots in the Recent Snapshots area with one click and quickly hide them by clicking X. The right-click menu contains the same actions and lets you open the folder where a snapshot is saved. What’s more, you can set a default folder for storing snapshots.
Build tools
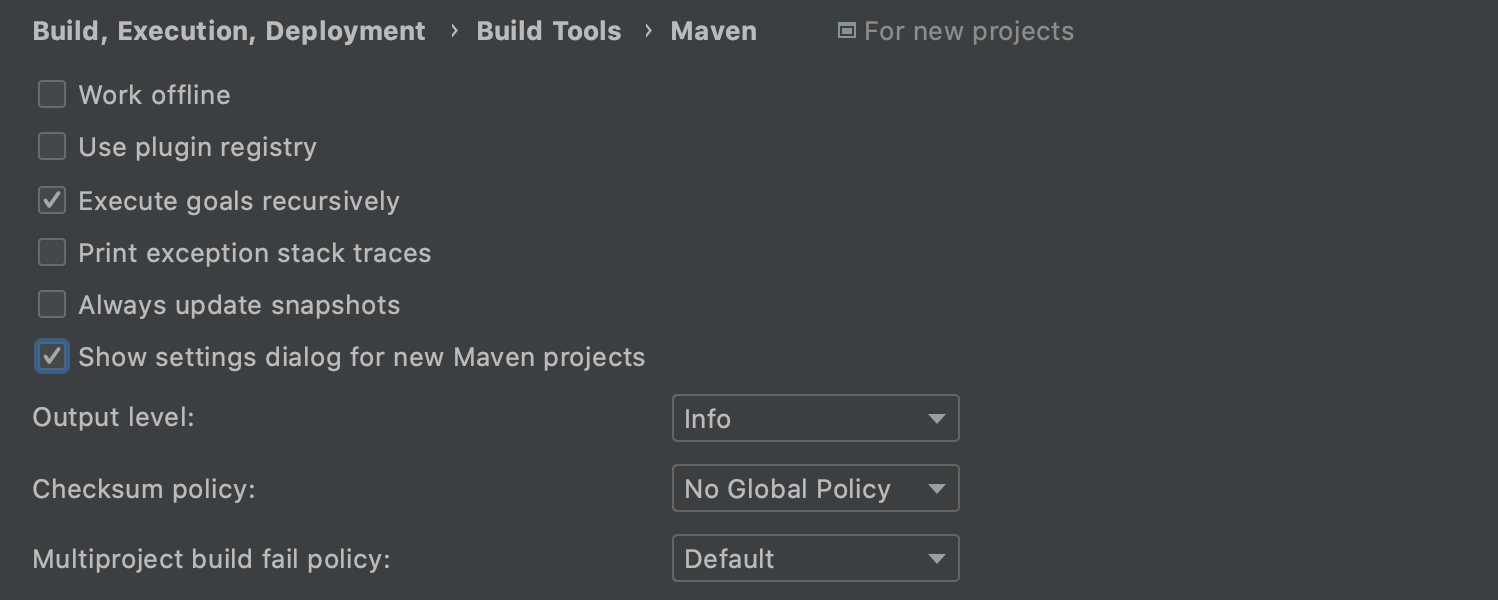
In response to your feedback, we’ve decided to return the option to customize settings when importing Maven projects. To activate this option, go to File | New Projects Settings | Preferences for new Projects | Build, Execution, Deployment | Build Tools | Maven and select Show settings dialog for new Maven projects.
Other
As we’ve already mentioned, this EAP will introduce a lot of bug fixes and improvements. Here are the most-voted issues that we have already solved:
- Fixed typeahead timeout when the same shortcut is assigned to several actions. [IDEA-190158]
- Added support for multi-line comments in pull requests. [IDEA-233916]
- Your project name now remains unchanged when adding a new Maven or Gradle module from existing sources. [IDEA-230219]
- Added a possibility to set a shortcut that selects the whole terminal output. [IDEA-117484]
- Native keychain works as expected on Apple Silicon builds. [IDEA-258912]
- Added the option to run tests on Java 8 with the Cucumber for Java plugin. [IDEA-256627]
- Non-modal commits now use changelist names as the default value for commit messages. [IDEA-215959]
- Fixed the UX issue that occurred when test methods and the main method both appeared in a test class. [IDEA-144385]
- The Debugger now supports preview features when you evaluate expression actions. [IDEA-234345]
That’s it for week one! You can find the rest of the changes for this EAP build in the release notes. Stay tuned for more updates, and be sure to share your feedback in the comments below, on Twitter, or via our issue tracker.
Happy developing!