IntelliJ IDEA
IntelliJ IDEA – the Leading IDE for Professional Development in Java and Kotlin
IntelliJ IDEA 2021.2 EAP 3: Async Profiler 2.0, Notifications from the Toolbox App, and More

It is time for the third EAP for IntelliJ IDEA 2021.2! You can get the fresh build from our website, the free Toolbox App, or via snaps for Ubuntu users.
This EAP introduces support for Async profiler 2.0, update notifications from the Toolbox App, preview tab in the debugger, and more.
Let’s take a look at what is inside.
User Experience
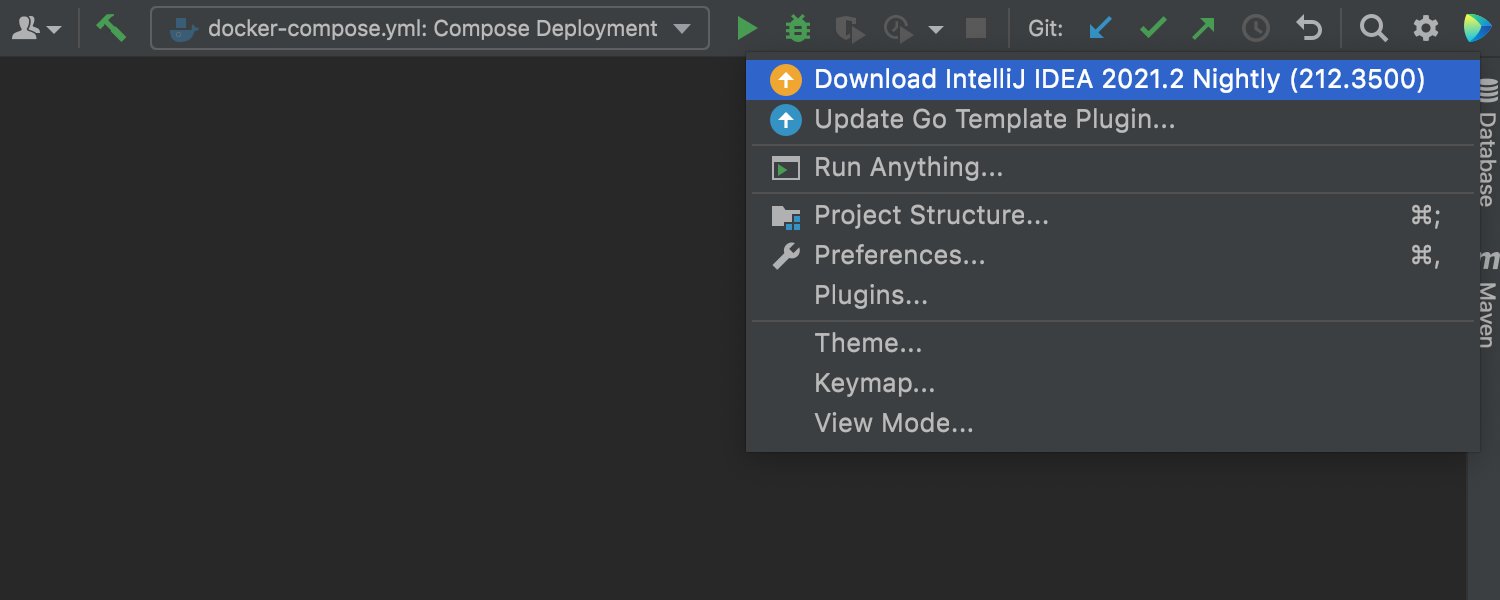
Update notifications from the Toolbox App
Now you won’t miss any critical product updates from the Toolbox App. Your IDE will inform you if there is a new version available for download and offer to upgrade to it right from IntelliJ IDEA. You’ll need to have Toolbox App 1.20.8804 or later for this.
Profiler
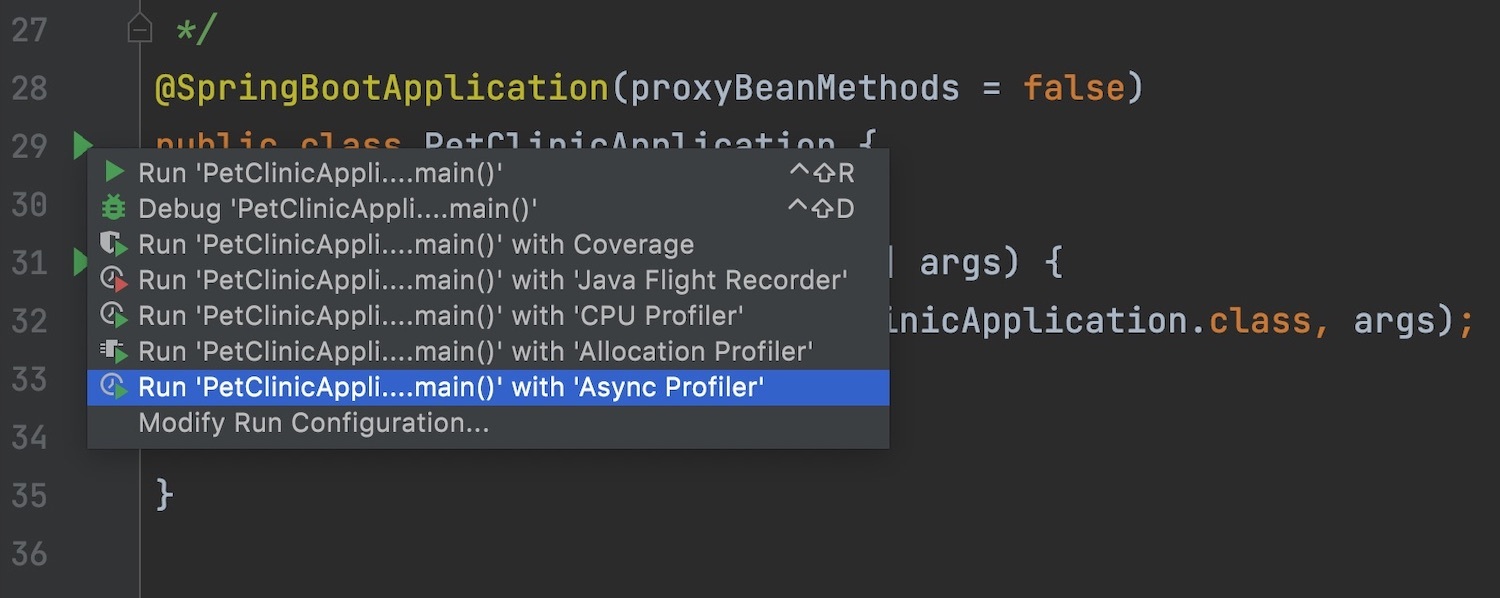
Support for Async profiler 2.0
In this EAP, we’ve introduced support for Async Profiler 2.0. The new configuration Async Profiler combines the power of the CPU and Allocation profilers and works from the same places as they do.
In the Flame Graph, Call Tree, and Method List tabs, the new Show dropdown list lets you choose whether you want to be shown CPU samples or memory allocations.
The Timeline displays both of them. You can filter what to show using the controller in the right-hand corner.
Run/Debug Configurations
Redesigned Gradle configurations
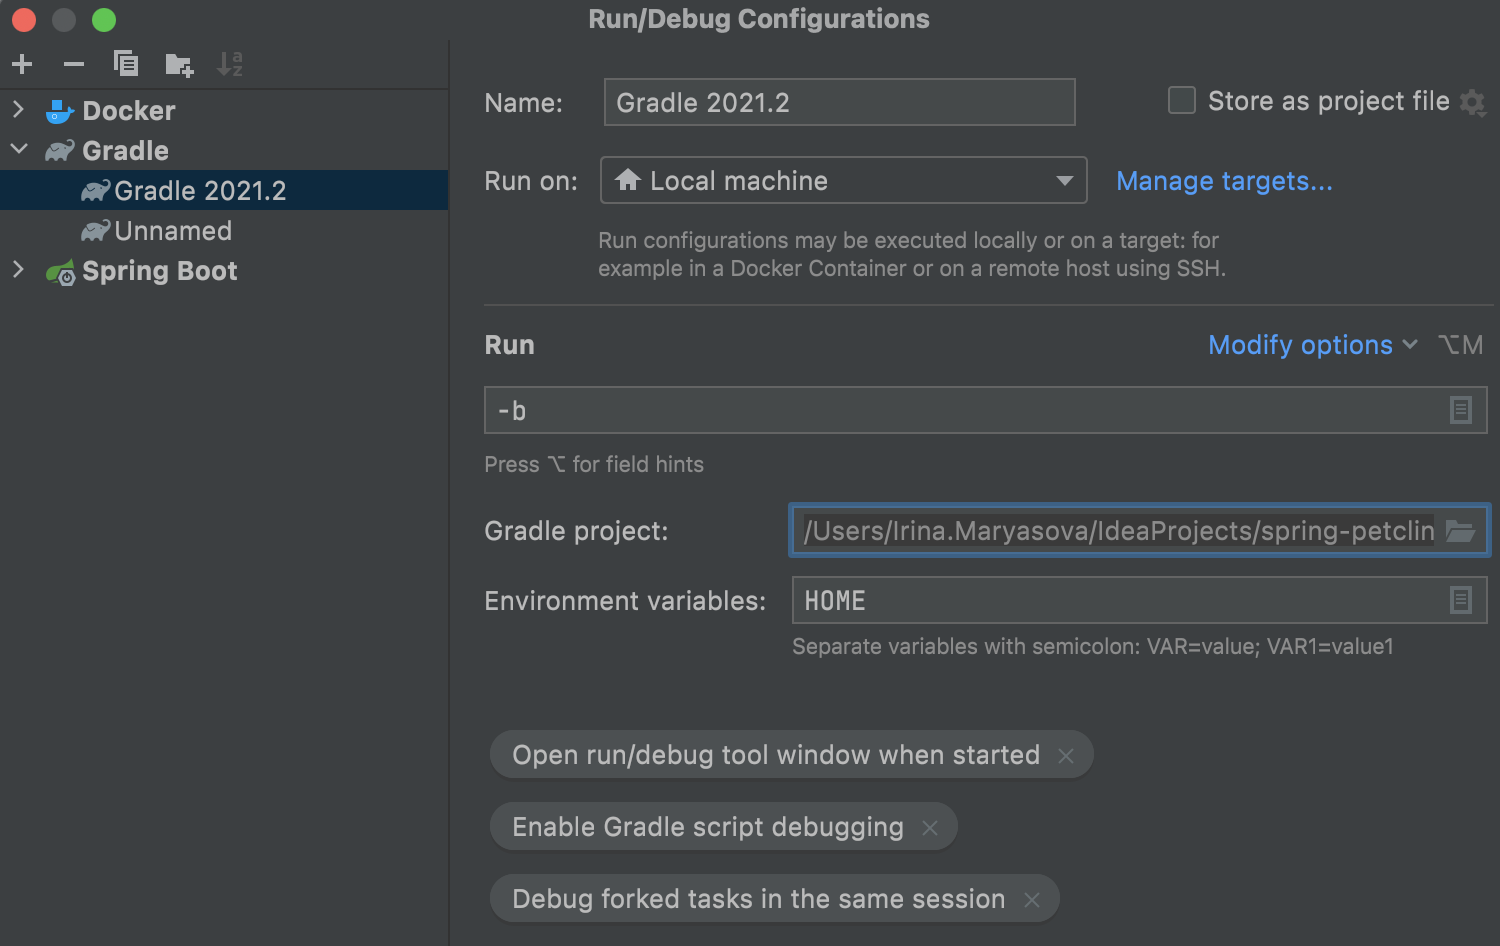
We are continuing to unify the UI for Run/Debug Configurations. Following in the footsteps of IntelliJ IDEA 2020.3, where the new design was introduced for the Application and JUnit Run/Debug Configurations, we’ve reworked the Gradle ones in this EAP.
The basic parameters are now conveniently grouped in one screen, with the ability to modify options based on your needs.
Debugger
Preview Tab now works in Debugger
The preview tab that used to work only for files in the Project view now also works for files that open during debugging.
It helps not to pollute the editor with multiple files that open in separate tabs when you stop at a breakpoint, step through the code, navigate between frames, or use the “prev/next frame” actions.
If you enable the preview, these files will all appear successively in one tab. You can turn this feature on in Settings/Preferences| General| Editor Tabs.
Here is how it works:
Code With Me
Synchronized code completion
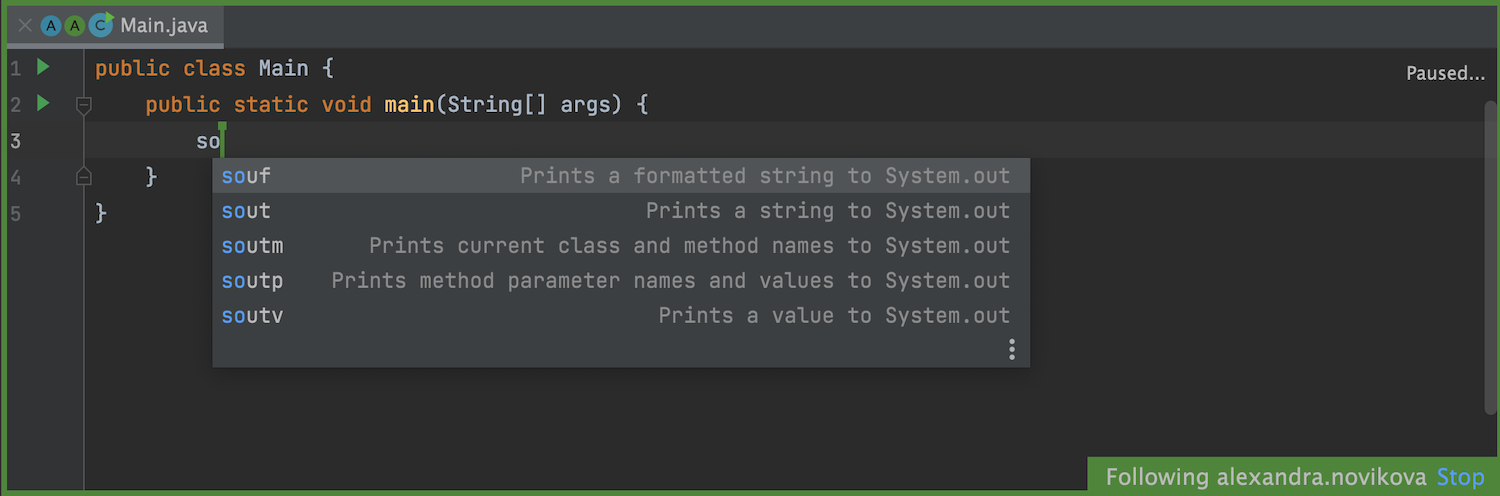
When you are in the Following mode during your Code With Me session, it is possible to keep track of what code completion suggestions the person you are following uses.
Other
Android plugin update
The Android plugin was upgraded to v4.2.0.
These were the essential updates available in the latest EAP build. The whole list of improvements is in the release notes. We hope you find them helpful and share your feedback in the comments below. If you encounter any bugs, please report them to our issue tracker.
See you next week!
Happy developing!