IntelliJ IDEA
IntelliJ IDEA – the Leading IDE for Professional Development in Java and Kotlin
IntelliJ IDEA 2021.3 EAP Is Open!
It is the start of our new season of the Early Access Program! Don’t miss this opportunity to try out the latest features before the major release. This is a crucial part of our development cycle where your feedback helps us polish features for the new version and make sure they meet your expectations.

With version 2021.3, we aim to improve the user experience and fix bugs, and introduce new functionality. Our first EAP includes a revamped debugger UI, a new inspection for tracking unsafe strings, improved Space integration, redesigned Maven configurations, and more.
Join the Early Access Program to be among the first to try out the updates and share your feedback with us. You can download the EAP build from our website, get it from the free Toolbox App, or use snaps if you are using Ubuntu.
Please note you can install trial versions of paid plugins on your EAP builds. Starting from this EAP, to use the trial of the paid plugin you will need to provide your JetBrains credentials.
Let’s have a look at what is included in this first EAP build.
Debugger
New debugger UI
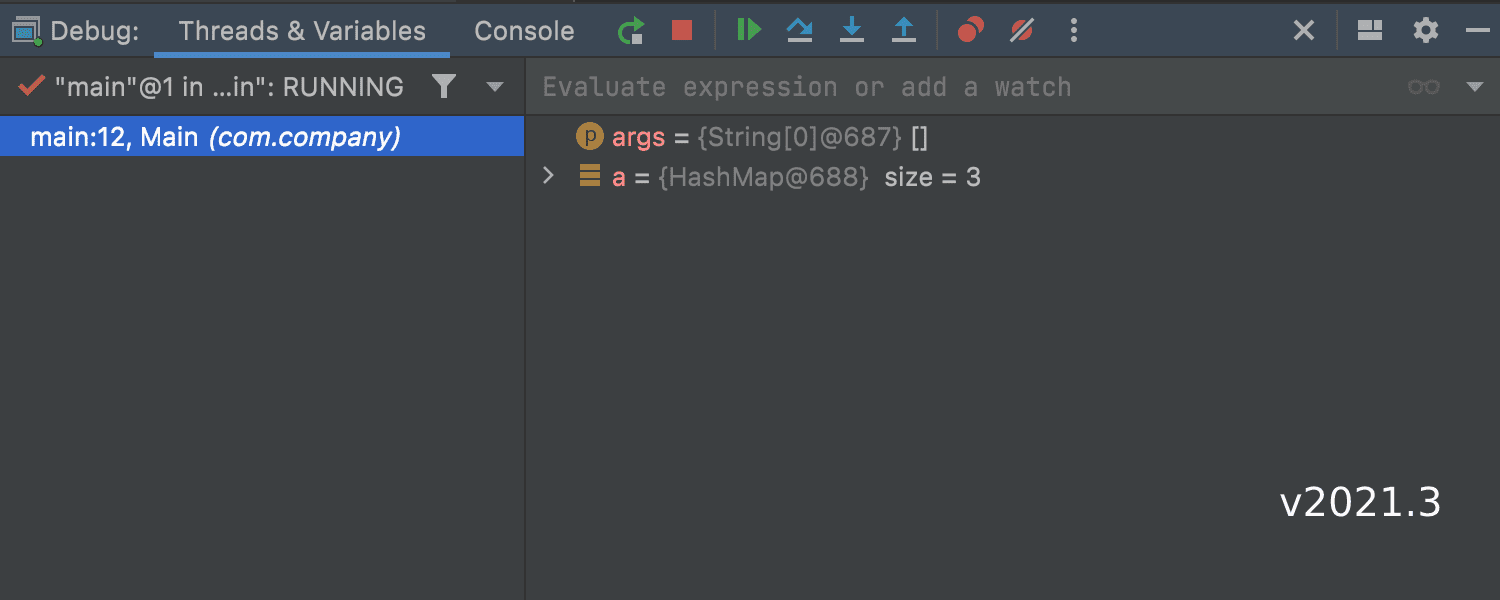
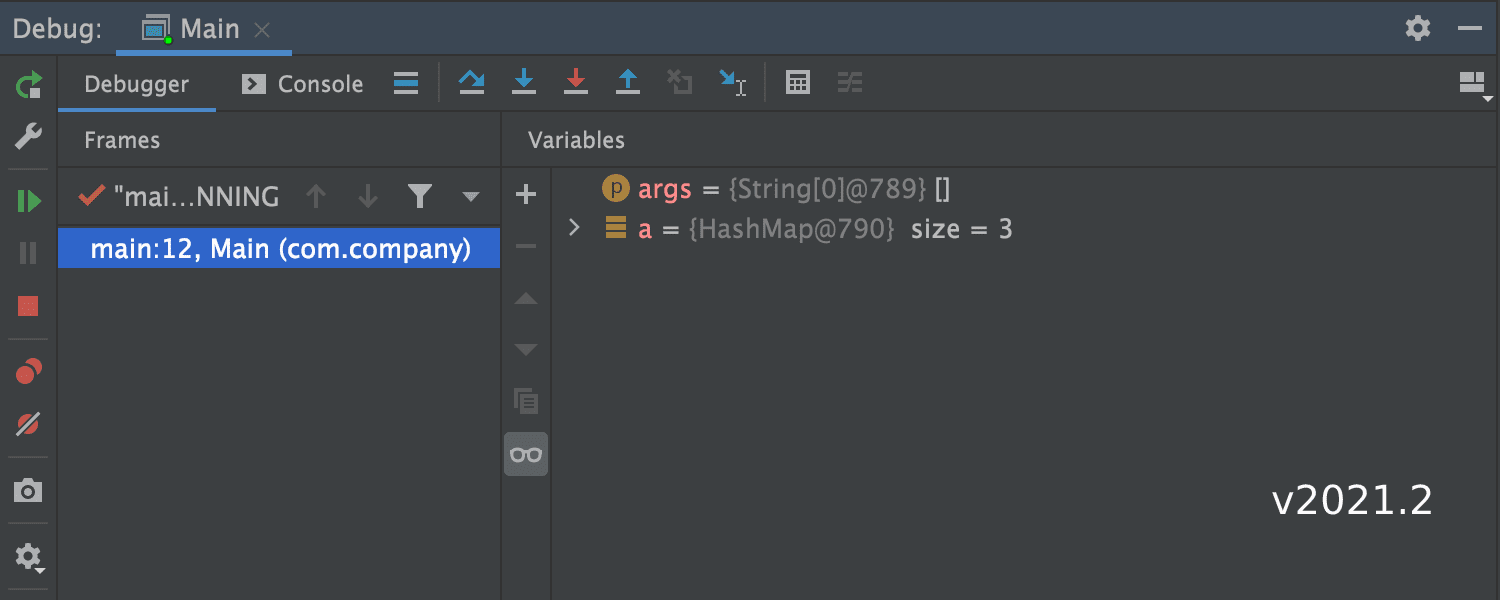
Our built-in debugger is a powerful tool that helps you explore the code behavior and fix bugs. However, its design has become cluttered over the years, and as a result, the workflow has become overly complicated. This is why we decided to rework the Run/Debug tool window, making it simpler, neater, and more concise.
The new design is more modern and minimalistic, which speed up the debugging workflow and make popular actions more discoverable. So, what have we done?
New debugger layout
There is now a single horizontal toolbar at the top of the window. We’ve removed the vertical toolbar on the left and collapsed all the others. This layout reorganization lets us save a lot of space and makes the UI more intuitive. The changes help to better focus on the essential debugging tasks like analyzing variables and navigating frames.
Debugger actions
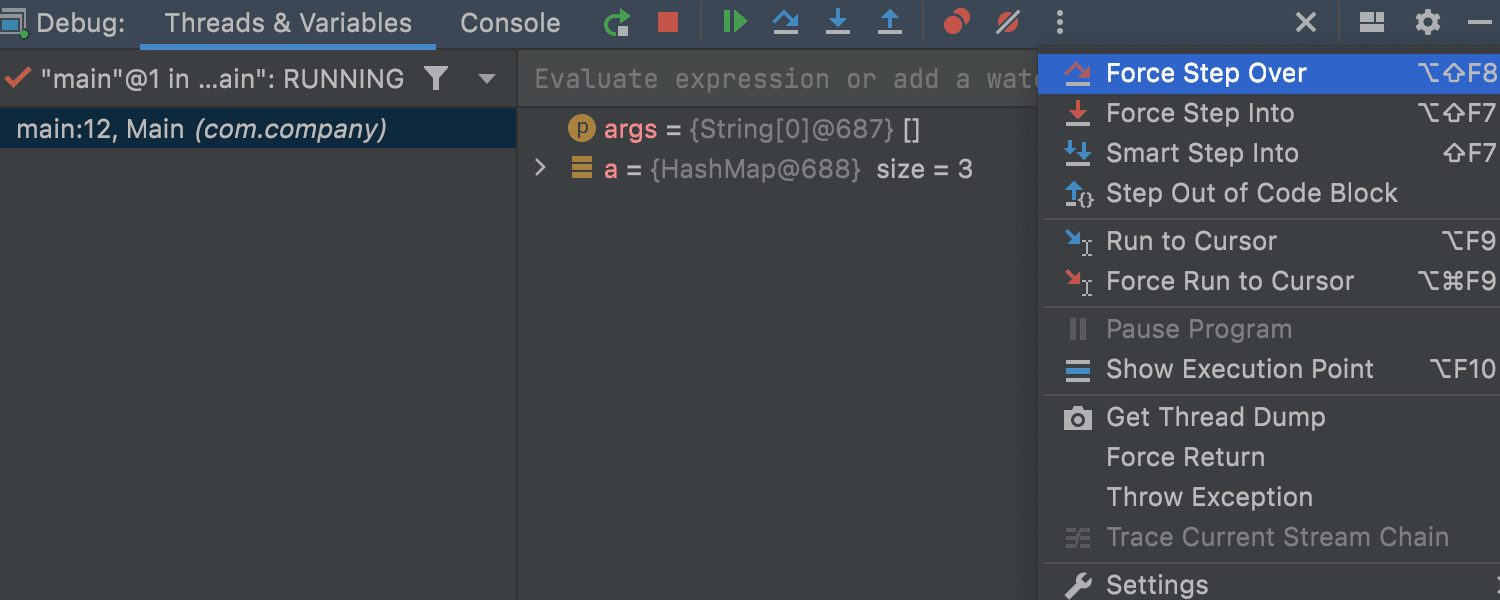
The most popular actions can now all be found in one place; you can access the rest using the More icon. If the default configuration doesn’t work for you, you can customize it in Preferences | Appearance & Behavior | Menus and Toolbars | Debug Header Toolbar.
Evaluate expression
We’ve also made the Evaluate expression dialog more discoverable – you can now access it right from the Debug tool window. 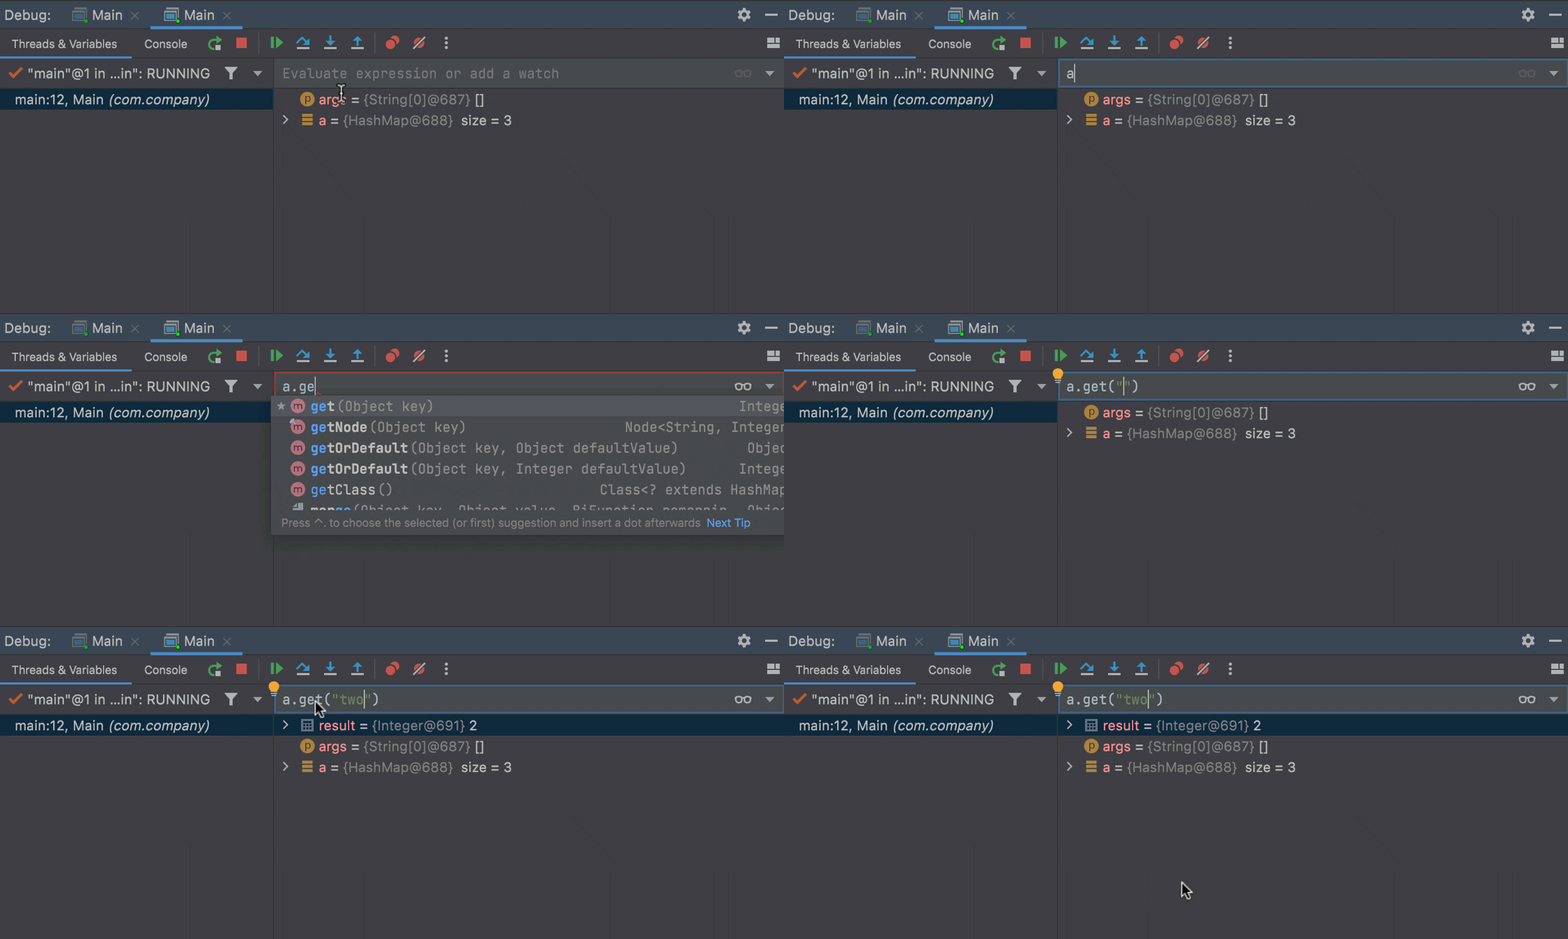
Space integration
Merge requests and code reviews from the IDE
When you work with a project located in Space, it is now possible to create merge requests and code reviews from the Code Reviews tool window in IntelliJ IDEA. To call these actions, use the + icon on the top toolbar.
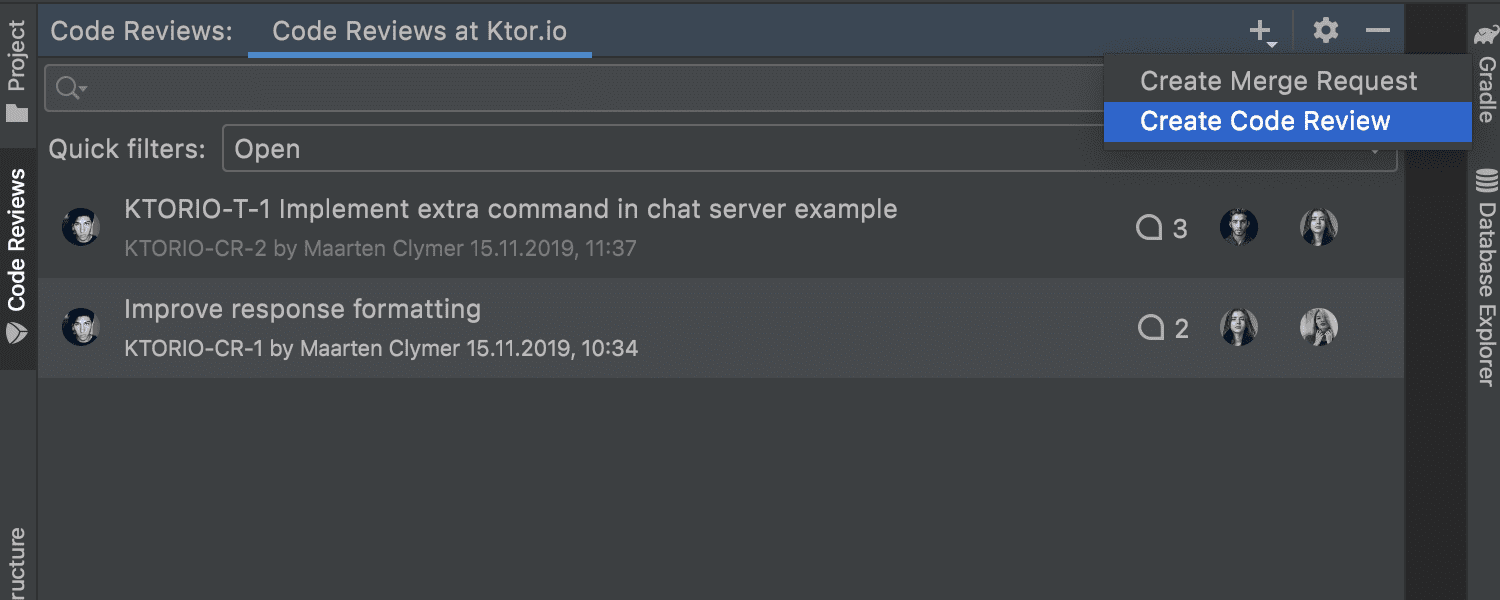
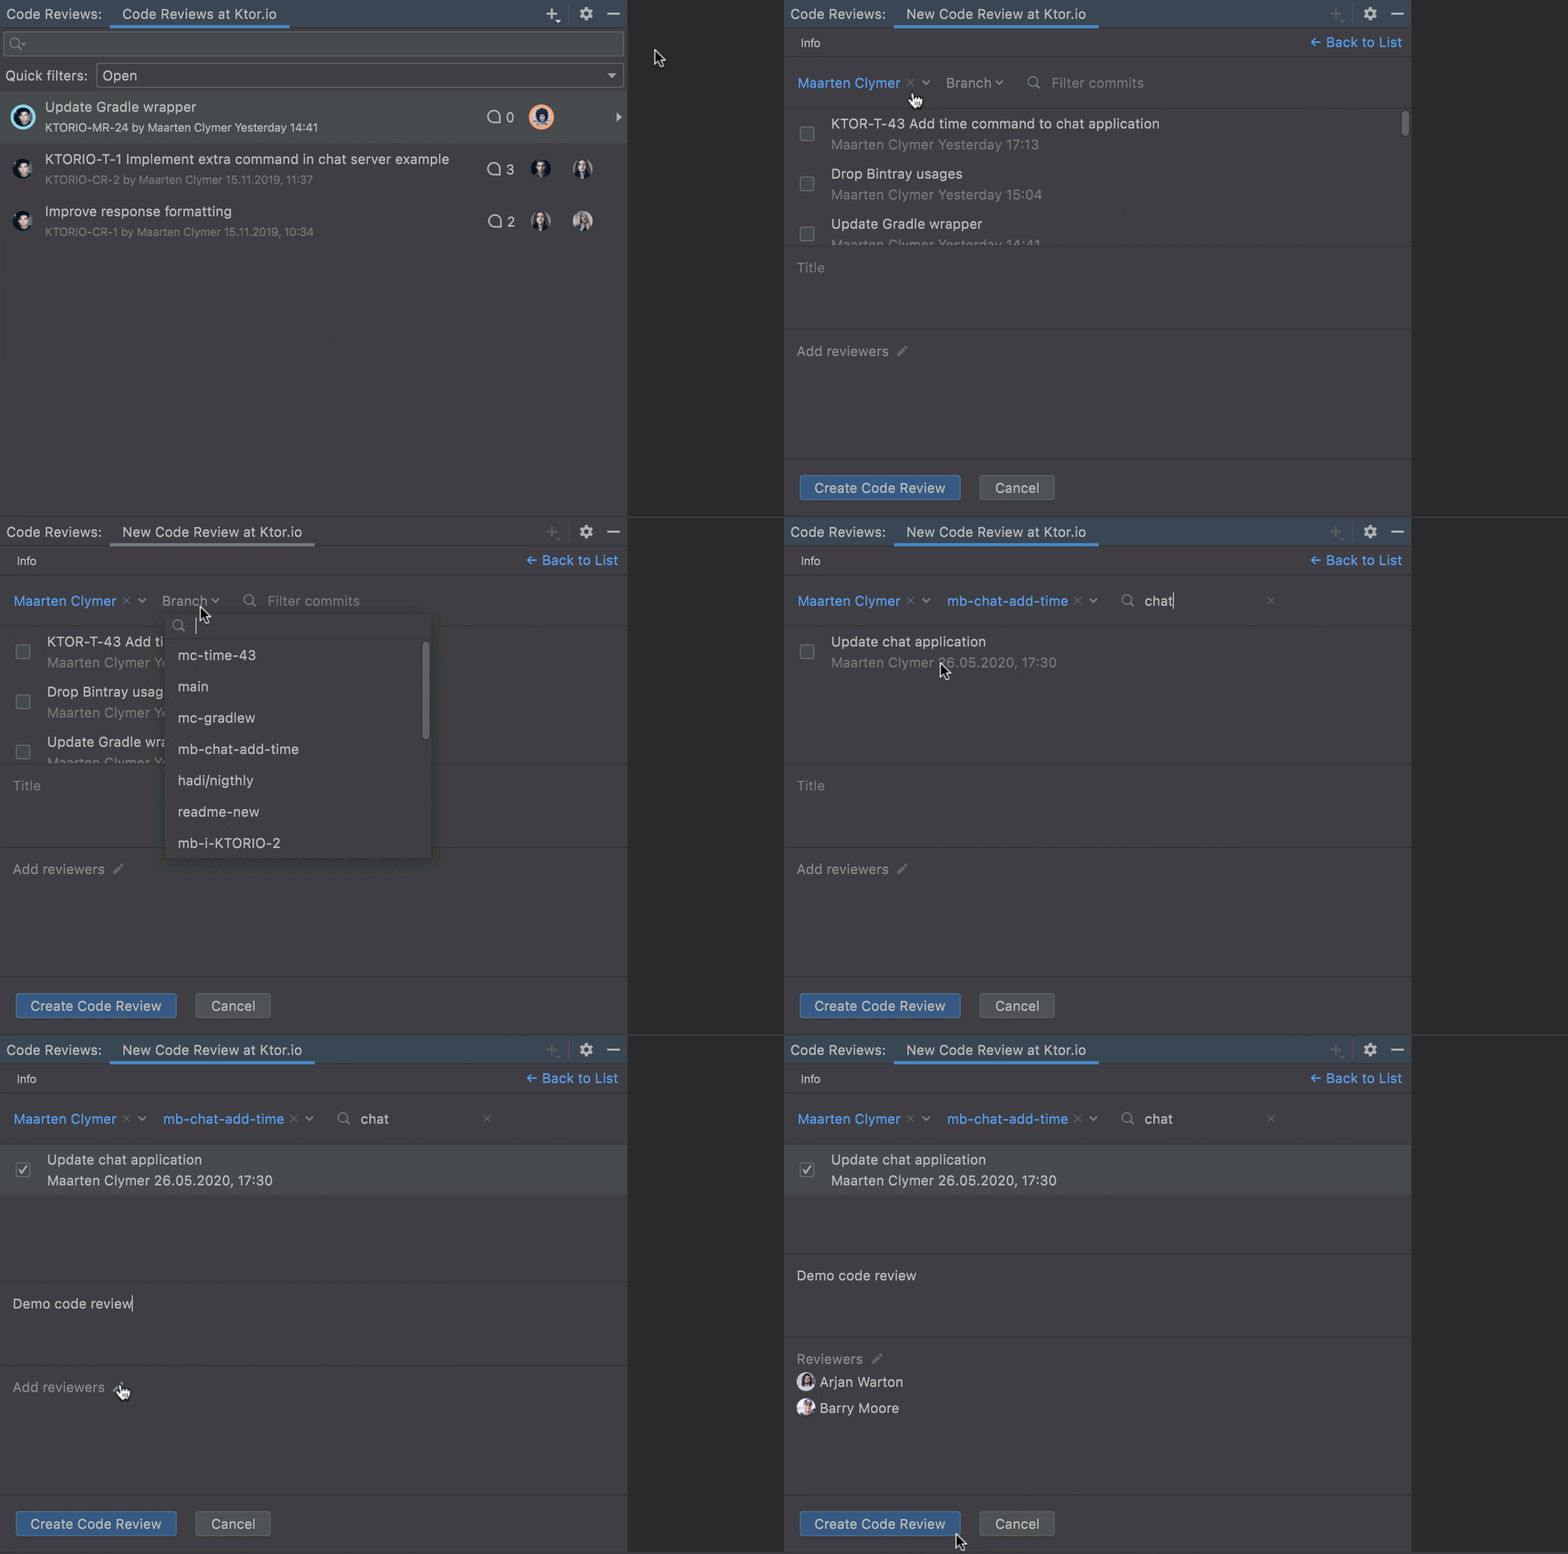
If you need your colleagues to review a branch with multiple commits before merging it to the target branch, use the Create Merge Request action. Once you select this action, click on the branch names at the top of the window to choose the head repository, the branch to be reviewed, and the destination branch.
IntelliJ IDEA will then display the commits that you want to merge in a list in the Info tab. In the sections below this list, you can enter a name for the merge request and add reviewers. To finalize the process, just push the Create Merge Request button.

The Create Code Review action is more generic, and it is helpful when you want your teammates to review commits located either in one or in various branches. After choosing this action, IntelliJ IDEA will display the complete list of pushed commits available in Space. In the Info tab, you can then manually filter them by author, branch, time period, or commit text. If you are filtering by commit text, you should enter either the entire commit hash or a whole word used in the commit. Then enter the title and add reviewers before clicking Create Code Review.
Mark files as viewed
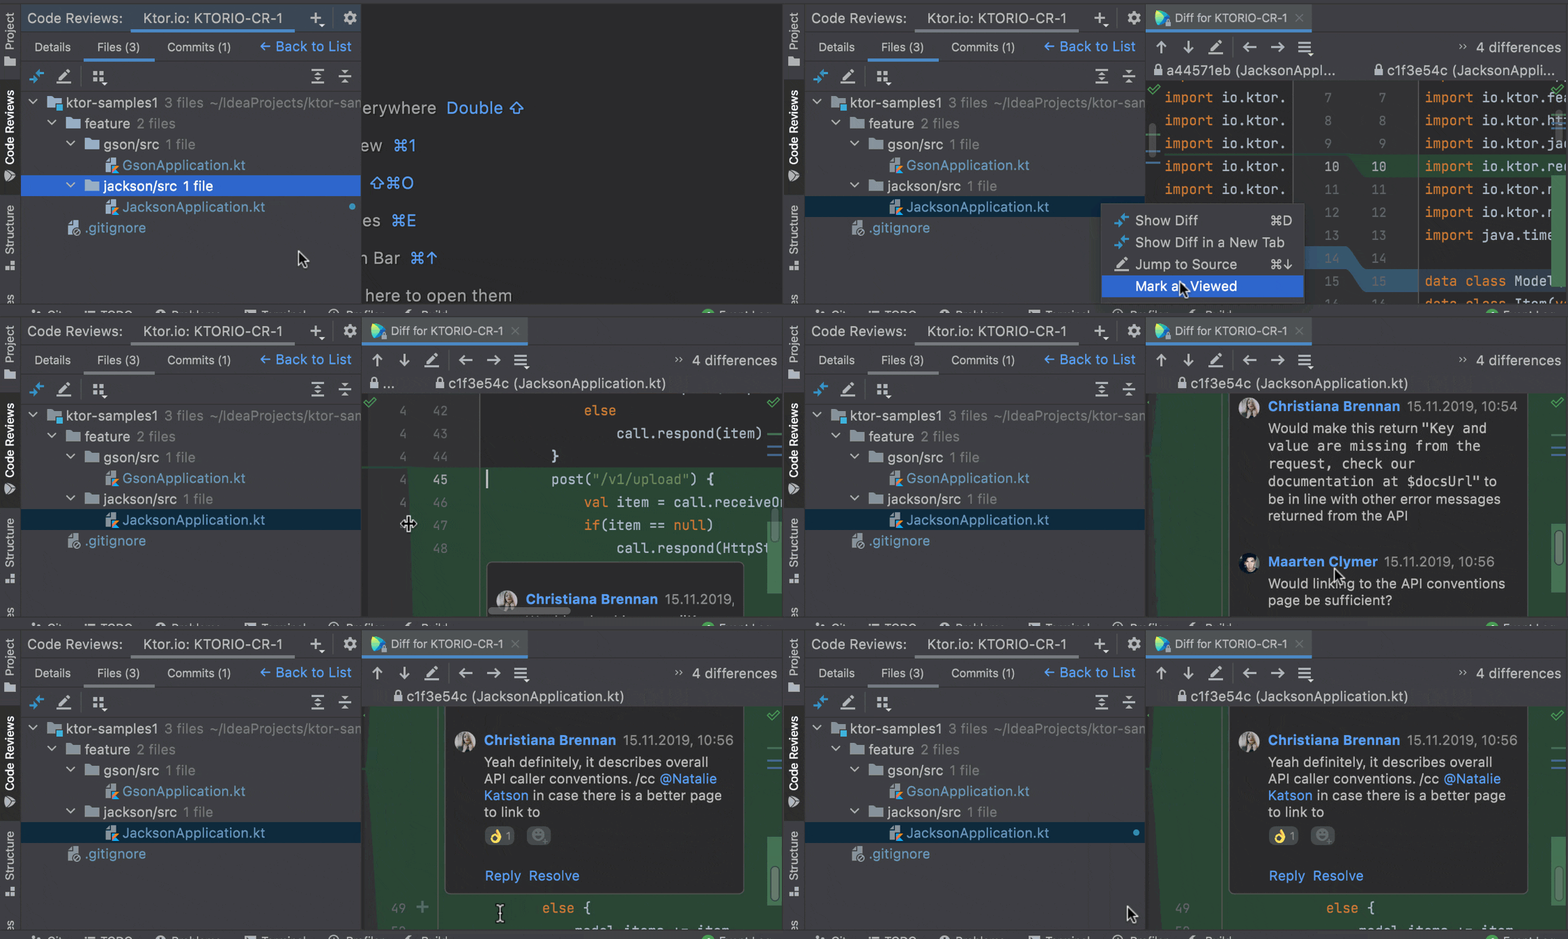
You won’t miss any critical changes in Space projects when performing a code review, as the files you haven’t revised yet will be marked with blue dots. These dots will be cleared automatically after you open the marked items. If you want to return to the changes later, you can select Mark as Not Viewed from the context menu.
Java
Inspection for tracking unsafe strings
We’ve introduced an inspection that helps you find such hazards as SQL injection and XSS flaws, sensitive data leaks, and insecure deserialization. It also warns you against passing insecure data to secure methods.
For this inspection to work, you should annotate strings as @Untainted ( “safe”) or @Tainted (“unsafe”). These annotations will be valid when you add the org.checkerframework.checker.tainting.qual dependency.
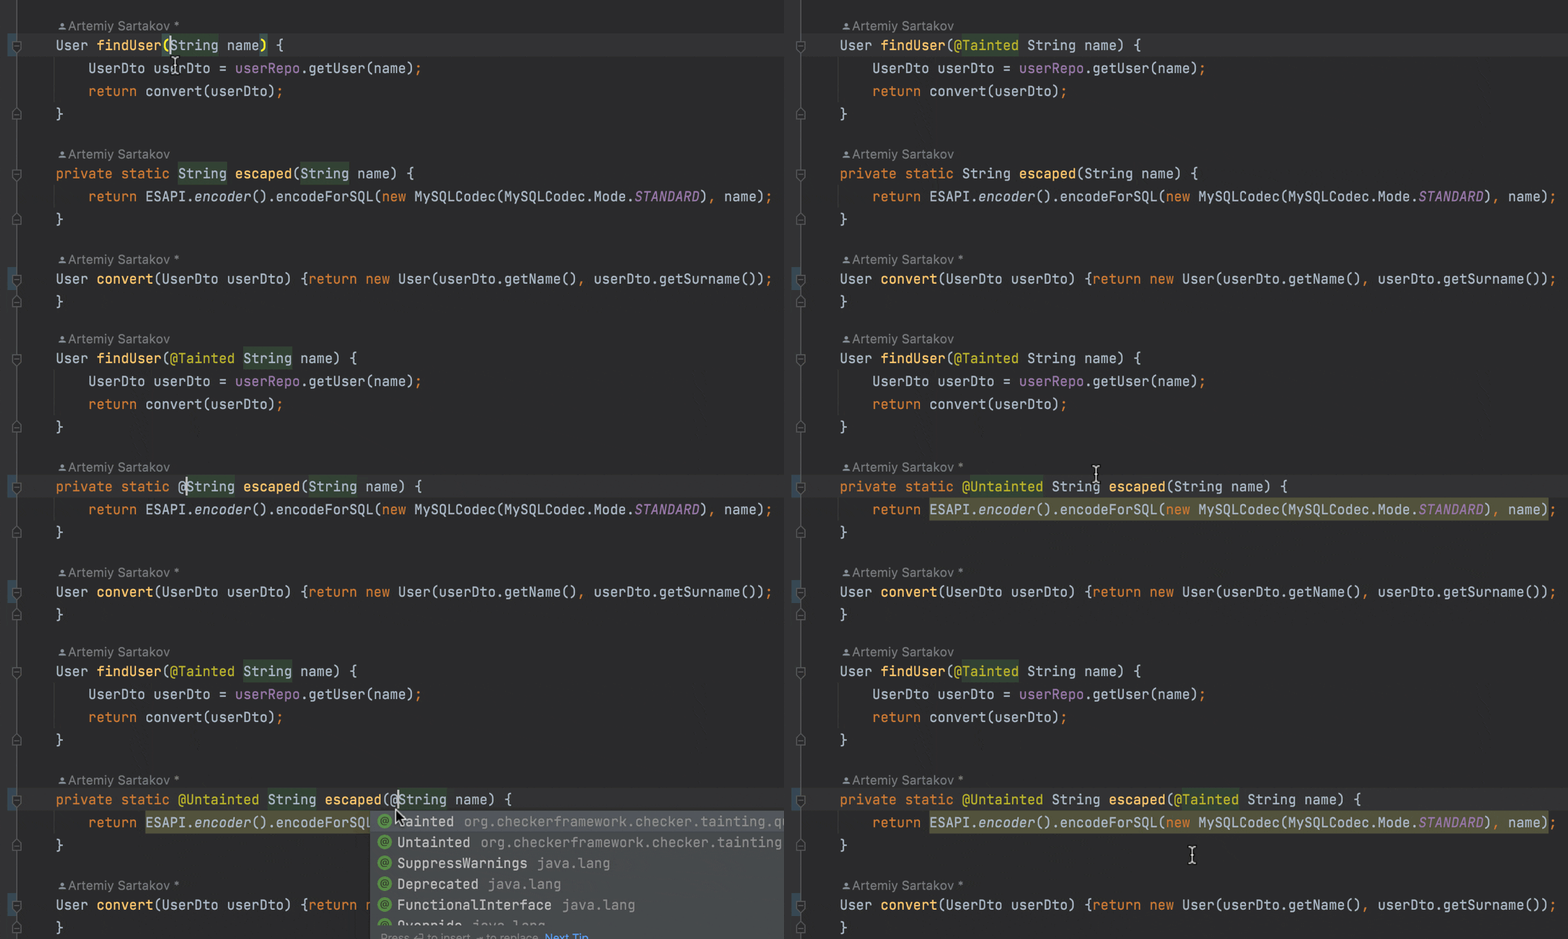
Once you’ve annotated the necessary strings, IntelliJ IDEA will identify the places in your code where a @Tainted or unknown string is passed to a method with an @Untainted parameter and show you a warning. You can then improve your code to resolve the problem or use a quick-fix to mark the string as safe.
The following GIF demonstrates what would happen if you used a string that contained an SQL injection:
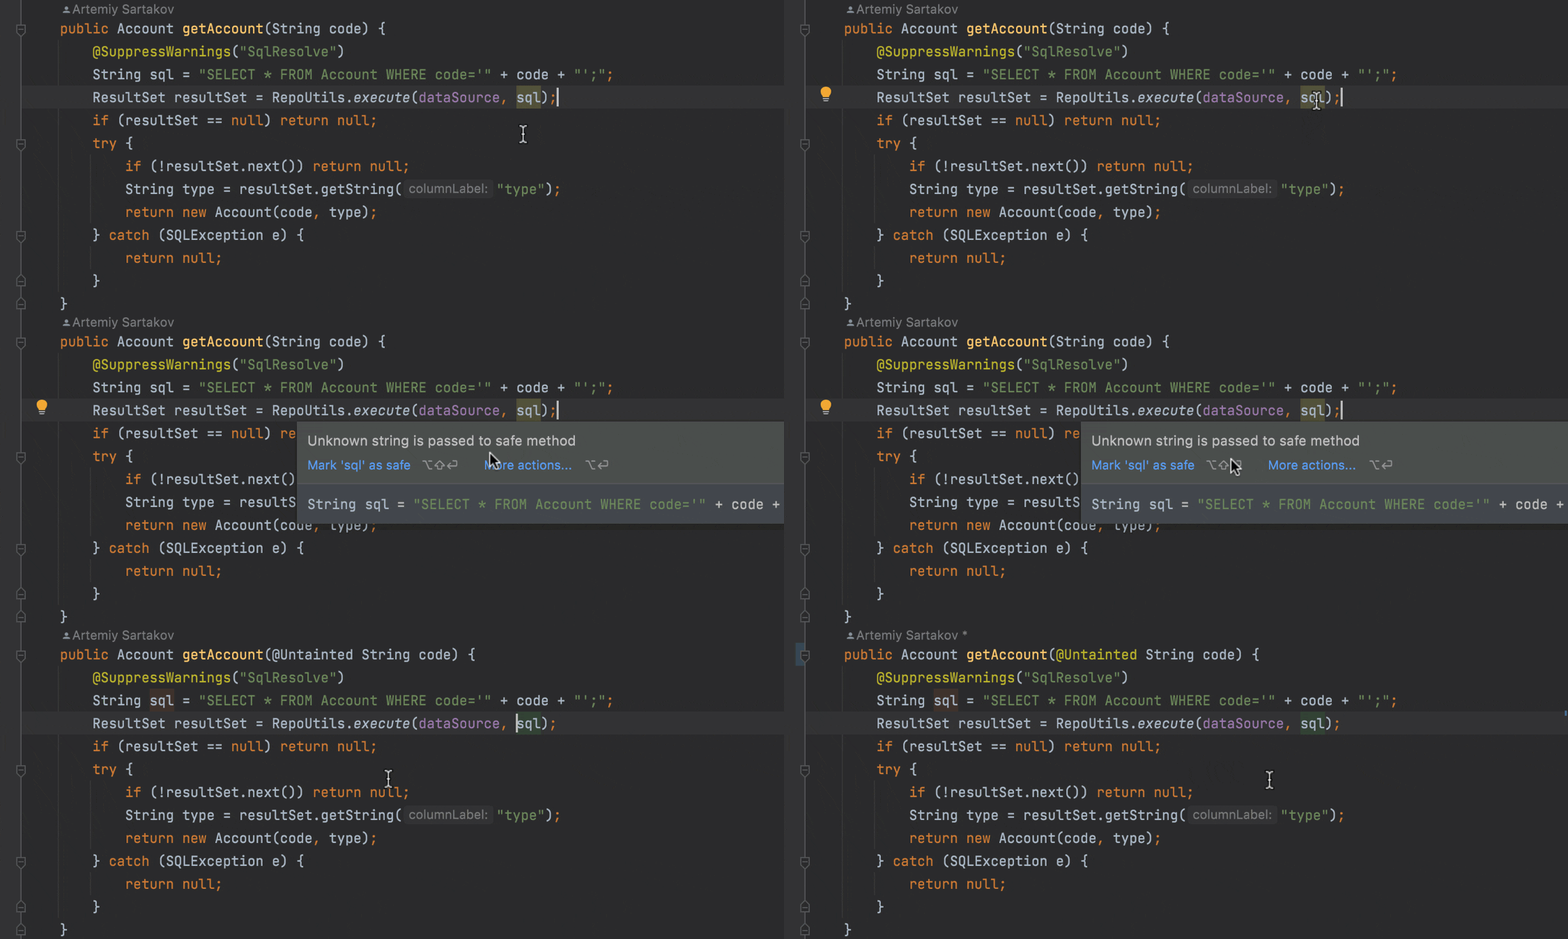
You can find the inspection description under Preferences/ Settings | Editor | Inspections – Non-safe string is passed to asafe method.
Build tools
Redesigned Maven configurations
As part of our effort to simplify the UI, we are continuing to improve our Run/Debug configurations. This time, Maven configurations have received a significant redesign that mirrors the layout we already applied to Gradle configurations in v2021.2. The essential parameters are all on one screen, and additional options are available via Modify options.
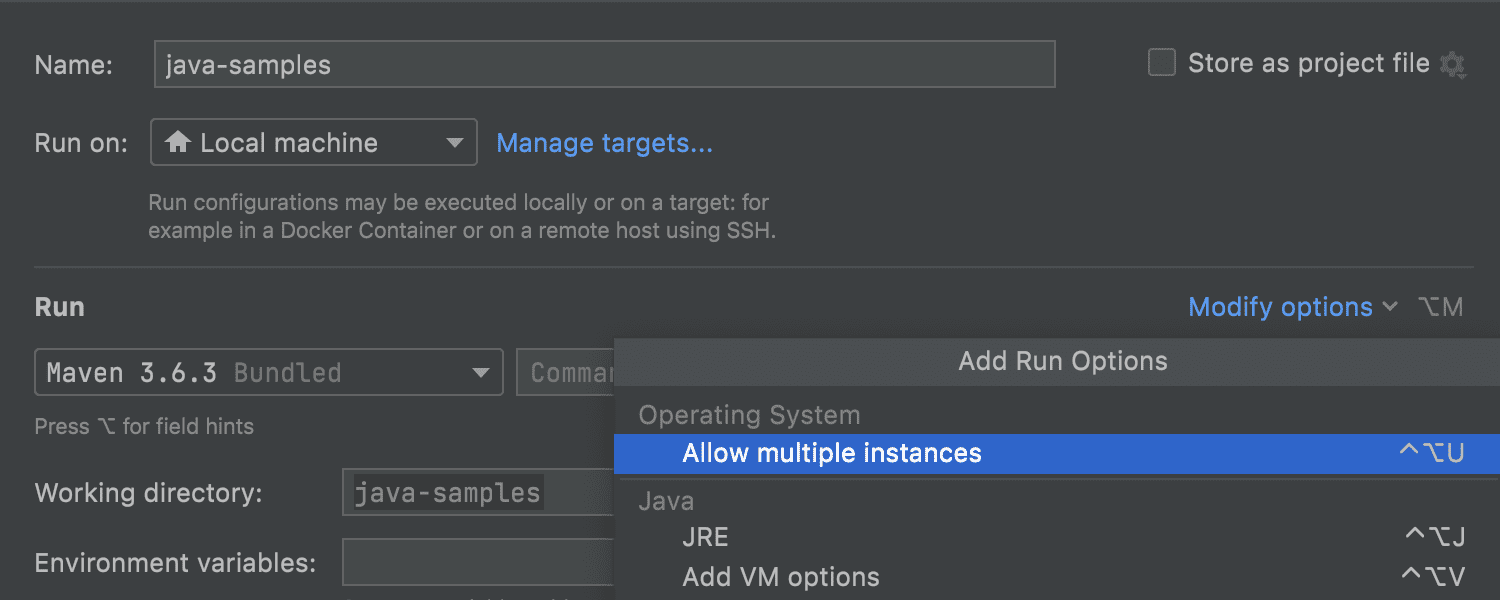
Support for .mvn/maven.config
IntelliJ IDEA also allows you to configure Maven settings per project in the .mvn/maven.config file. To enable this option, go to Preferences/ Settings | Build, Execution, Deployment | Maven and select Use settings from .mvn/maven.config at the bottom of the screen. Please keep in mind that the settings from this file override the standard Maven UI settings.
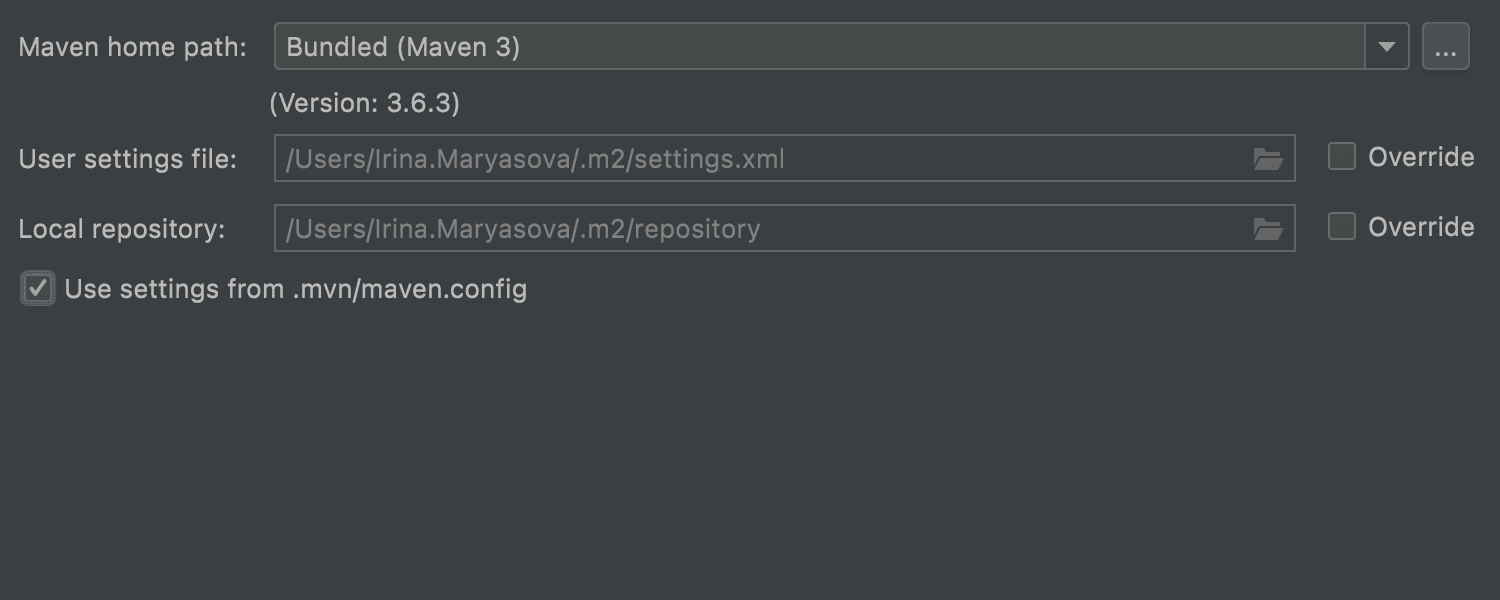
Quality enhancements
We are always working to improve your experience of our product; that’s why fixing bugs, freezes, and regressions is one of our top priorities. Here is a list of all the fixes that we have made in the first EAP build:
- Fixed the causes of several IDE crashes on Linux. [IDEA-248140]
- Fixed the Hierarchy tool window so it correctly displays the usages of an interface method that has at least one implementation. [IDEA-275145]
- Fixed recurring indexing on every startup if the IDE was closed due to OS shutdown. [IDEA-275337]
- If you use the font zoom feature, it is now applied to all open files, not just the current one. You can activate this new option by selecting the All editors radio button in the Mouse control section in Preferences/ Settings| Editor| General. [IDEA-158642]
- Fixed the autosave feature so it works as expected even with open pop-ups. [IDEA-128672]
- Fixed the behavior of the Stop button. When you stop the WildFly Run Configuration, the Terminate Batch Job prompt no longer appears. [IDEA-273497]
- It is now possible to disable list editing in Markdown. To do so, go to Preferences/Settings | Languages & Frameworks | Markdown and deselect the Automatic assistance in the editor checkbox. [IDEA-273049]
- Fixed the Welcome screen; the project list is now in focus. [IDEA-217756]
- Focus no longer shifts to the File menu when F10 is pressed during debugging. [IDEA-138429]
- Fixed the File mask field in the Find in File dialog. The list is now displayed correctly. [IDEA-236785]
- Added an ability to debug various Gradle scripts. [IDEA-267460], [IDEA-206650], [IDEA-194493]
You can see the complete list of quality enhancements in the release notes.
That’s all for week one! We hope you will find all the new features useful, and we look forward to reading your feedback in the comments below. Also, if you notice any bugs, please report them to our issue tracker.
Happy developing!
Subscribe to IntelliJ IDEA Blog updates


