IntelliJ IDEA
IntelliJ IDEA – the Leading IDE for Professional Development in Java and Kotlin
IntelliJ IDEA 2021.3 EAP 2: New Bookmarks Tool Window, Kotlin Debugger Updates, and More

Week two of our Early Access Program starts today, bringing you the new Bookmarks tool window, an improved debugger experience for Kotlin, Async Profiler 2.0 on Windows, the ability to compare .jfr snapshots, VCS changes, and more.
The new build is already available on our website, in the free Toolbox App, or via snaps for Ubuntu users.
Before you get started with it, let’s examine the new features and improvements in more detail.
User experience
New Bookmarks tool window
In IntelliJ IDEA, we have two very similar instances – Favorites and Bookmarks. As the difference between the two could sometimes be confusing, we’ve decided to stick to just one – Bookmarks. We’ve thoroughly reworked the workflow for this functionality and made a new tool window for it.
From now on, all the files, folders, and classes that you mark as important with the F3 shortcut on macOS or F11 on Windows/Linux will be located in the new Bookmarks tool window.
When you add a bookmark, IntelliJ IDEA puts it in the node named after your project. The IDE automatically creates this node beforehand and stores all your prioritized items there by default. New bookmarks will appear at the top of the list inside this node. However, you can organize them manually by dragging and dropping them to new lists, which you can name according to your needs.
If you prefer to work with one list, it is possible to sort your bookmarks by type using the Sort Groups and Bookmarks option in the tool window’s settings. Keep in mind that if you add a new bookmark after applying this sorting option, the bookmark will appear at the top of the list, in accordance with the default behavior.
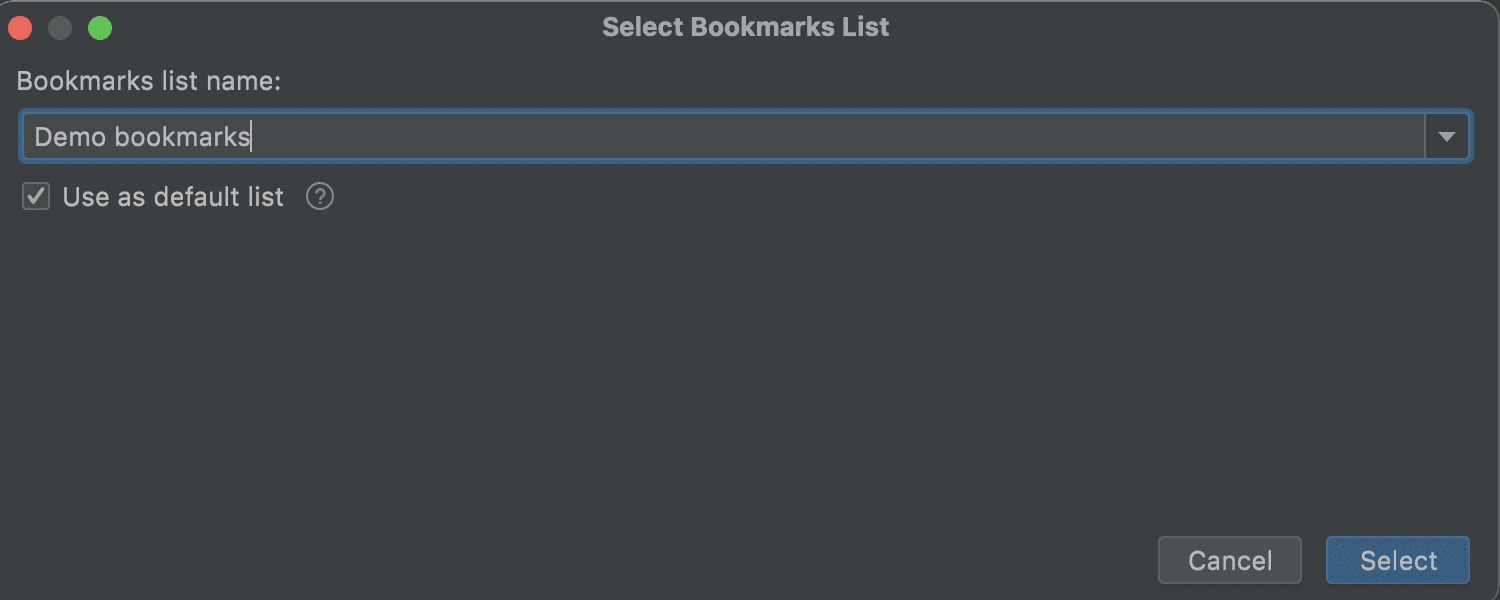
If you don’t have a default list, the IDE will ask you to choose where you want your bookmark to be saved.
Kotlin
Debugger updates for Kotlin
We’ve done a lot of work to improve the user experience in the debugger.
Inline stack frames
The debugger can now detect Kotlin inline functions and show inline function calls in the stack trace panel. You can navigate to these calls, and you can also inspect and evaluate the variables of each frame.
Smart Step Into
Sometimes one line of Kotlin code can call several methods, making the debugging process a bit unpredictable. If you use the Step Into action, the debugger will lead you through all the child functions but won’t allow you to stop at any of them. However, with the newly added Smart Step into action, this is now possible!
When you find yourself at a line with more than one method call, just click the Step Into button located in the top pane of the Debug tool window, or use the F7 shortcut. The IDE will then highlight the places where you can step into the code, and you’ll be able to select the line you want by clicking on it.
This feature is available by default. If you want to disable this default behavior for the Step Into action, go to Preferences/ Settings | Build, Execution, Deployment | Debugger | Stepping | Kotlin and deselect the Always do smart step into checkbox. If you do so, the Smart Step Into action will still be available via the ⇧ F7 shortcut on macOS or Shift+F7 on Windows and Linux.
Extract constant refactoring
A new refactoring allows you to extract constants in Kotlin. To use it, put the caret on a string and press ⌥⌘C on macOS or Ctrl+Alt+C on Windows and Linux.
We want to thank XiangRongLin, one of our developer contributors, for making this feature work!
Profiler
Support for Async Profiler 2.0 on Windows
In v2021.2 we added support for Async Profiler 2.0 to the macOS and Linux versions of IntelliJ IDEA. Starting from this EAP, the Windows version supports Async Profiler 2.0 out of the box as well. This support provides a smoother experience.
Compare .jfr snapshots
You can now compare .jfr snapshots right from the IDE. This allows you to make sure your changes have improved your program’s performance and check for possible regressions.
All you have to do is open two snapshots sequentially. In the most recent snapshot, click the diff icon in the top-right corner and select the snapshot you’ll use as the baseline. You will then see the result in the form of a flame graph, call tree, or method list.
If you have any questions or ideas about how we can improve this functionality, please follow this issue or leave a comment on this blog post.
VCS
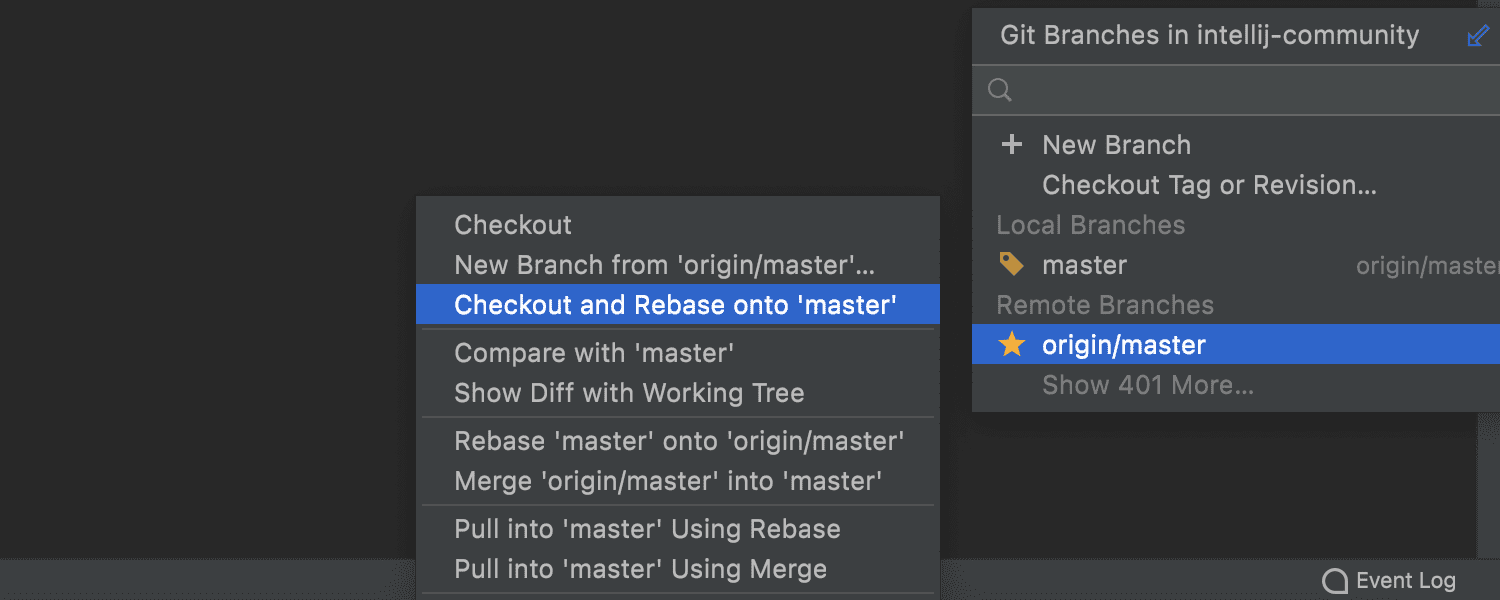
Checkout and Rebase onto Current for remote branches
The Checkout and Rebase onto Current action allows you to check out the selected branch and rebase it on top of a branch that is currently checked out. Until now, it has only been available for local branches. Starting from this EAP, we’ve added the ability to apply this action to remote branches, as well.
Reorganized VCS settings
To improve the user experience and speed up the process of configuring your version control systems, we’ve made the VCS settings more discoverable and more clearly structured. Here are some of the changes you’ll find in Preferences/Settings | Version Control.
The Version Control node now lists all the available settings. You can easily navigate to the settings by clicking on them.
We’ve improved the layout inside the Git node. We divided all the settings into sections that account for the most important processes: Commit, Push, and Update. Additionally, the parameters inside these sections are now organized more logically.
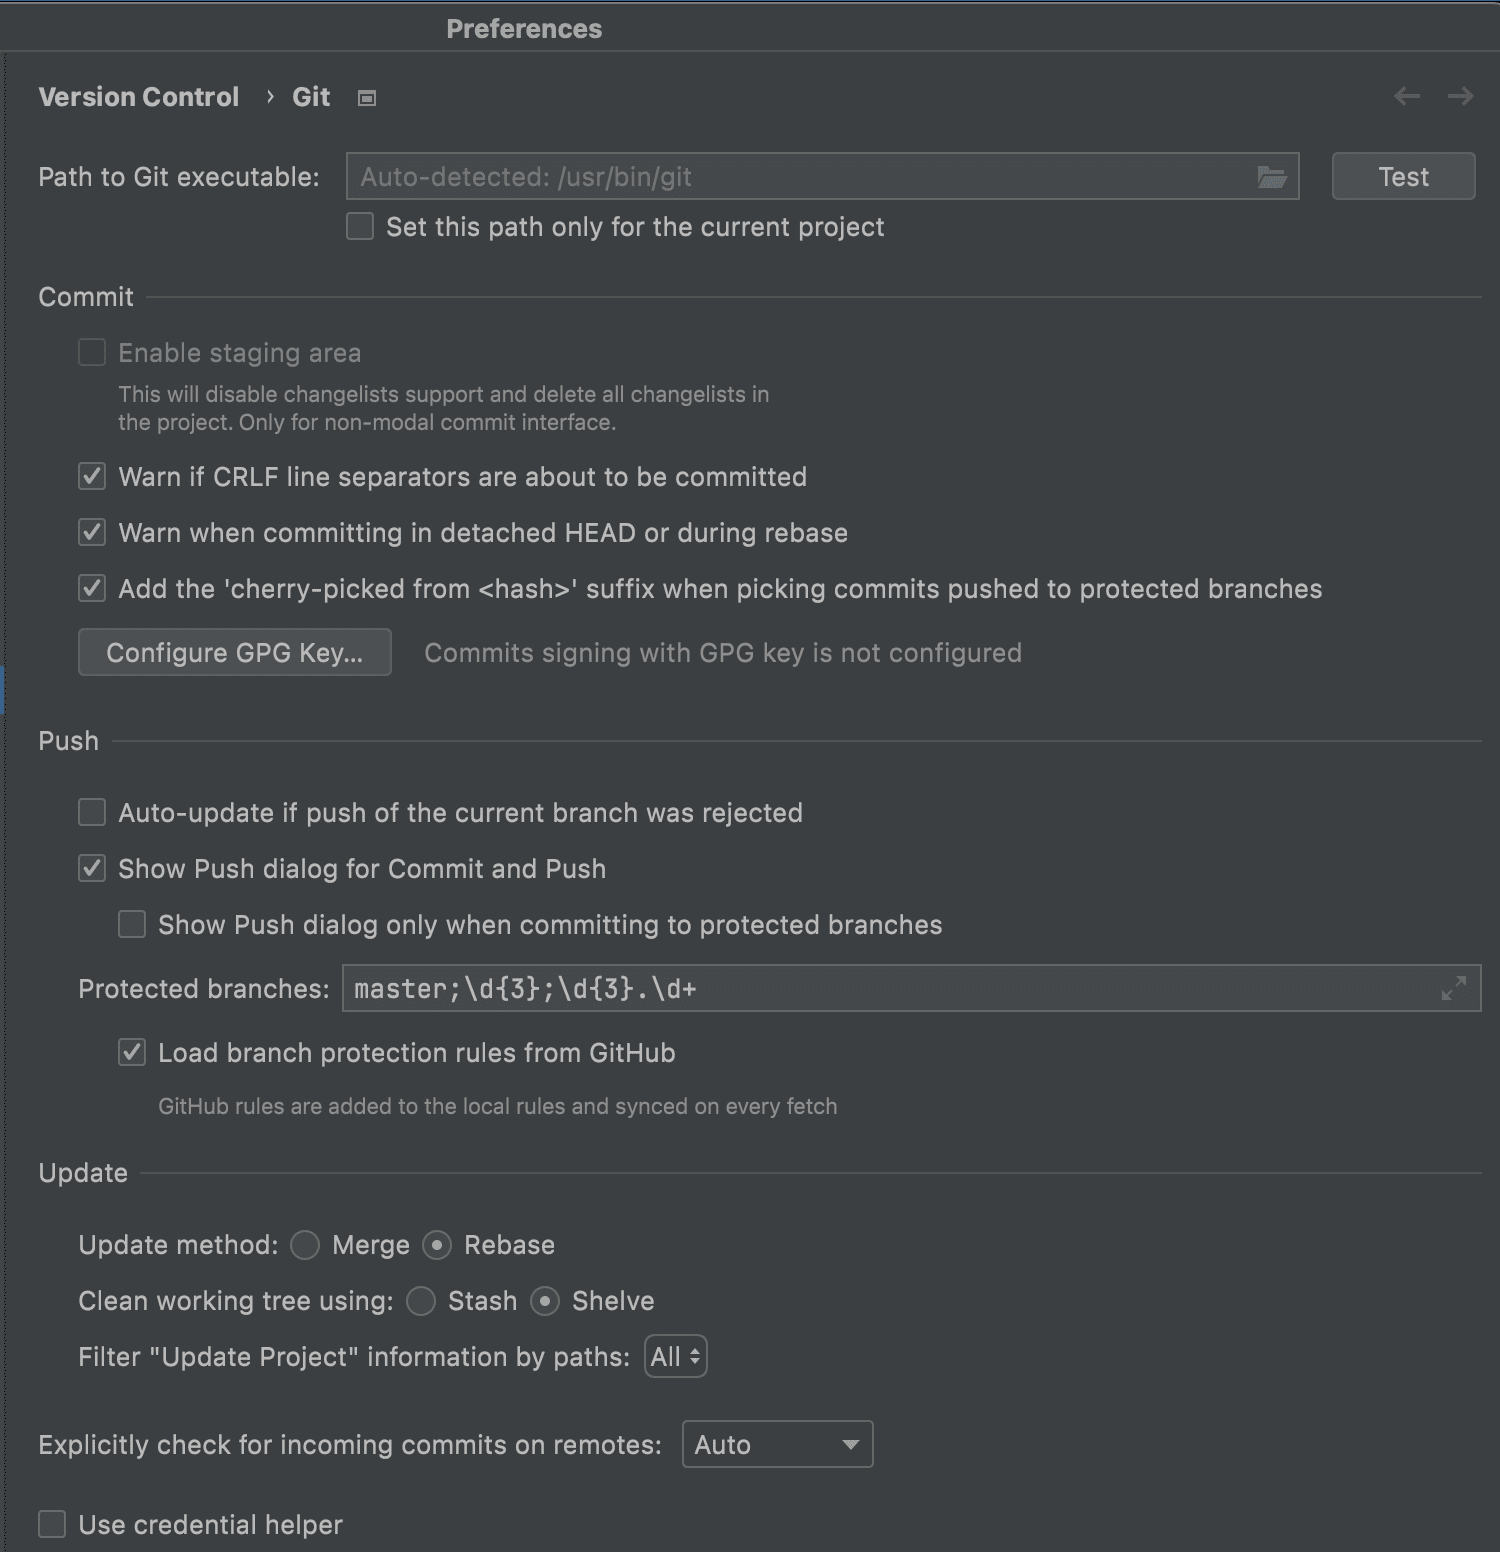
We’ve added a separate node for Directory mappings, and the background operations are now switched on by default. The Background node no longer exists.
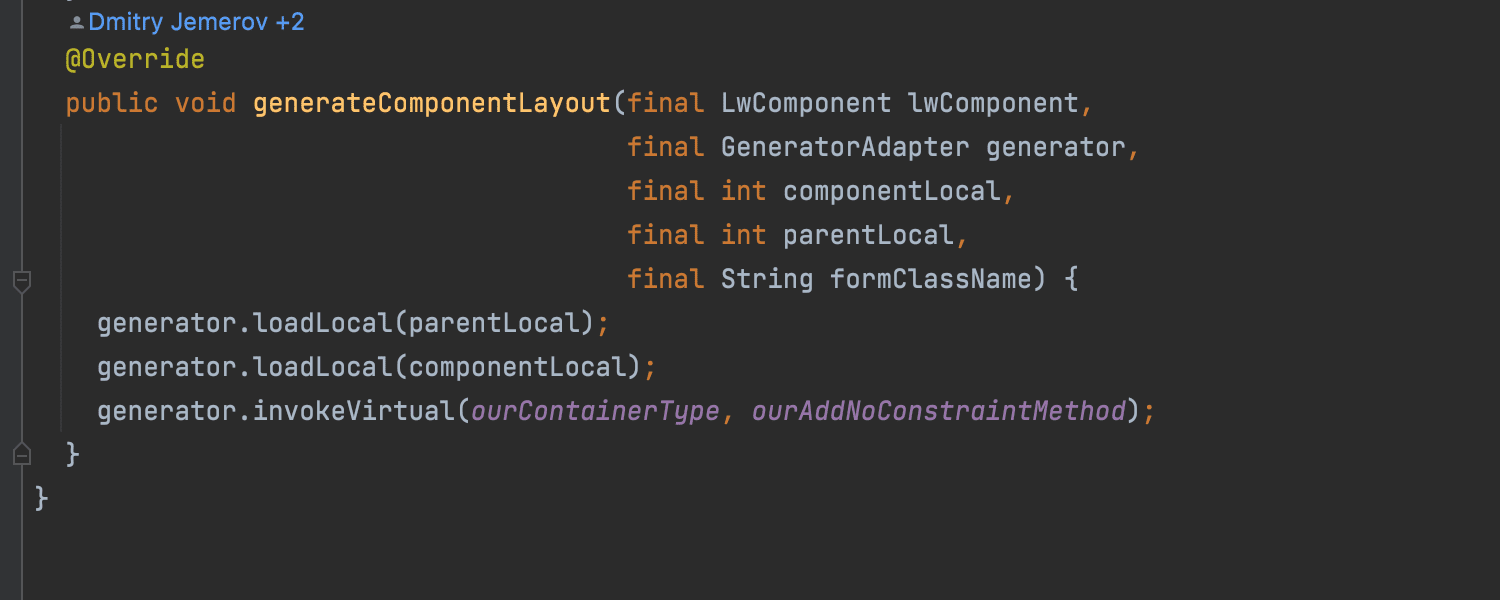
New inline hint
In this EAP, we’ve introduced a new inline hint that appears above blocks of code and displays the name of the developers who wrote them. When you click on the hint, the IDE shows you a list of annotations for the current file. This update is available for Java and Kotlin.
This is an experimental feature, and we would love to get your thoughts about it. Do you like it? Do you find it useful?
Java
Improved refactorings
When you introduce a local variable in Java, you can:
- Declare it as final.
- Choose between an explicit type or var type (in Java 10+).
In previous versions of IntelliJ IDEA, it was possible to configure these settings in a popup that appeared automatically. Though this could be convenient when you needed to change your preferences quickly, the popup hid the code you were writing, which was a disadvantage. In an attempt to improve this, we’ve reworked the popup so it no longer appears by default. Instead, you can access these options by clicking the gear icon next to a variable or by using the⌥⇧O shortcut on macOS or Alt+Shift+O on Windows.
We’ve also improved the Introduce parameter refactoring. When you invoke this refactoring, with ⌥ ⌘ P on macOS or Ctrl+Alt+P on Windows or Linux, the IDE asks you where you want to replace occurrences. After you make this selection, a gear icon will appear, and clicking on it will allow you to configure more settings for the refactoring.
Quality Enhancements
This build comes with the following notable fixes and improvements:
- Fixed the File mask field in the Find in Path dialog so it shows available options in the drop-down list. [IDEA-236785]
- Fixed the spellchecker. It now recognizes words with apostrophes. [IDEA-246846], [IDEA-266236]
- Fixed the Diff tab so it shows the correct file name when comparing files. [IDEA-269958]
- Fixed the annotation panel so it displays the same theme as applied to the whole IDE. [IDEA-233913]
- Fixed formatting for the YAML code formatter. [IDEA-199963]
That’s all for week two. You can find all the other changes in the release notes. Please share your feedback on the new features and updates in the comments below, and report any issues you encounter to our issue tracker.
Happy developing!