IntelliJ IDEA
IntelliJ IDEA – the Leading IDE for Professional Development in Java and Kotlin
Make Your New Year’s Resolution: Code Quality

Is improved code quality high on your list of priorities for the New Year? It can be hard to add static analysis to a project. But fear not, we are here to help you meet your New Year’s resolutions. If you have been thinking about using quality gates for your project but don’t know where to begin, reading this post is a good starting point. You can bring the code inspection you are familiar with from IntelliJ IDEA to any CI with JetBrains Qodana – the new code quality platform for the JetBrains family of tools.
You don’t need to wait until the first week of January to work on your New Year’s resolutions: you can work on them now, and get the New Year off to a great start.
Start with a local run and create a baseline
Let’s start with your local machine. If you use IntelliJ IDEA and are familiar with code inspection profiles, you can re-use them in your Qodana run. If you are unsure of what server-side analysis fits your project best, you can start with Qodana’s default options. We introduced three-phase analysis precisely for this case.
Follow these steps to run Qodana on your project:
- Pick the proper Qodana linter for your project’s technology stack and pull its image:
docker pull jetbrains/qodana-<linter>
Options include qodana-jvm-community, qodana-jvm, qodana-jvm-android, and so on.
- Perform the first run:
docker run --rm -it -v <project-root-directory>/:/data/project/  \
-p 8080:8080 jetbrains/qodana-<linter> --show-report
- After the analysis is complete, you will see an invitation to check the results. Open Qodana UI in your browser using this link: http://localhost:8080.
You will see a page that looks like the example below.
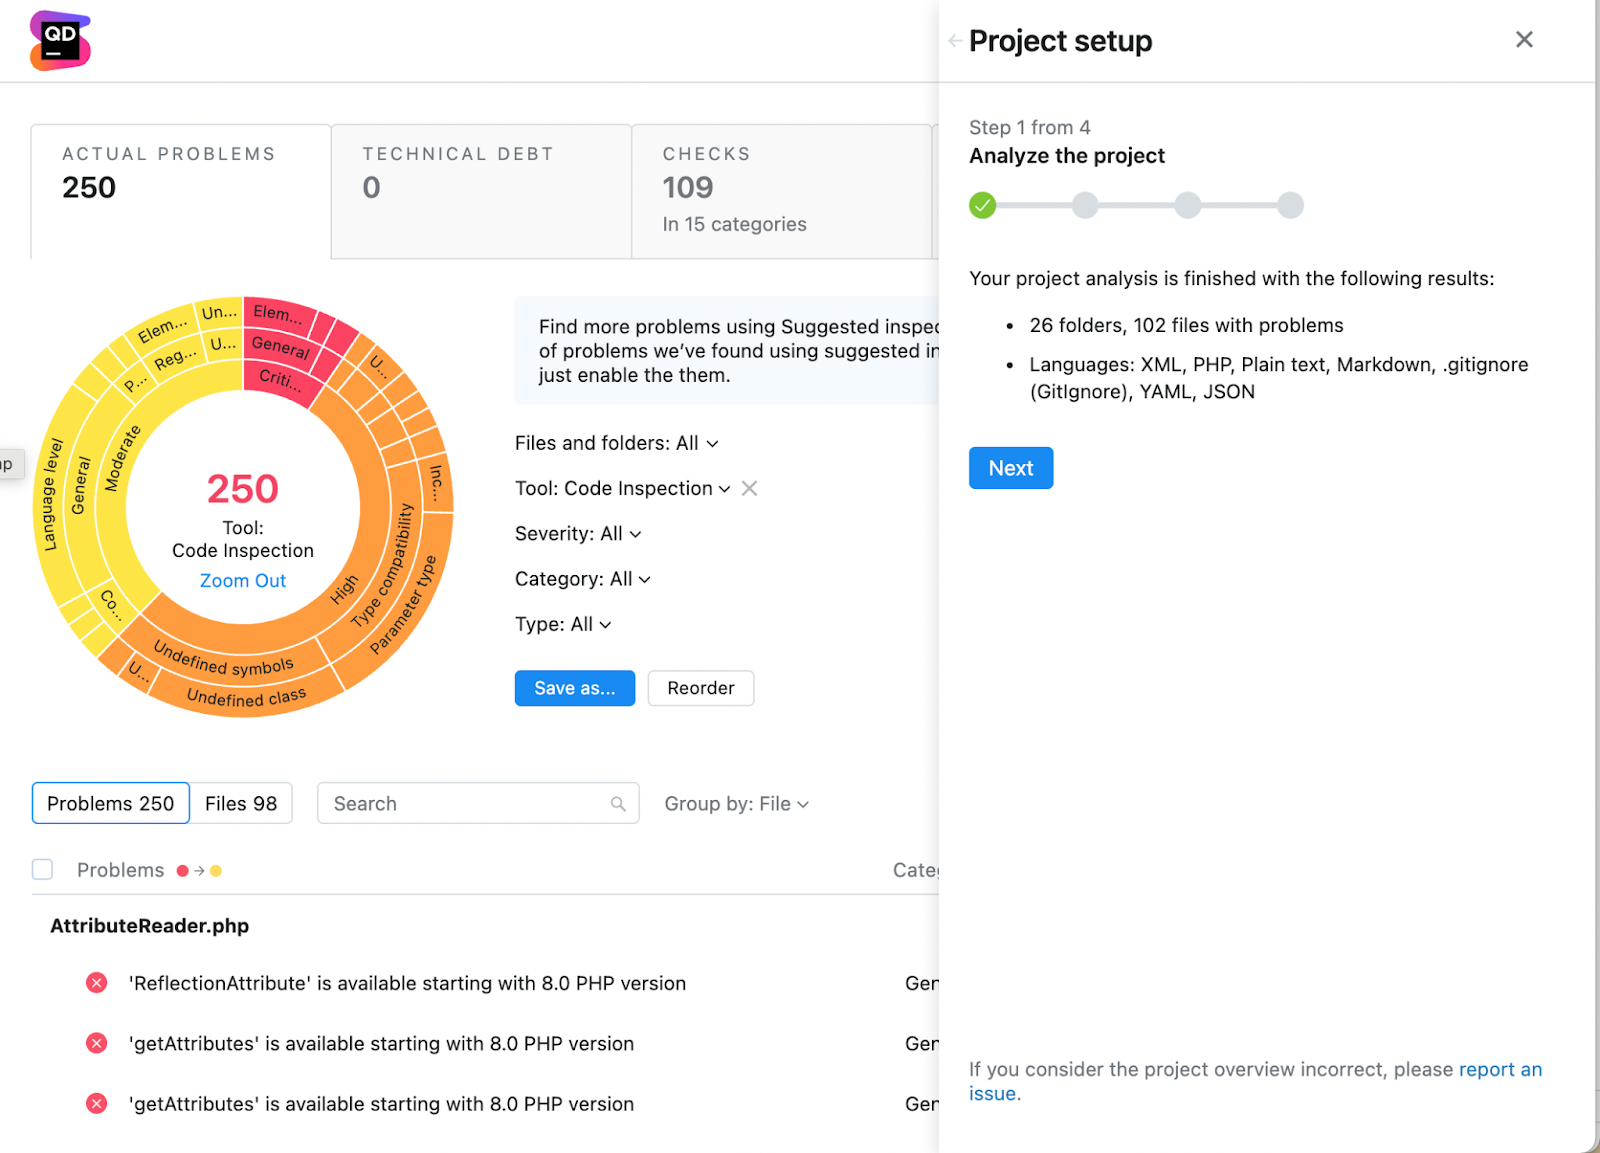
During this first run, Qodana analyzes your project using vital checks only. Non-vital checks and folders containing non-vital code, such as the Tests folder, are ignored. Qodana also reports any conditions that could affect the truthfulness or completeness of the results. For example, if your project relies on external resources or generated code that is unavailable during the analysis, the final results could be compromised. Qodana notifies you about such suspicious results. We encourage you to follow the guidance during project setup and tune the configuration. After the first run, everything you need will be at hand. You can review every problem in the left-hand panel, and you will see immediately how your adjustments affect the number of issues you need to work on.
Our favorite step is the third one – putting all the detected problems into a technical debt (baseline).
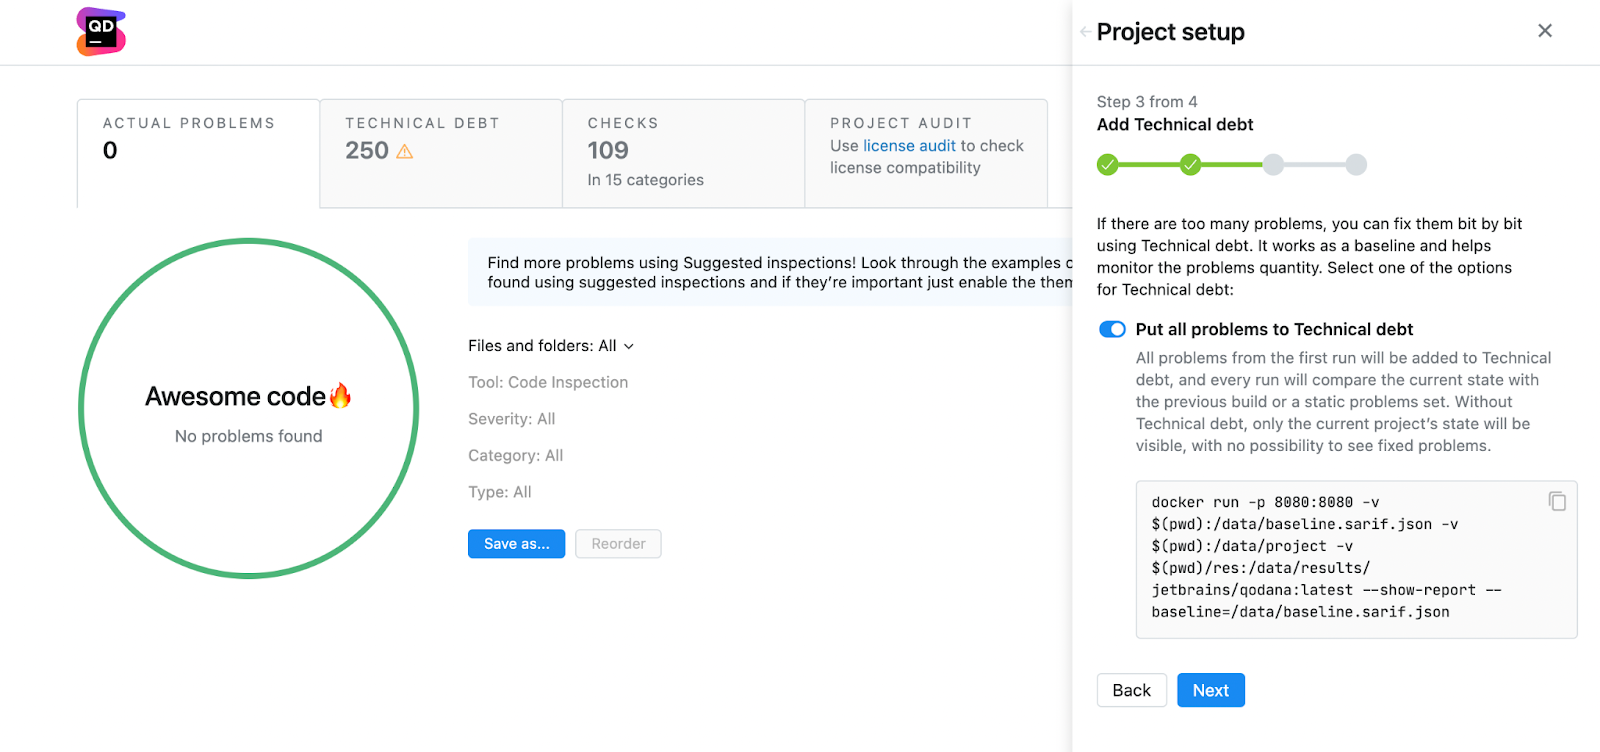
Why put everything in a technical debt (baseline)? Well, bringing the number of problems in your code down to zero is quite simple, really: first, fix all existing issues; second, ensure no new problems appear over time. The second part may be easier than the first one, and by using the baseline, we set the current project state as the initial one and only track new issues that appear.
The last step in the project setup is downloading two files: qodana.yaml and qodana.sarif.json. Just place them into your project folder, and be sure to copy the suggested Docker command.
A local run with the baseline enabled
Now return to your console and run Qodana again using this command:
docker run -p 8080:8080 \
-v <project-root-directory>:/data/project \
jetbrains/qodana-<linter> --show-report \
--baseline=baseline.sarif.json
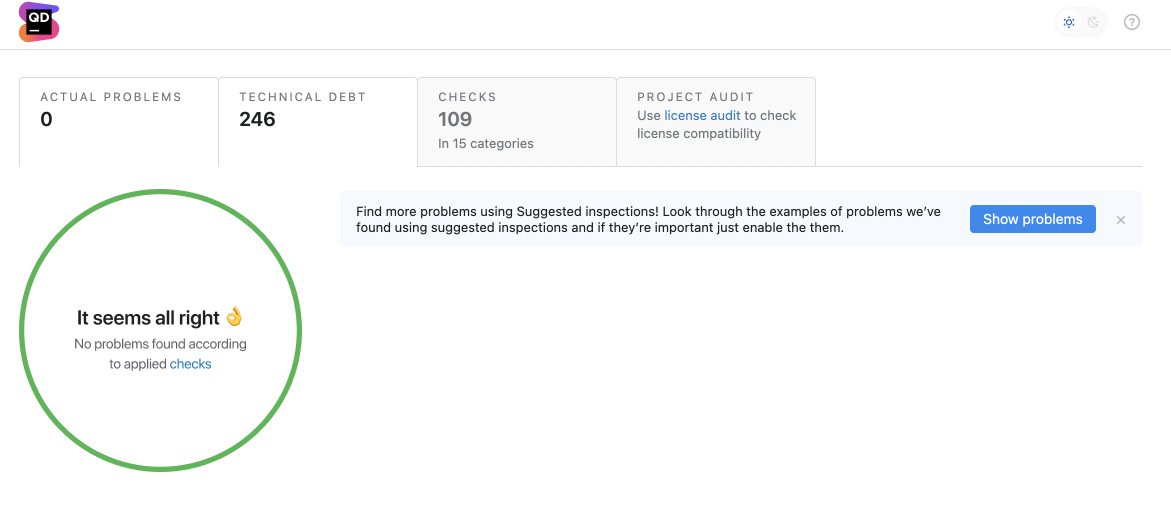
Please ensure you use the proper Docker image name.
You will see something similar to the example below. Qodana now treats all of the previously discovered issues as the baseline and does not report them again.
Add even more checks
At this point, you are ready for the next step – setting the quality gate in your CI. If you want to get started with that right away, feel free to jump right to the Quality gate section of this post.
But if you are feeling adventurous, you can examine the suggestions Qodana prepared for you, and perhaps enable even more checks. Use the Problem examples dialog to see the checks we suggest, as well as some examples in your codebase that need improvement according to those rules. If you find them appropriate, turn them on, download the updated qodana.yaml file to the project root folder, and run Qodana locally again to perform the same triage using even more checks.
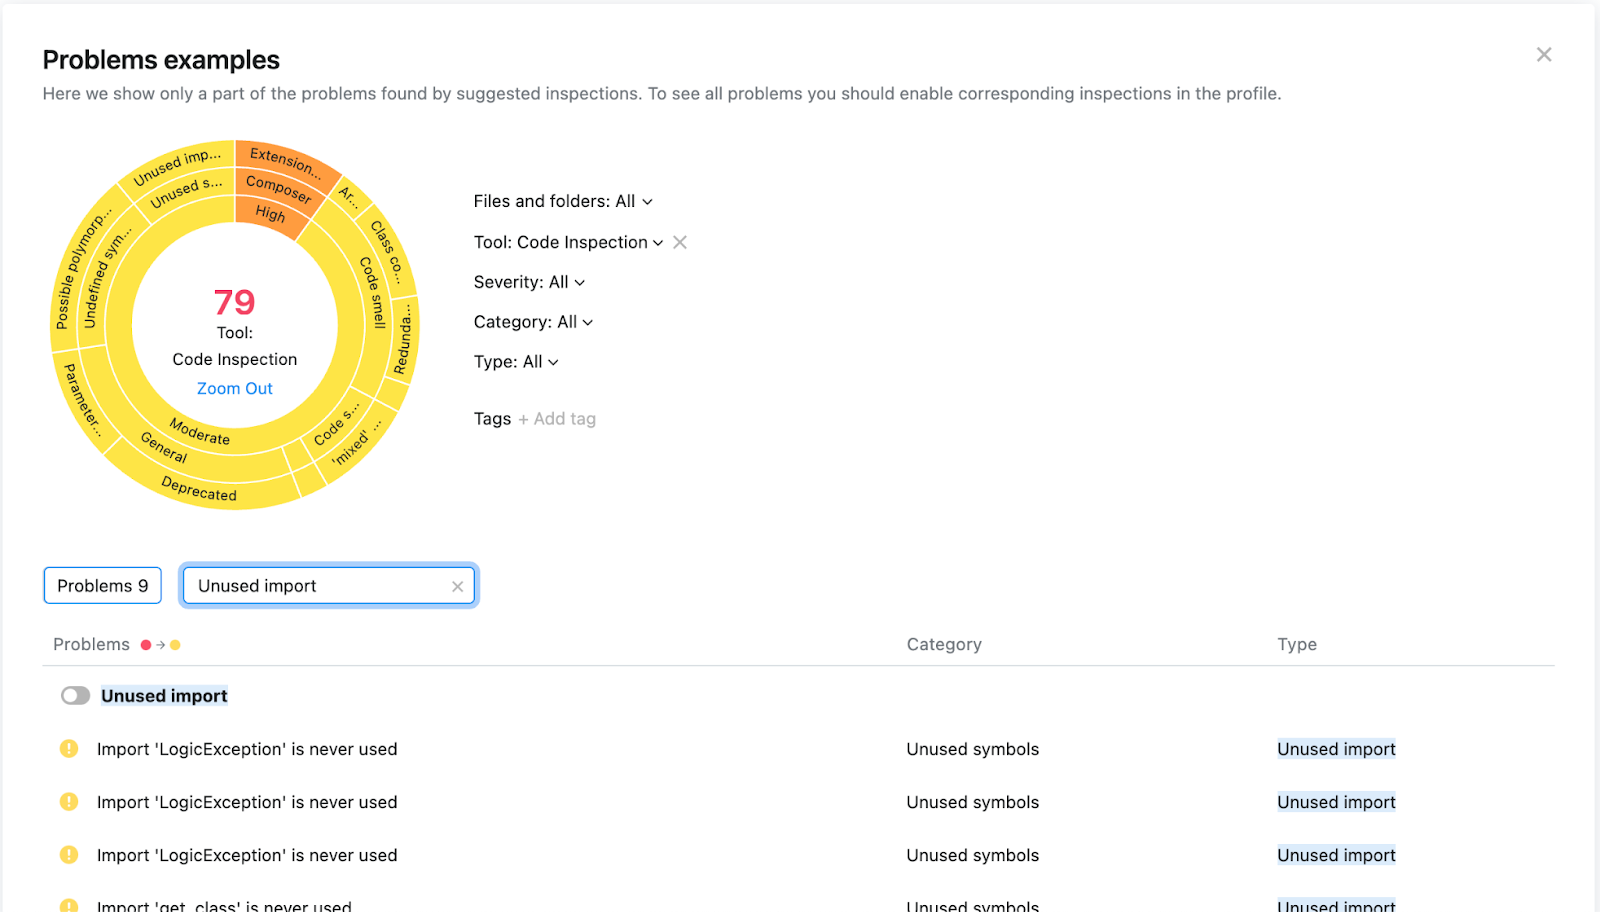
You can repeat the previous steps again and again, thereby tailoring your configuration further.
When you are happy with what you see locally – it’s time to set a quality gate for your CI pipeline.
Quality gate for the CI pipeline
One good thing about Qodana is that you can add it to any CI platform. But since it would be hard to cover all integration-related nuances in a single blog post, we will describe its integration with GitHub Actions. The process of setting up quality gates is very similar in all other CI platforms, too, with the exception of TeamCity. In TeamCity, we would suggest you use our dedicated plugin.
So, if you use GitHub Actions as your main CI platform, follow these steps to set up quality gates:
- Add
qodana.yamlandqodana.sarif.jsonto your VCS. If you findqodana.sarif.jsonis too big to be placed in your VCS, you can store it anywhere it is accessible for your GitHub Actions. - Add the Qodana GitHub Action to your workflow by following the instructions in our documentation.
- Set the workflow to run on pull_request events that target the main branch.
on:
  pull_request:
    branches:
    - main
- Add the fail-threshold option with a value of 0 to the Qodana Action, as well as branch protection rules to any branch you want to protect. We suggest starting with the main branch.
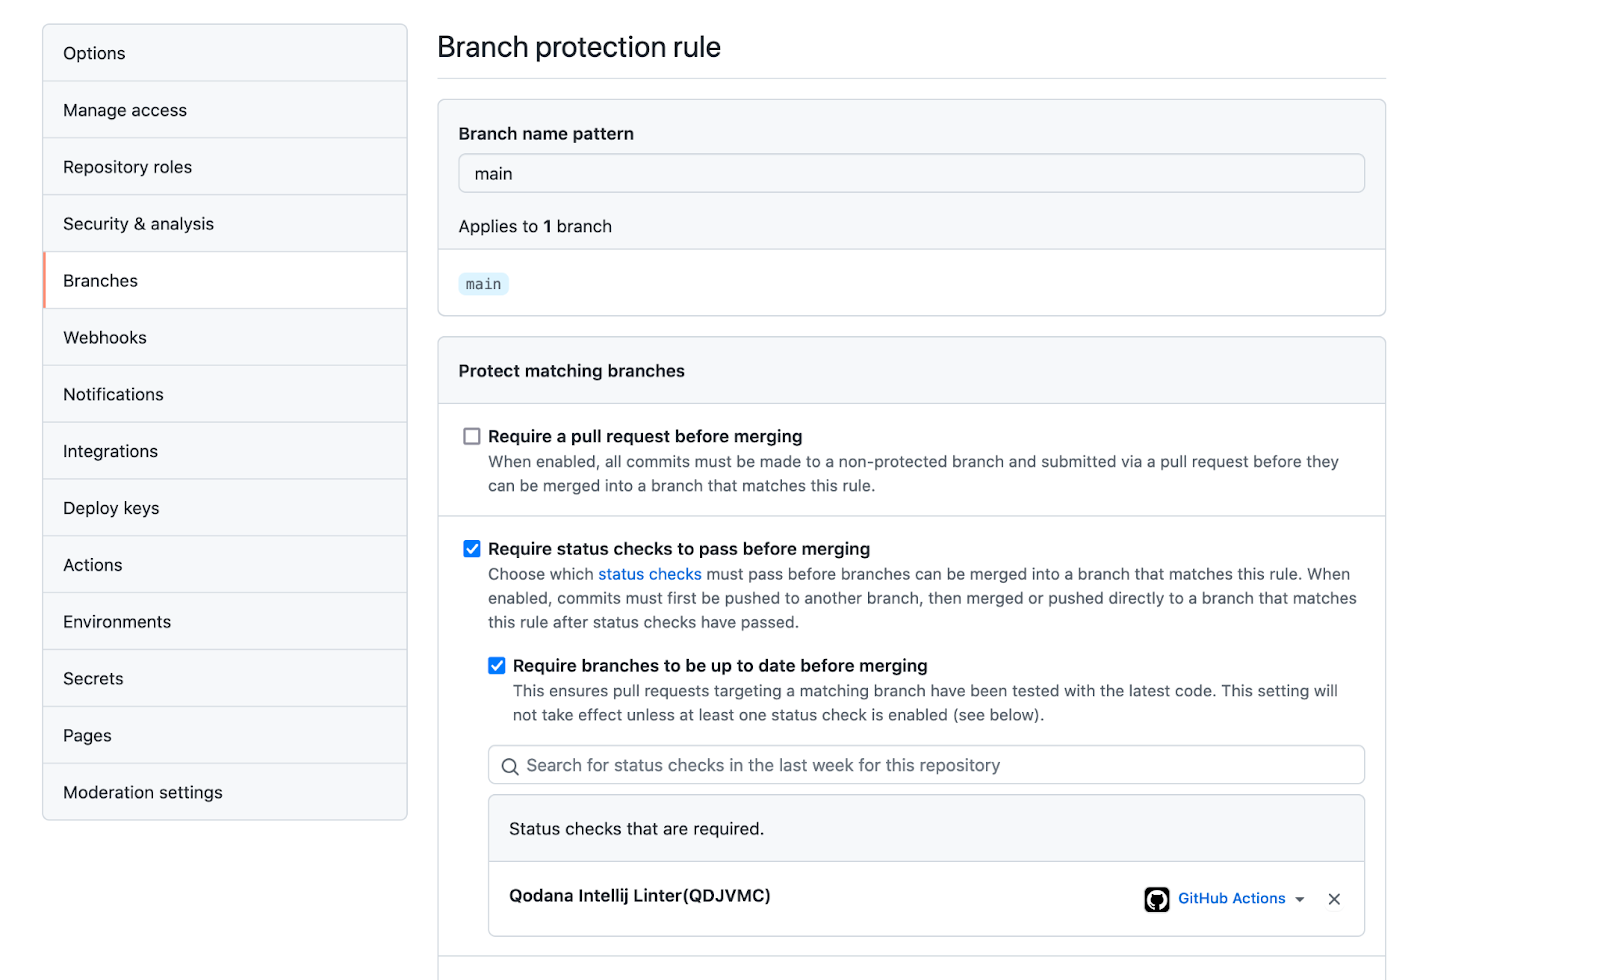
For more information about branch protection rules, refer to the GitHub Documentation.
Now you are all set! Your changes will be checked by Qodana so they will meet your standards. You can use this action as a proper quality gate. For example, you can check incoming pull requests and merge only those whose quality is up to your standards. If your most common scenario involves developing in branches, you can add this action to make sure the whole branch is checked before being merged into the main branch. Actually, you can include a Qodana Action in any part of your pipeline and use the produced artifacts and resulting exit code as the basis for further decisions.
And if, like us, you like making New Year’s resolutions, you can make a plan to work on the issues from the baseline one step at a time in 2022. Qodana UI will help you plan out this work, e.g. you can choose issues to be fixed by category, or folder, or just one-by-one.
When you reach zero issues in the actual list and the baseline, it will be time to go to the ‘next level’. You can turn to Qodana’s suggestions for inspiration, or study the whole list of checks to add more of them to your profile.
By the way, Qodana is extensible: you can create your own checks. We will cover this topic in a dedicated blogpost at the beginning of next year.
Try it now and improve your code
Check out the website to download the version of the components that’s suitable for your technology stack. Some of them have already reached stable releases, and some are available under an Early Access Program (EAP). Don’t wait to set yourself up to meet your code quality goals in the new year. Future you will thank you!
Feedback
We would be grateful for any feedback you have, and all ideas are welcome! Contact us at qodana-support@jetbrains.com or via our issue tracker.
Your JetBrains Qodana Team
The Drive to Develop