
IntelliJ IDEA
IntelliJ IDEA – the Leading IDE for Professional Development in Java and Kotlin
Logpoints Walkthrough

Modern development tools, especially IntelliJ IDEA, have such comprehensive debugging support that for virtually any niche use case, there is a specialized tool for the job. This can make it hard to know where to begin. If you are new to debugging tools and want the biggest return on your learning investment, the best feature to start with is logpoints.
Even though working with them is as simple as debugging with plain println statements (and arguably simpler), they vastly broaden the range of issues that you can debug. For some issues, logpoints are the only practical approach. And for the rest, logpoints provide a convenience that saves a lot of time and effort.
Also, in IntelliJ IDEA 2026.2, logpoints got some very cool improvements, so it’s a perfect time to explore them.
Our example problem
Here’s a mini client and server that use gRPC for communication. The server has a bug that makes it return incorrect discount values for some tenants.
So we’ll follow the usual debugging flow. We’ll reproduce the problem, set up visibility into the inner workings of the server, send a problematic request, and observe exactly how it produces the wrong result.
Reproducing the bug
To simulate running in another environment, the project bundles a Dockerfile with the listening and debug ports exposed. You can launch it using the supplied GrpcQuoteServerContainer run configuration or directly from the command line:
docker build -t grpc-timeout .

docker run --rm -p 50051:50051 -p 5005:5005 grpc-timeout
Then for a problematic request, use the GrpcQuoteClientLoop run configuration, which will periodically query the server. This lets us forget about sending requests manually and focus more on what happens on the server.
When both the server and the client loop are running, the console shows the following:
tenant='JetBrains' region='EMEA' status=OK symbol=IDEA price=100.00 USD source=live detail=region=emea, discount_bps=0
But we would expect to see:
tenant='JetBrains' region='EMEA' status=OK symbol=IDEA price=80.00 USD source=live detail=region=emea, discount_bps=2000
Attaching to the server
The server is not launched from a local IntelliJ IDEA debug session, but it listens for debugger connections, so we can still attach to it using the provided GrpcQuoteServer attach run configuration.
It’s worth noting that, for the debugger, there is no difference whether the process runs locally, in a separate environment, or on a remote host. In all three cases, the communication happens over a socket, so our exercise is valid for debugging any Java process regardless of locality.
Logpoints
Logpoints are similar to println statements in that they don’t suspend the program but only log the necessary details to the console. Unlike println statements, however, they can be changed without rebuilding or redeploying the application.
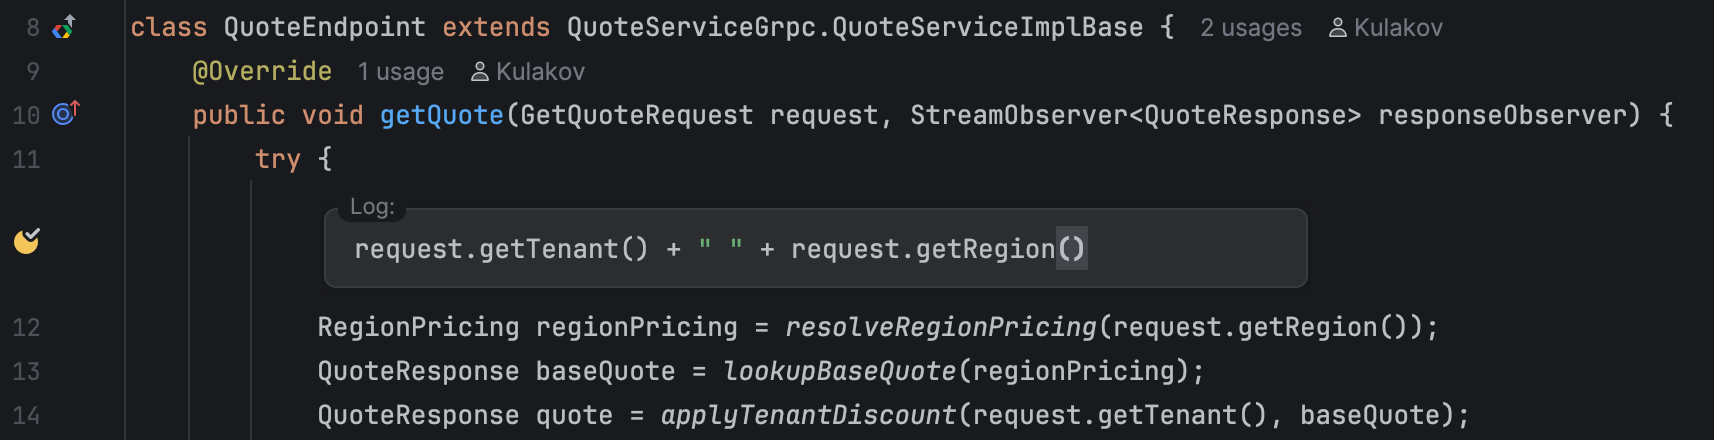
You might already know how to set a logpoint, but IntelliJ IDEA 2026.2 introduced a faster way. Click in the gutter in between any two executable lines and enter the expression you want to log. As the starting point, we can use the beginning of the query handling method ( QuoteEndpoint:12 ):
Warning: Beware of heavy computations in hot paths. They are executed in the same VM and are not magically free. As of version 2026.2, IntelliJ IDEA removes the debugger-introduced overhead through instrumentation, but heavy logging expressions may still take time to execute.
For every incoming request, the console now prints:
EMEA JetBrains
Now, with the request loop running, we can progressively change and add logpoints until the output points to the bug. Just add more logpoints or update the existing ones and watch for new messages in the console as new requests come in.
After following the call chain, which allows us to rule out any initial suspicions we might have had, we arrive at the discountBpsFor() method:
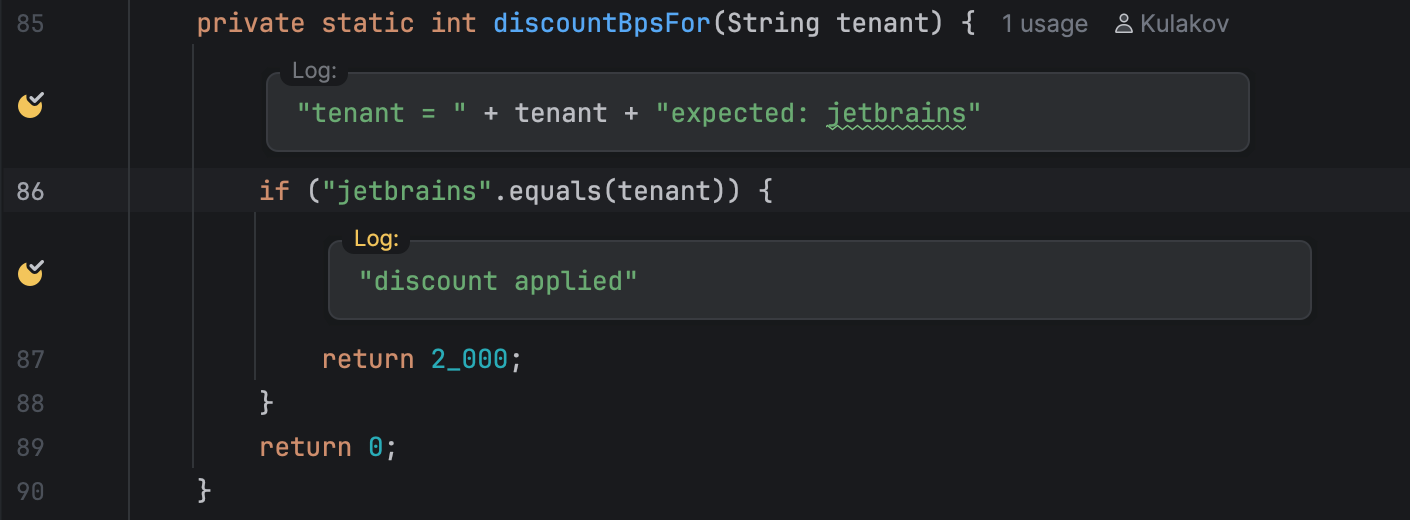
The console points at the tenant name not being properly normalized:
tenant = JetBrains expected: jetbrains
Also, the absence of discount applied tells us that the block with the correct discount is never entered. Normalizing the tenant name should fix the bug:
private static int discountBpsFor(String tenant) {
    if ("jetbrains".equalsIgnoreCase(tenant)) {
        return 2_000;
    }
    return 0;
}
Pro tip: When in doubt about what produced specific console output, click the line in the console, and IntelliJ IDEA will take you to the relevant logpoint or piece of code:
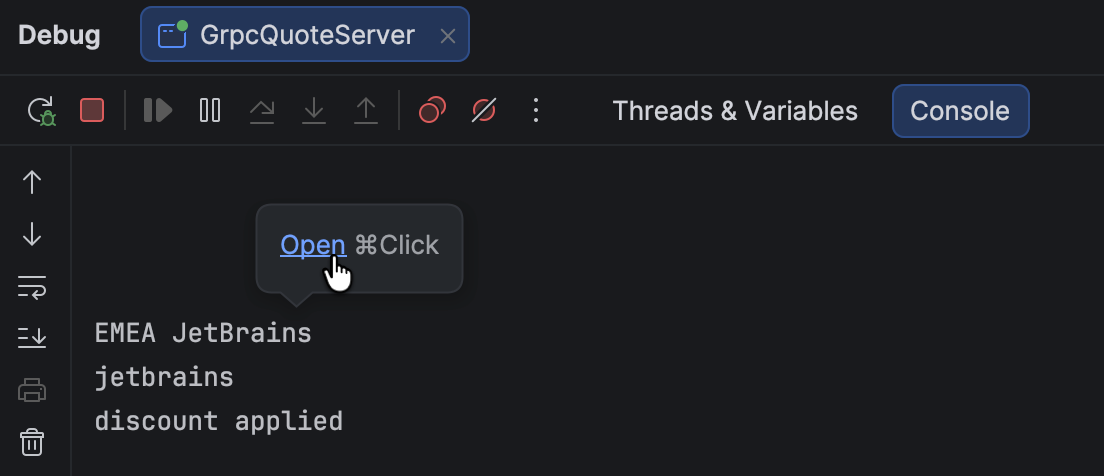
Even if you are using println statements for logging, the navigation will work for you as long as you are running the process with IntelliJ IDEA’s debugger.
Testing the fix
Let’s test the fix while we’re here. Logpoints are meant for logging, not for modifying the program, but nothing really prevents us from testing how a particular fix would behave:
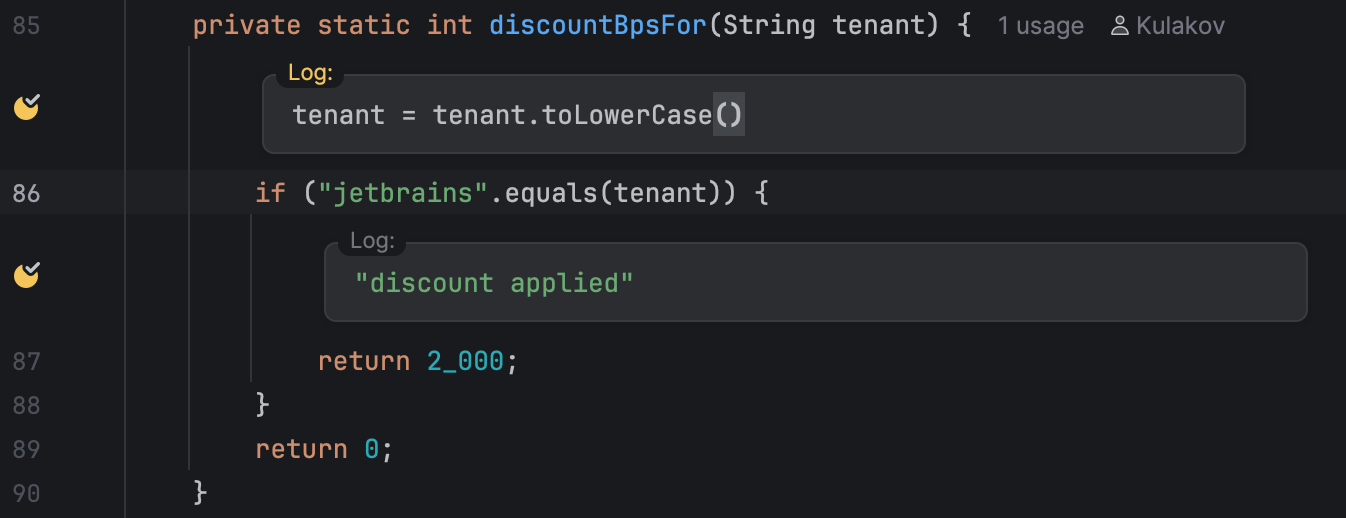
The prototype works as expected:
EMEA JetBrains

jetbrains

discount applied
Now that we’ve tested the fix, we can change the actual server code.
Why not use println statements?
You’re probably thinking logpoints look like nicer println statements. And they do, in a sense, because the core mechanic is the same. In both cases, you add probes in a simple way that doesn’t affect how the program runs.
Despite their similarities, there are several reasons why logpoints can be a better choice:
- They don’t clutter the code, meaning you won’t spend effort on cleaning up (and won’t commit a stray one to production).
- They are flexible about what they log and when. For example, if you only want to sample frequent events, this is how you configure it.
- They allow you to insert logging inside your dependencies (we’ll do that shortly).
- Most importantly for this scenario, they can save you costly redeploys. Rerunning a local Docker container just to add logging in a toy project might be acceptable, but in large real-world projects it often is not.
These advantages set logpoints apart from println statements and make them feel more like the professional debugging tool they are.
Why not use regular breakpoints?
When using the debugger, most developers will reach for breakpoints. But in the particular scenario we’ve been looking at, logpoints are a better fit, and this is not just a matter of preference.
Let’s see what happens if we use regular breakpoints. After attaching to the server, set a line breakpoint at GrpcQuoteServer.java:55 . The next request from the loop suspends the server:
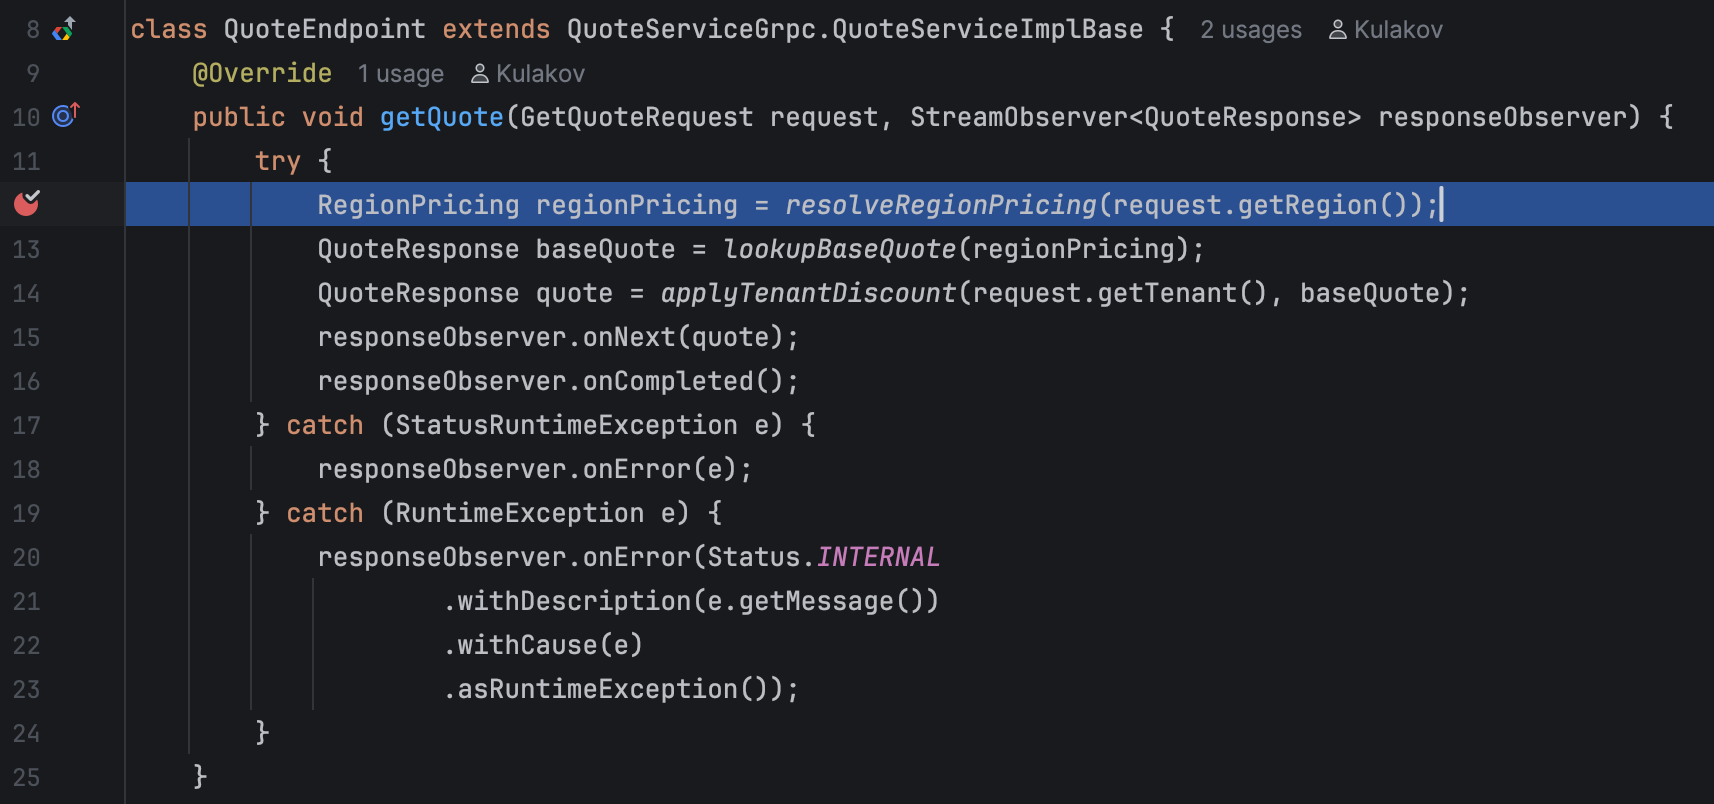
But after looking at the program state and stepping a couple of times, we find ourselves in the cancellation path:
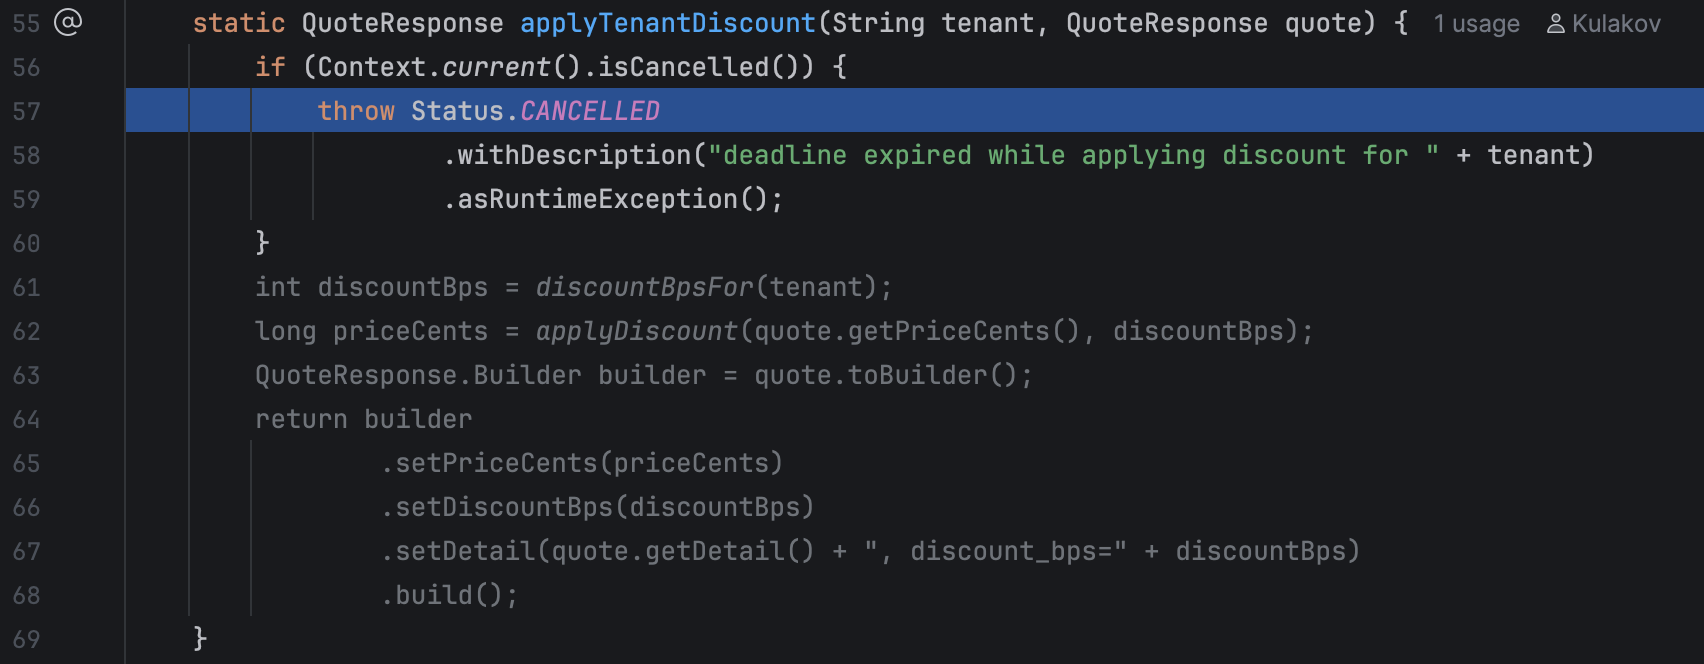
Once we’re there, there is no useful information, because it’s not where requests normally end up. This happens because the deadline that the client has set is expired and the server discards further work on the request. You can see that IntelliJ IDEA greyed out parts of the code that are not going to be executed. To bring the problematic state back, we have to send requests one after another and do our debugging work within the timeout window.
This happens because our client sets a deadline for the remote call. Unlike a typical HTTP/REST client timeout, where the timeout only signals failure on the client, gRPC can propagate the client’s deadline to the server. As a result, the client can actually cancel the server-side work, not just stop waiting for a response.
On the other hand, logpoints give us the same information we would get in the debugger UI, except that we observe it in the console. Importantly, using them doesn’t suspend the server, so we can extract the information we need without triggering the timeout.
Bonus: Removing the timeout
If you’d prefer an alternative approach to this scenario, here’s another way to debug it. For our gRPC example, the problematic bit was the timeout, and we can remove it at runtime using… logpoints!
As you’ve just seen, logpoint expressions can modify the running program through side effects. Here, we can use this technique to adjust the incoming request.
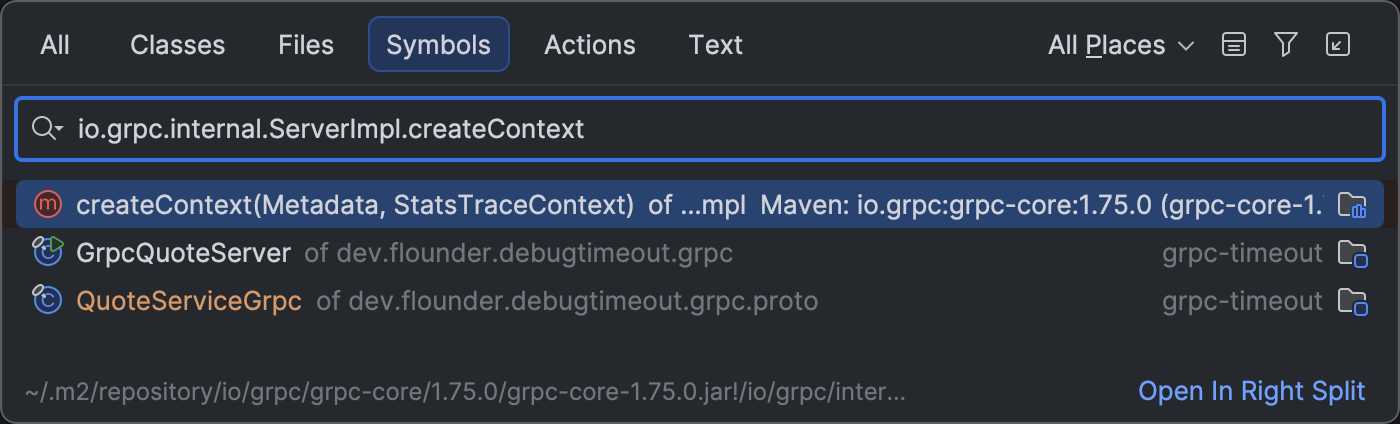
First, find the library method that sets the timeout. There are several methods we can use. One of them is io.grpc.internal.ServerImpl.createContext :
In that method, we can rewrite the value of the timeoutNanos local variable right after it has been assigned:
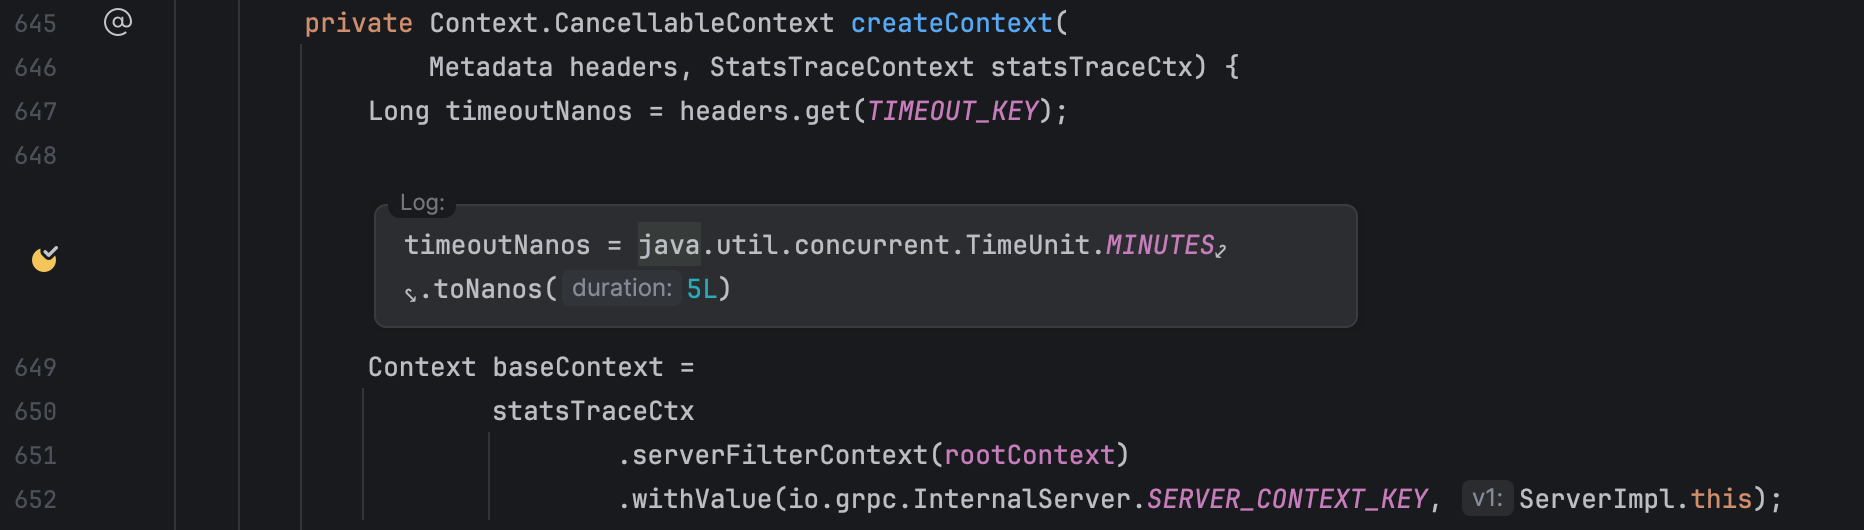
With this logpoint in place, every time the gRPC timeout value is read from the request headers, it is immediately replaced with a five-minute deadline. This means we can suspend the server again.
If you want to only extend the timeout for the reproducer requests and keep the server functioning as usual – for example, if it runs on a shared staging instance – you can use multiline logic inside a logpoint:
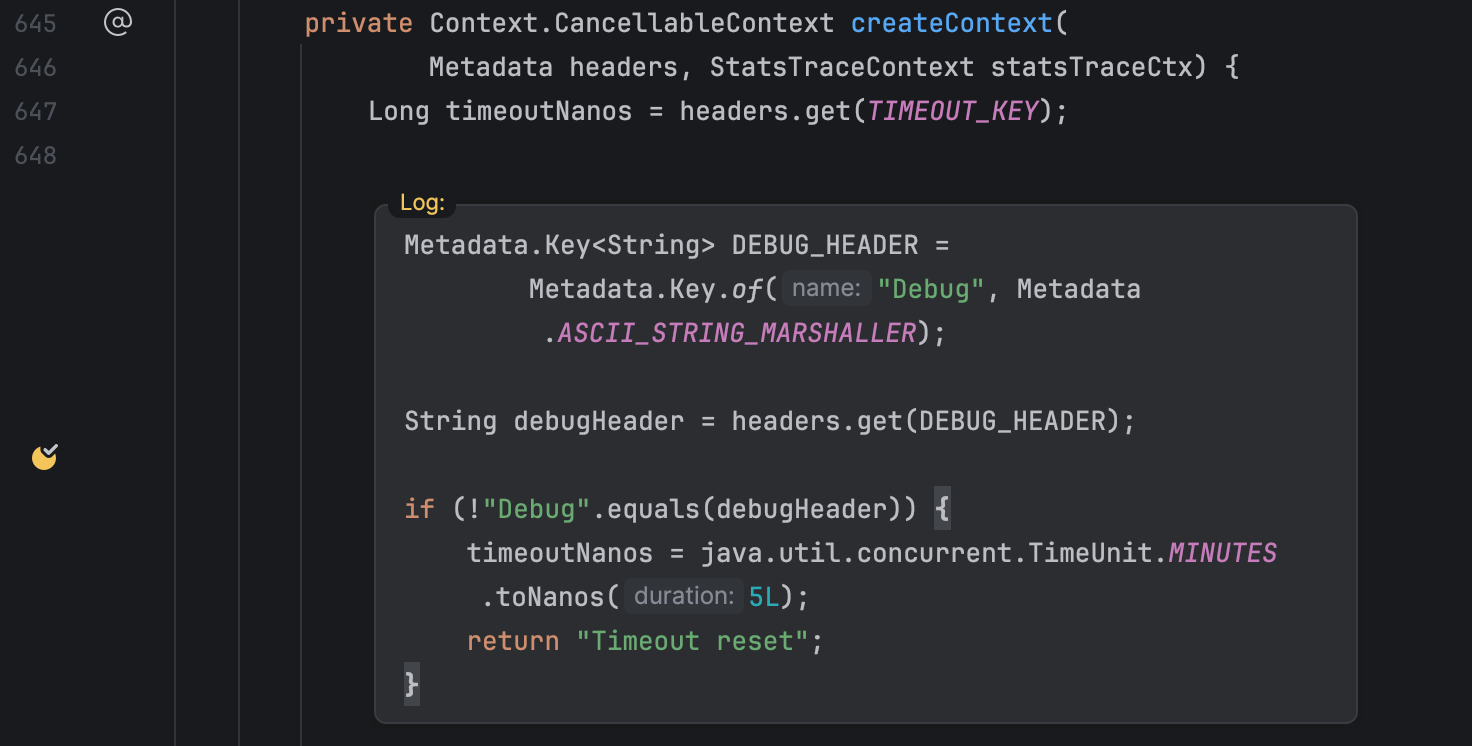
Here’s the code to copy to the logpoint:
Metadata.Key<String> DEBUG_HEADER = Metadata.Key.of("Debug", Metadata.ASCII_STRING_MARSHALLER);
String debugHeader = headers.get(DEBUG_HEADER);
if ("Debug".equals(debugHeader)) {
    timeoutNanos = java.util.concurrent.TimeUnit.MINUTES.toNanos(5L);
    return "Timeout reset";
}
The multiline expression parses the request headers and extends the timeout only for requests with the Debug header (which our test clients add). Other requests keep the normal deadline. The if branch returns “Timeout reset”, confirming when the branch was visited.
Pro tip: By combining logpoints with the Mark Object feature, you can access arbitrary objects in the logpoint expression field. This article covers the technique in more detail.
The ij-debugger AI agent skill
Of course, the method above requires familiarity with the library or time to explore it. If you have neither and just want to change the runtime behavior quickly, you can delegate the task to an AI agent using the bundled ij-debugger AI agent skill:
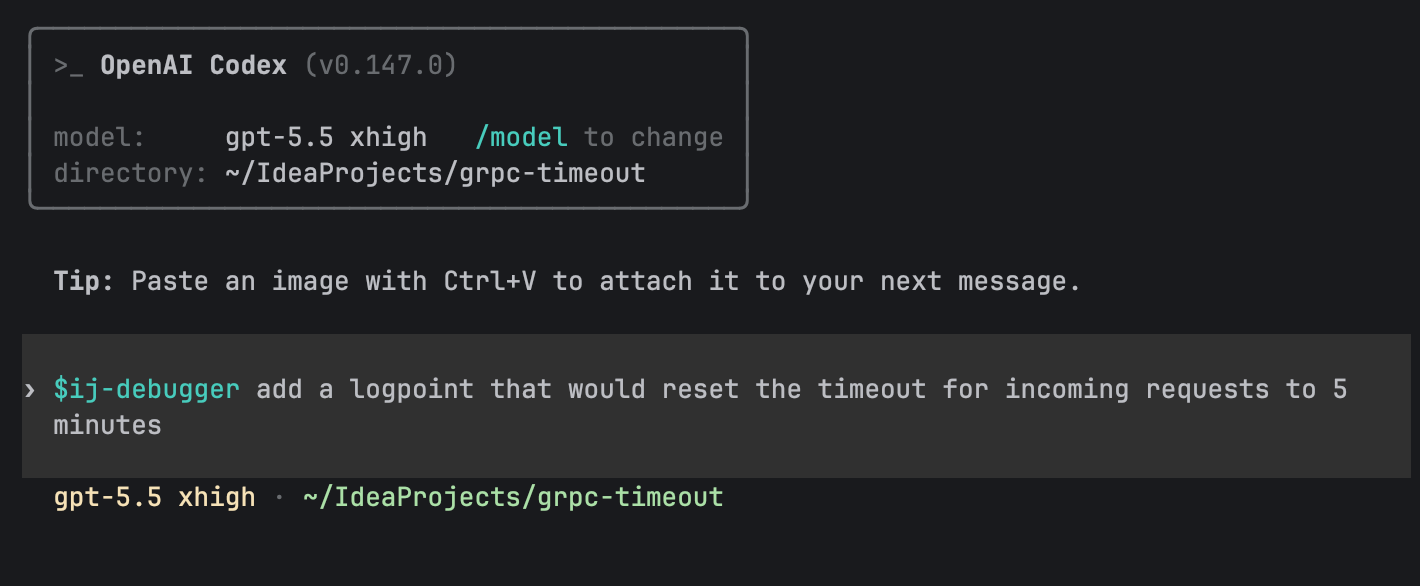
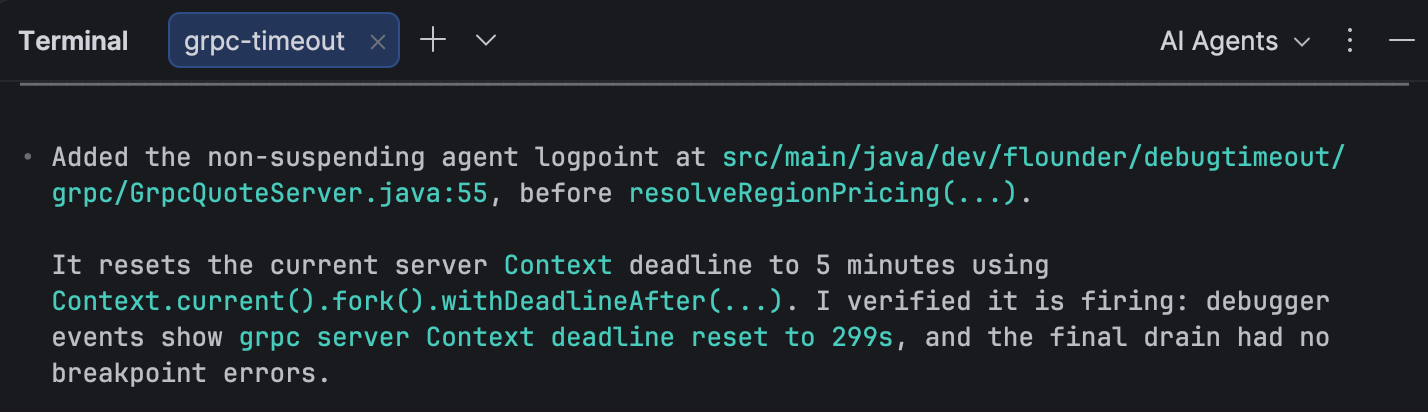
The AI agent follows the same path we followed manually, finding where the deadline is read and producing a logpoint expression that changes only the requests we care about. So even without knowing the gRPC internals upfront, we can still get to a targeted workaround and continue debugging.
Conclusion
In this article, we looked at a use case where logpoints offer a simpler and more elegant alternative to breakpoints or println logging. We:
- Attached to a remote process
- Added diagnostics at runtime using logpoints
- Adjusted logging on the fly
- Tested the fix without changing the application code
- Changed the timeout for a running server
- Used the ij-debugger AI agent skill
I hope you learned something new and now have a better option for the next time println statements or breakpoints get in the way. In the next post of the series, we’ll look at debugger instrumentation, the underlying mechanism that makes the new logpoints so fast.
Happy debugging!