Debugging Improvements in PhpStorm 9

PhpStorm 9 brings you significantly redesigned debugging experience. We’ve already blogged about Inline Debugger and how all live debugging data are shown directly in the editor, with variable values integrated smoothly into the current editor’s look-and-feel. Today we’d like to talk about other improvements in debugging and debugging configuration validation workflows.
In short, an even more convenient Web Server Debug Validation is now available from the Run menu, providing additional information on possible debug configuration errors. Many configuration hints are provided as tooltips as well. php.ini can now be opened for editing from the settings. Finally, all the required assistance is provided to get the debugger up and running in a few minutes.
Let’s explore these changes in detail!
Web Server Debug Validation
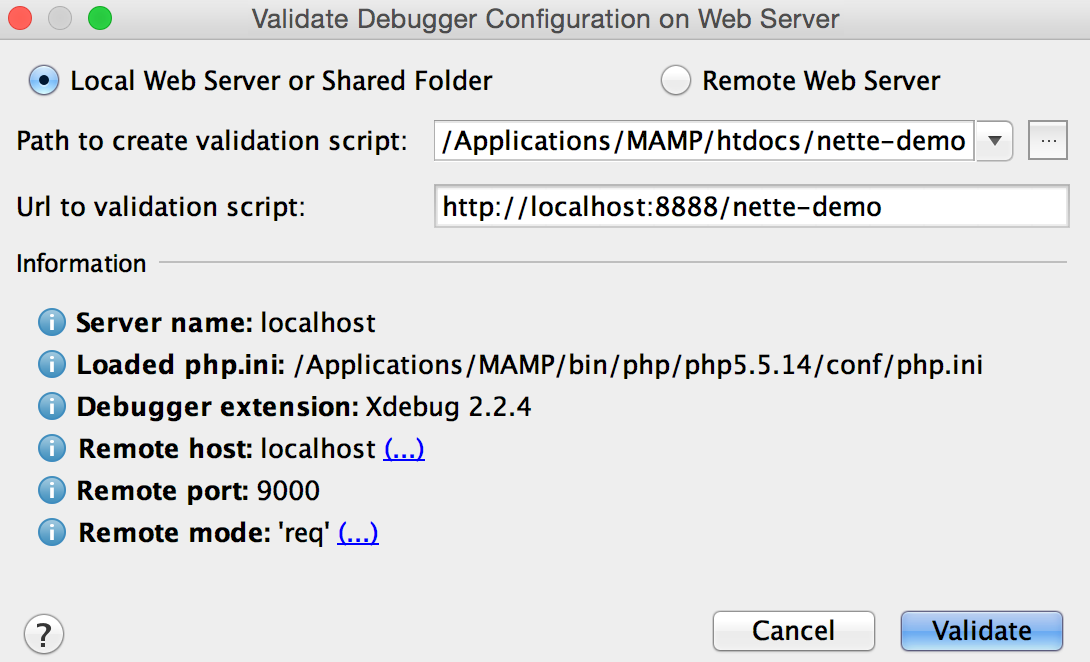
Debugger Configuration Validation was introduced in PhpStorm 7 and is now getting a major update version 9. First of all, the validation action is moved from PHP | Servers settings/preferences to the Web Server Debug Validation action in the Run menu:
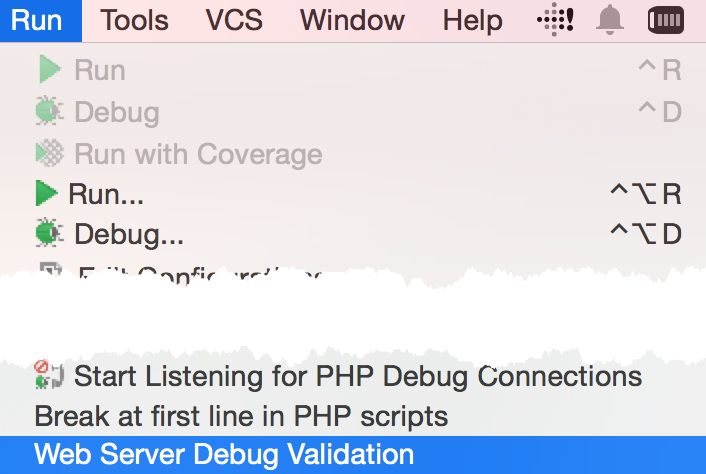
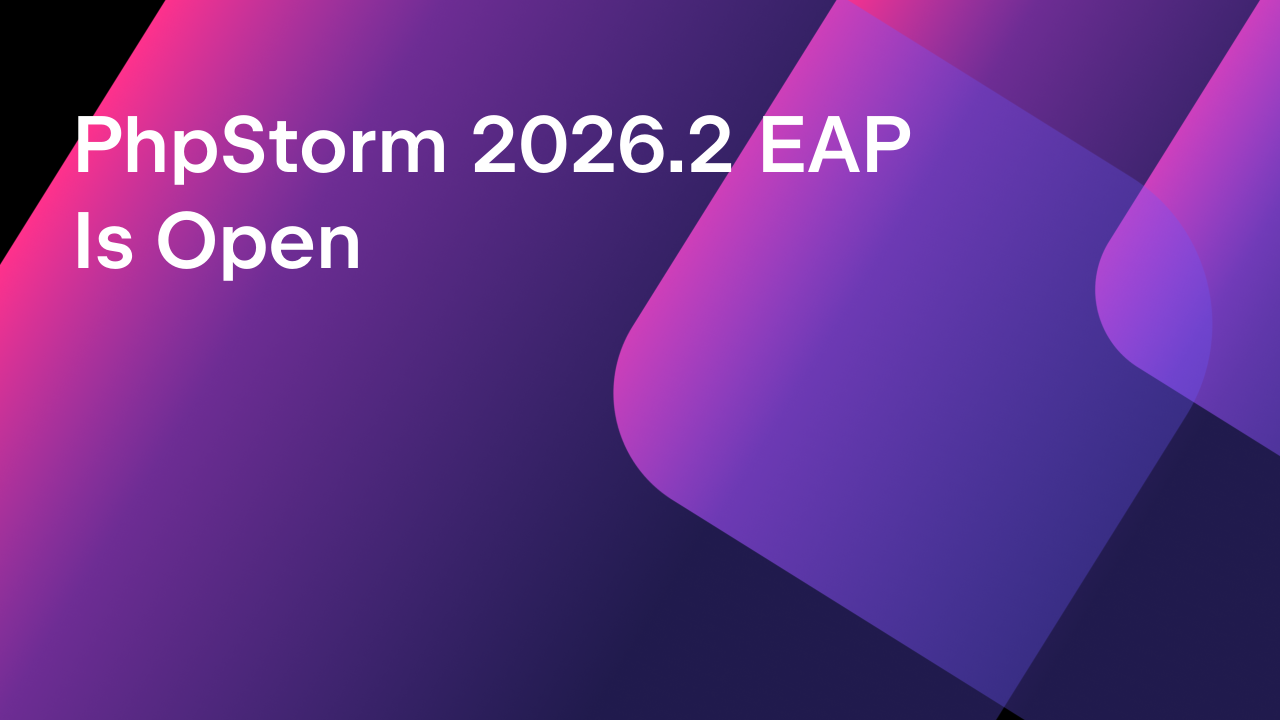
Now there are two different options in this validation dialogue:
- Local Web or Shared Folder validation (provide the local folder to create a validation script and the URL of the validation script)
- Remote Web Server validation (provide the path to create the validation script should be provided, and select the relevant deployment configuration)
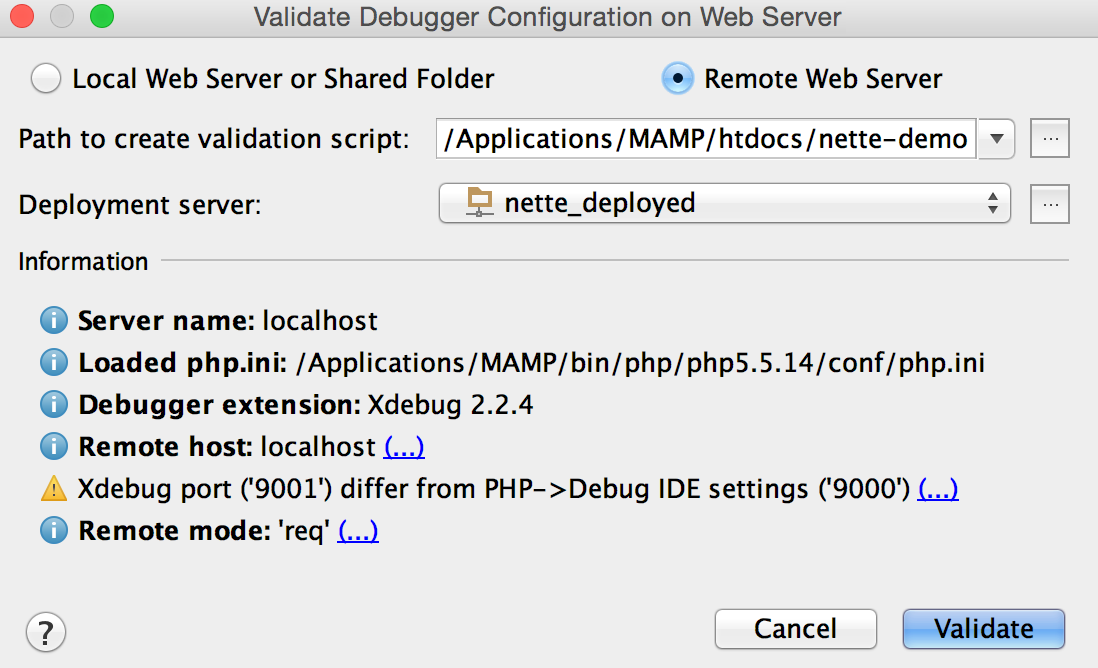
The validation process now provides much more information on the current configuration and any possible issues, including links on how to fix the problem (for both Xdebug and Zend Debugger).
Configuring PHP Interpreters
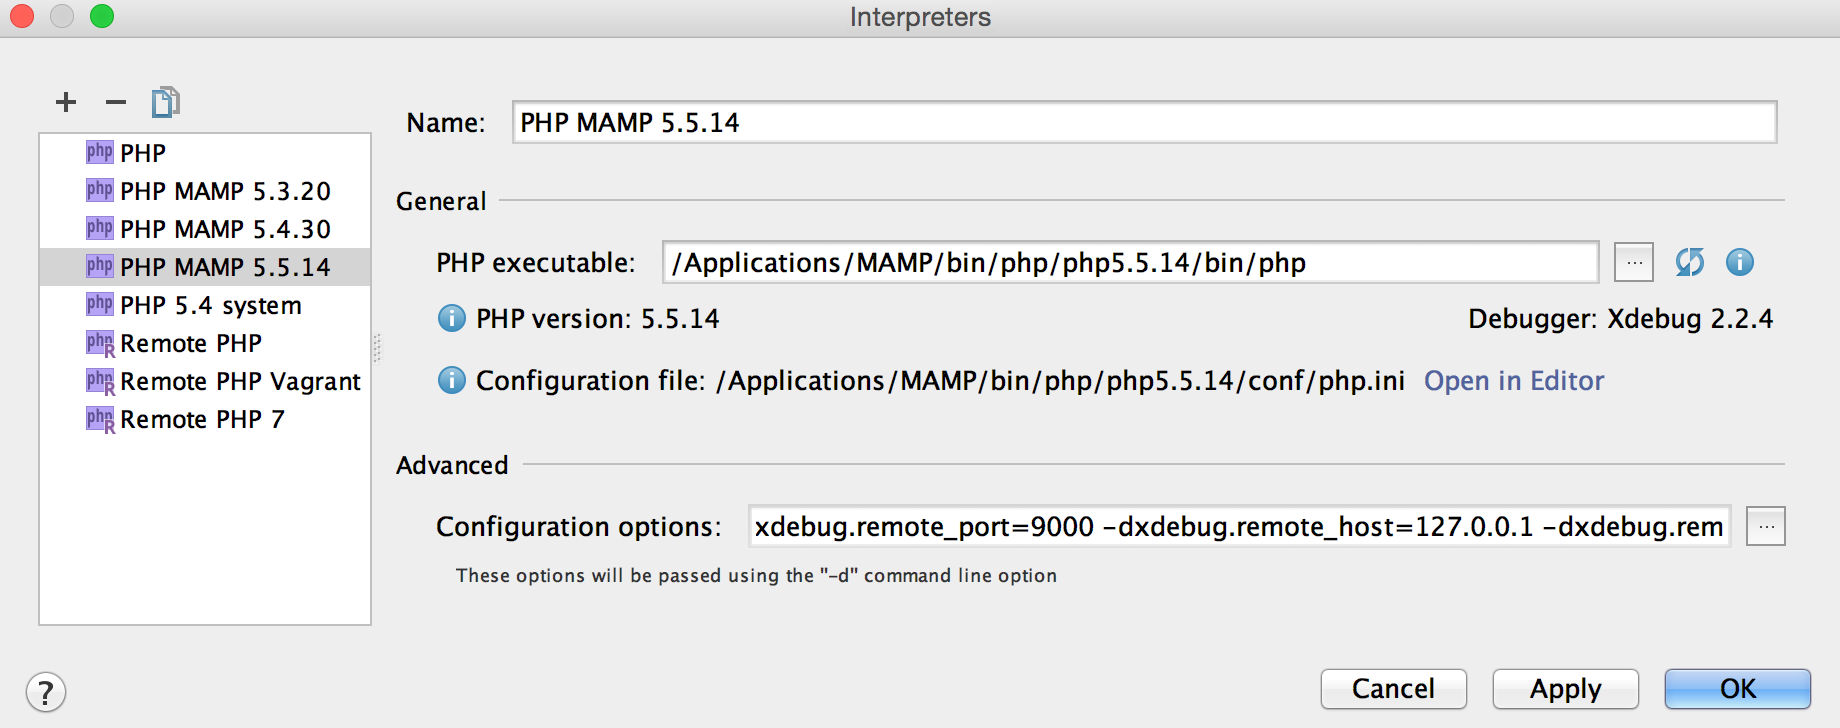
Additional information and actions are now available when configuring PHP interpreters in Settings / Preferences | Languages & Frameworks | PHP…. In addition to PHP version and Debugger information, the phpinfo button shows more complete information about environment you’re using. The configuration files (php.ini and others) used by the interpreter are now listed with an option to open them in the editor:
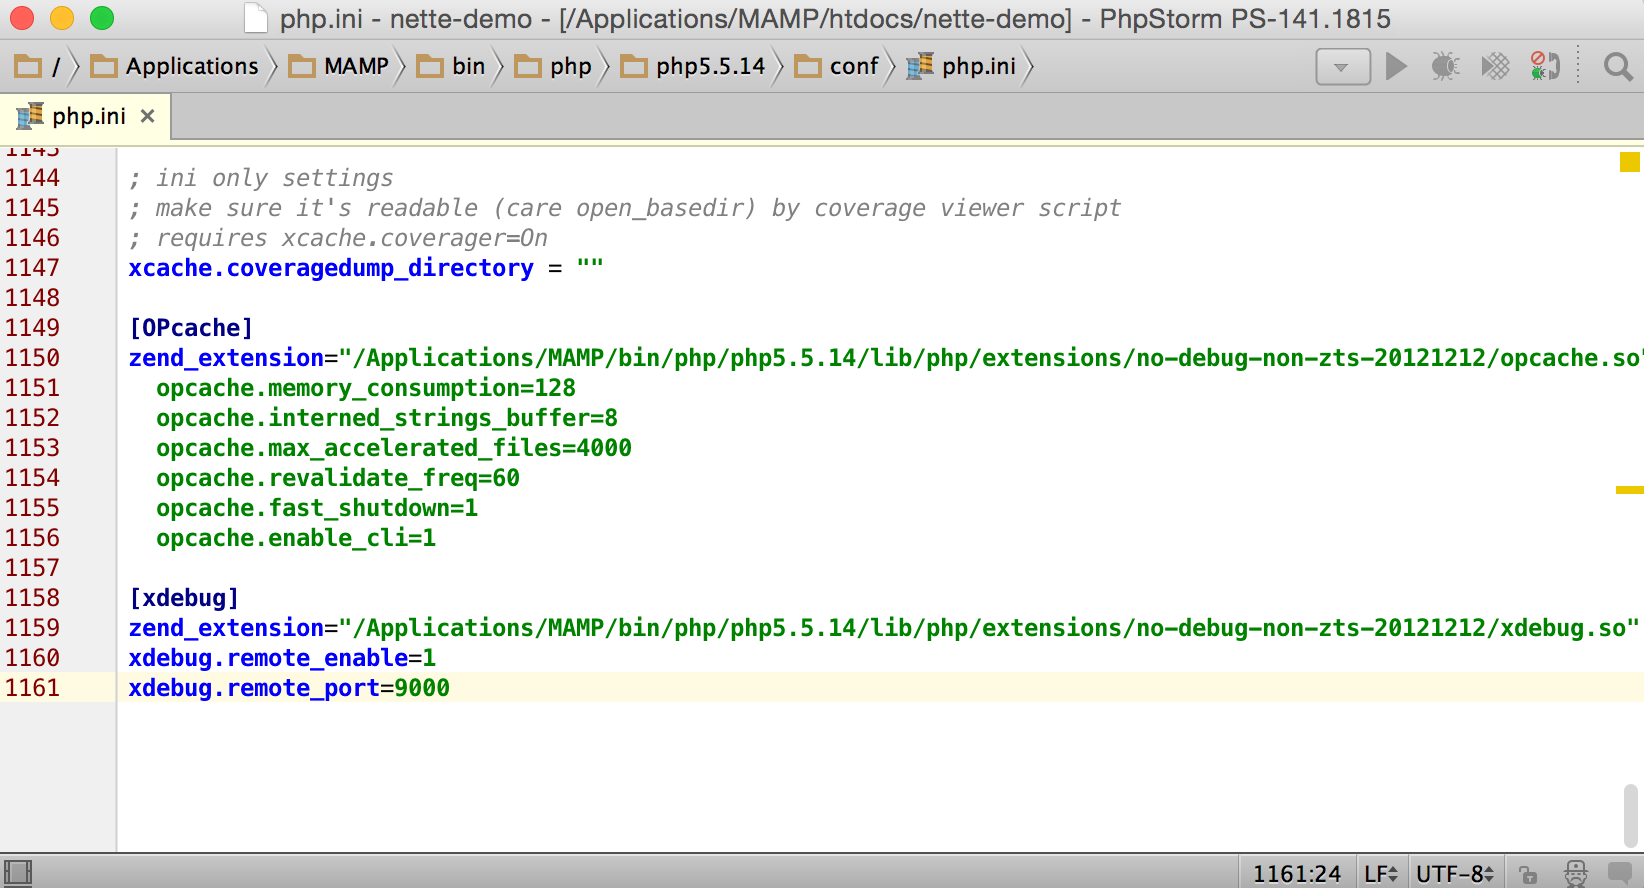
Click the Open in Editor link to open the php.ini for editing in the editor:
 PhpStorm also provides instructions on how to fix issues when no php.ini configuration is found.
Detecting a debugging misconfiguration
Debugging is a complicated process, so the IDE aims to help you with additional tips on what might go wrong (so that you don’t spend hours searching in the wrong place).
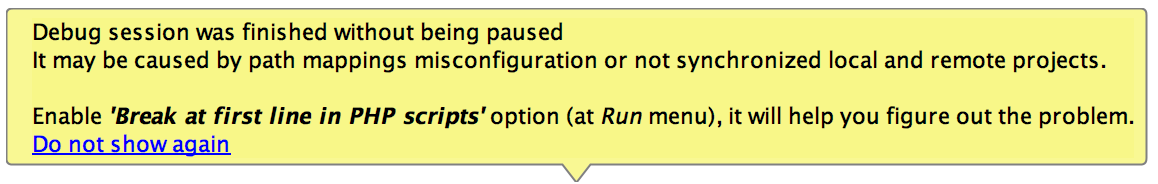
With this update, if you forget to put the breakpoint in your code or fail to enable Run | Break at first line in PHP scripts, PhpStorm will show a tooltip, informing you that there’s been an attempt to establish the debugging process but no breakpoint has been hit:
Shared PHP Servers configuration
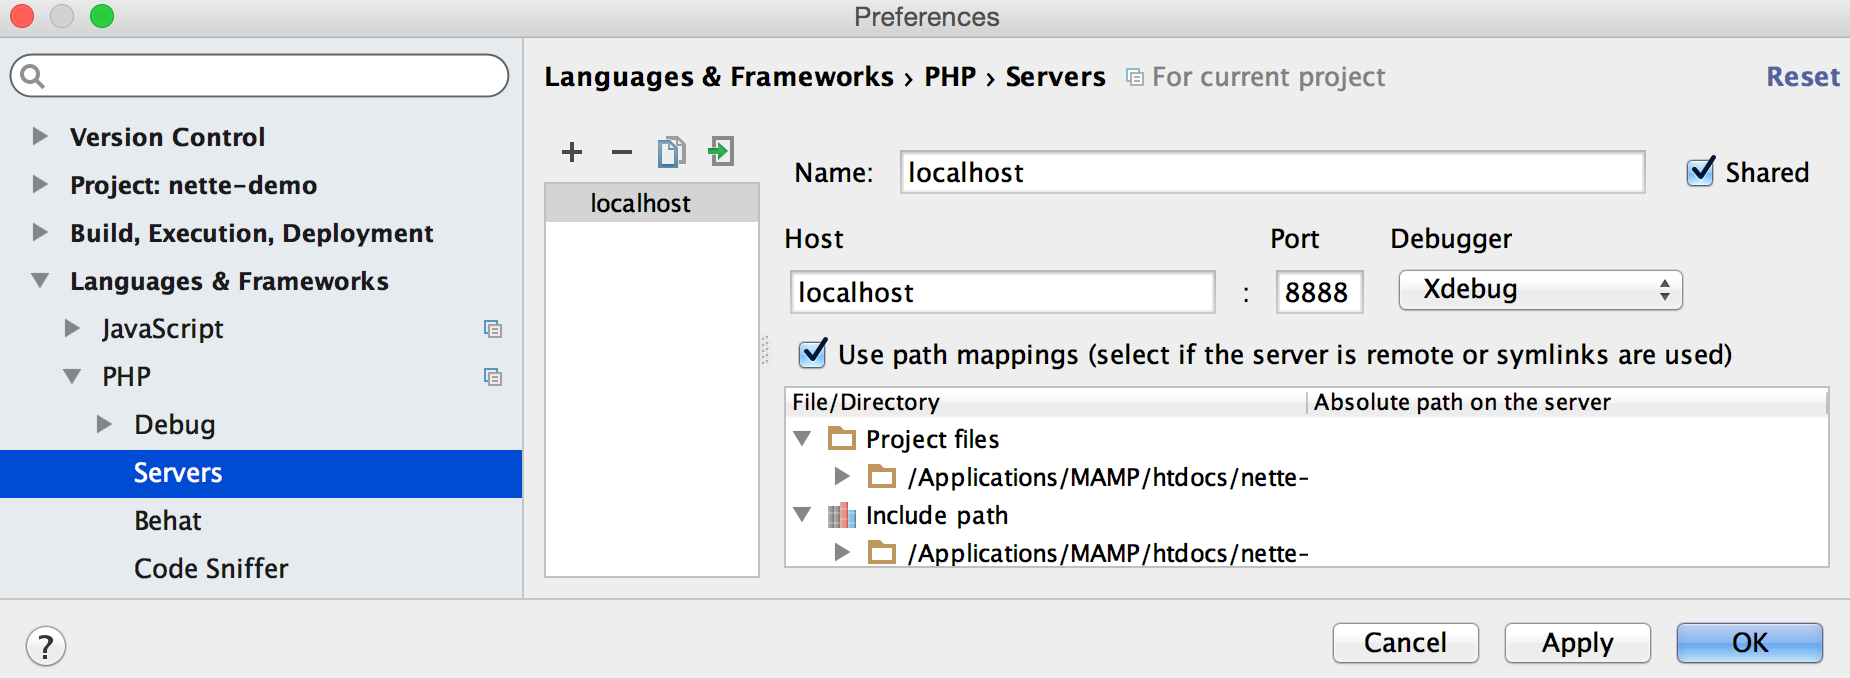
Now PHP Servers configuration in Settings / Preferences | Languages & Frameworks | PHP | Servers (together with path mappings) can be saved on the project level, to be shared with teammates or committed to your VCS. To take advantage of this new option, enable the Shared option in PHP Server configuration, next to the server name:
Import from Deployment action
Path mappings in PHP Servers configuration do look very similar to the path mappings in Deployment configuration. Unfortunately, they cannot be reused, as Deployment configuration requires paths to be relative, and PHP Servers configuration relies on absolute paths.
Because of this, e.g. mounted folder deployment configuration doesn’t have a path to the mounted folder on the remote machine, only local mounted folder root path and relative path mappings. Moreover, FTP/SFTP/FTPS server deployment may be configured with access to the files under deployment root only.
A new Import from Deployment action dramatically eases the configuration of PHP Servers when you already have Deployment configured:
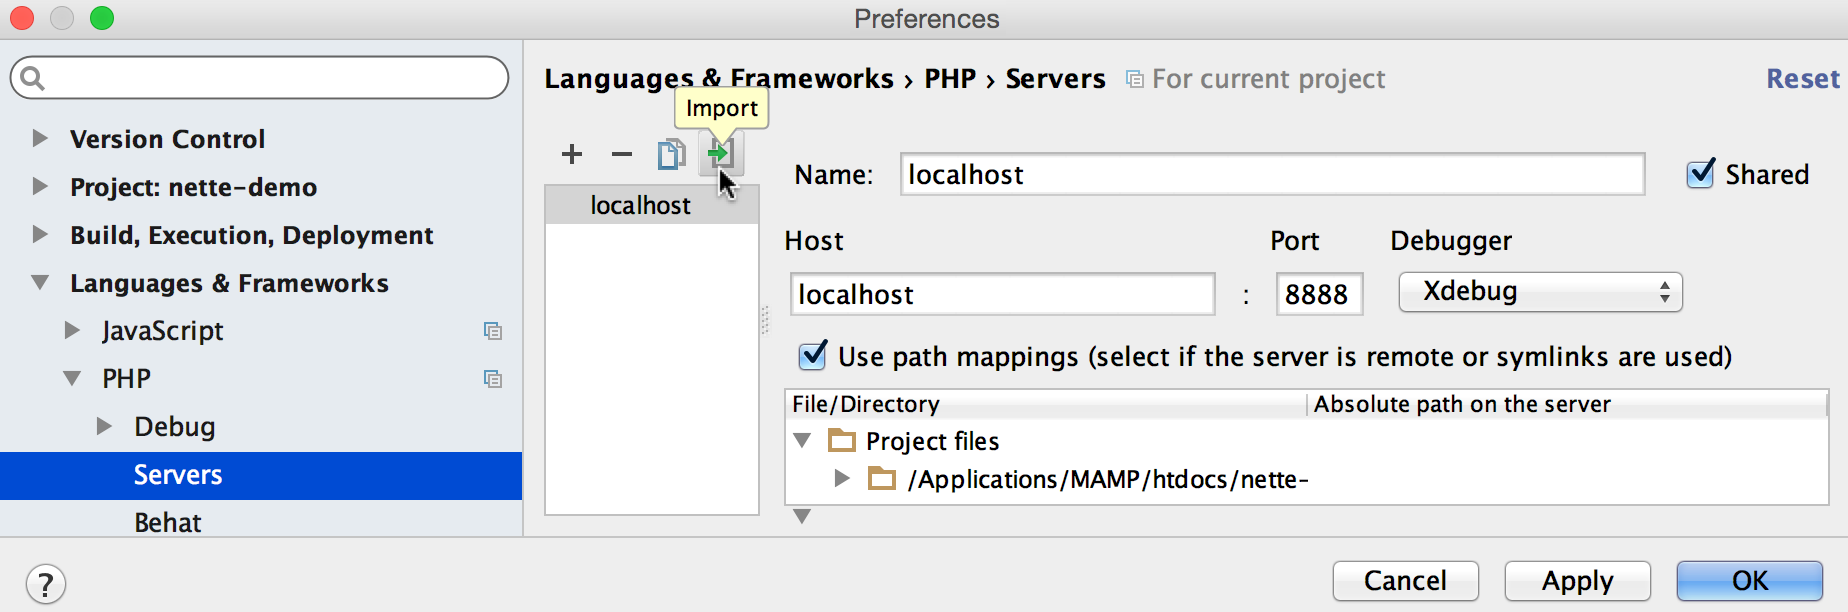
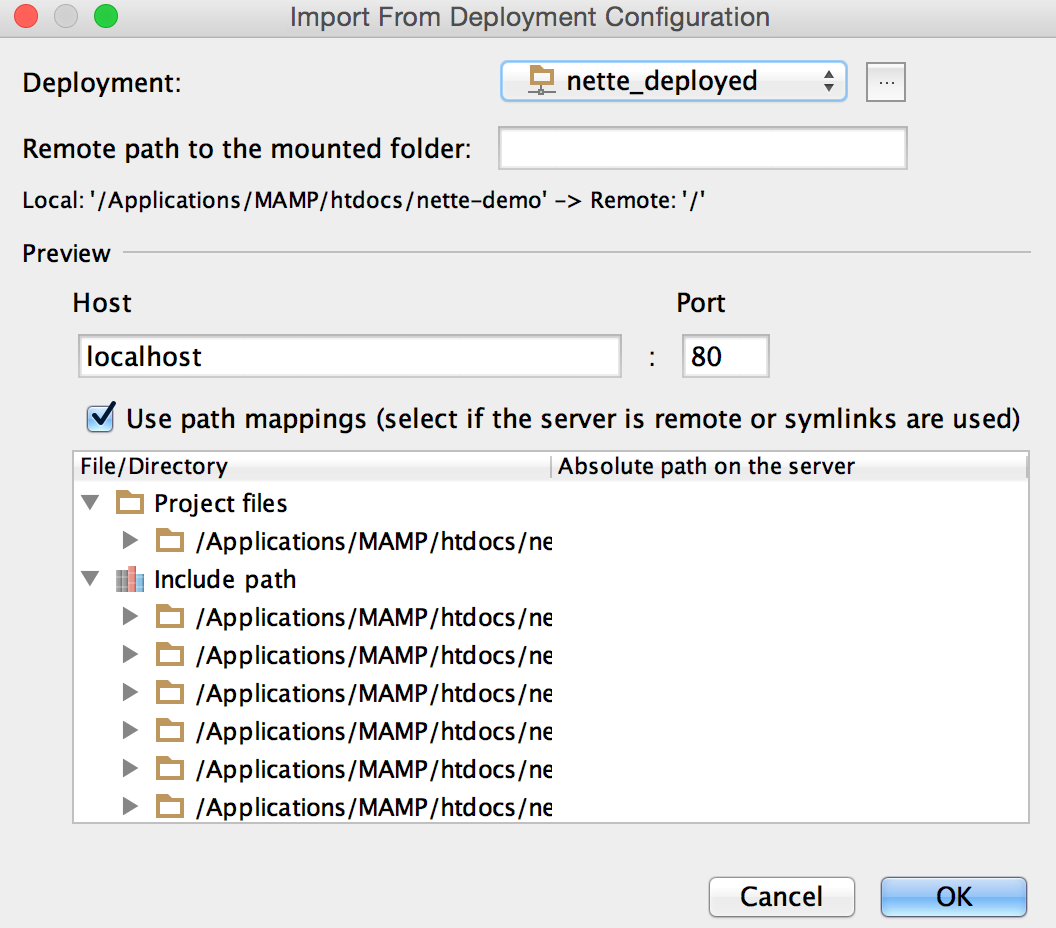
This button is available in Settings / Preferences | Languages & Frameworks | PHP | Servers. It opens the Import from Deployment configuration dialogue, where you should specify the path (remote path to the mounted folder or absolute path to the deployment root, depending on the deployment configuration):
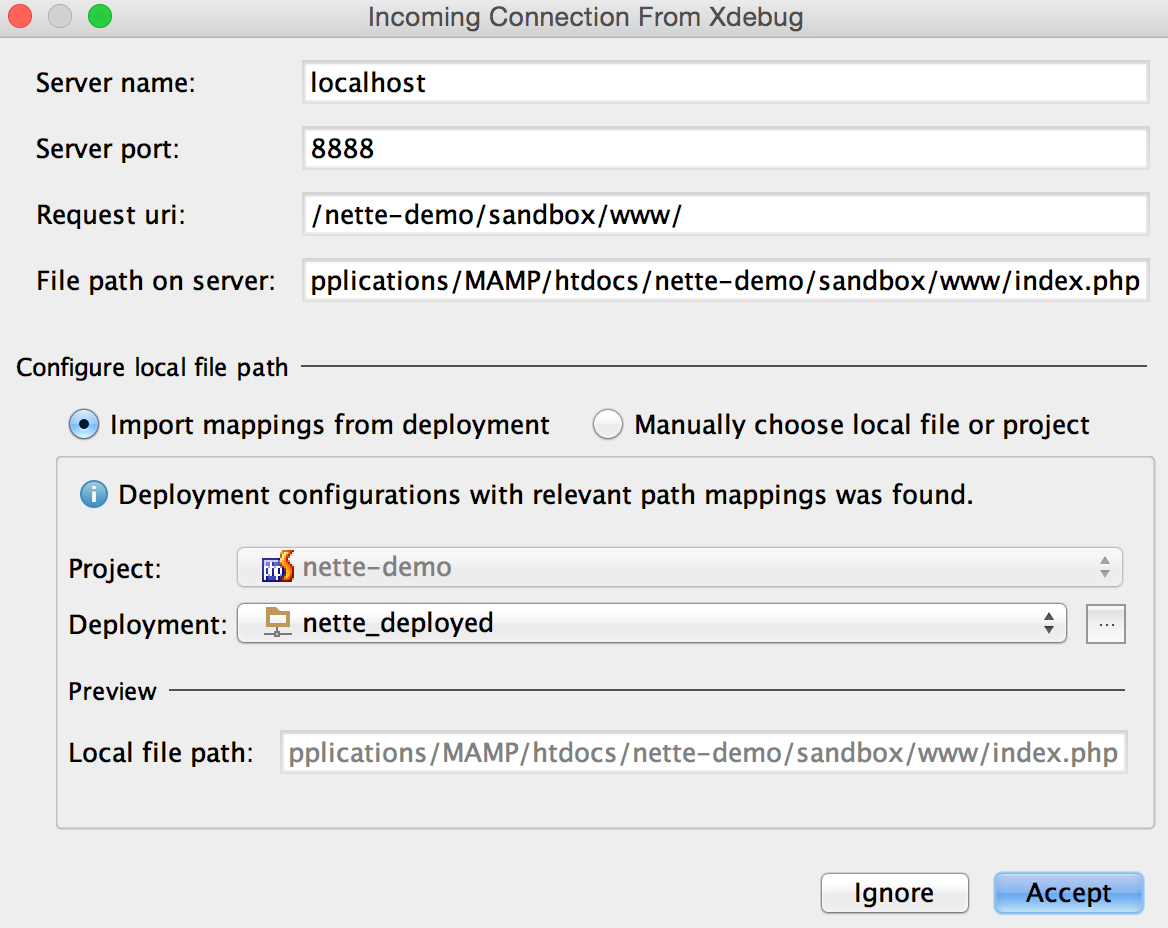
When a debugging connection is established with PhpStorm but no PHP server is configured, PhpStorm will offer to import mappings from deployment, trying to preselect the most suitable existing deployment server:
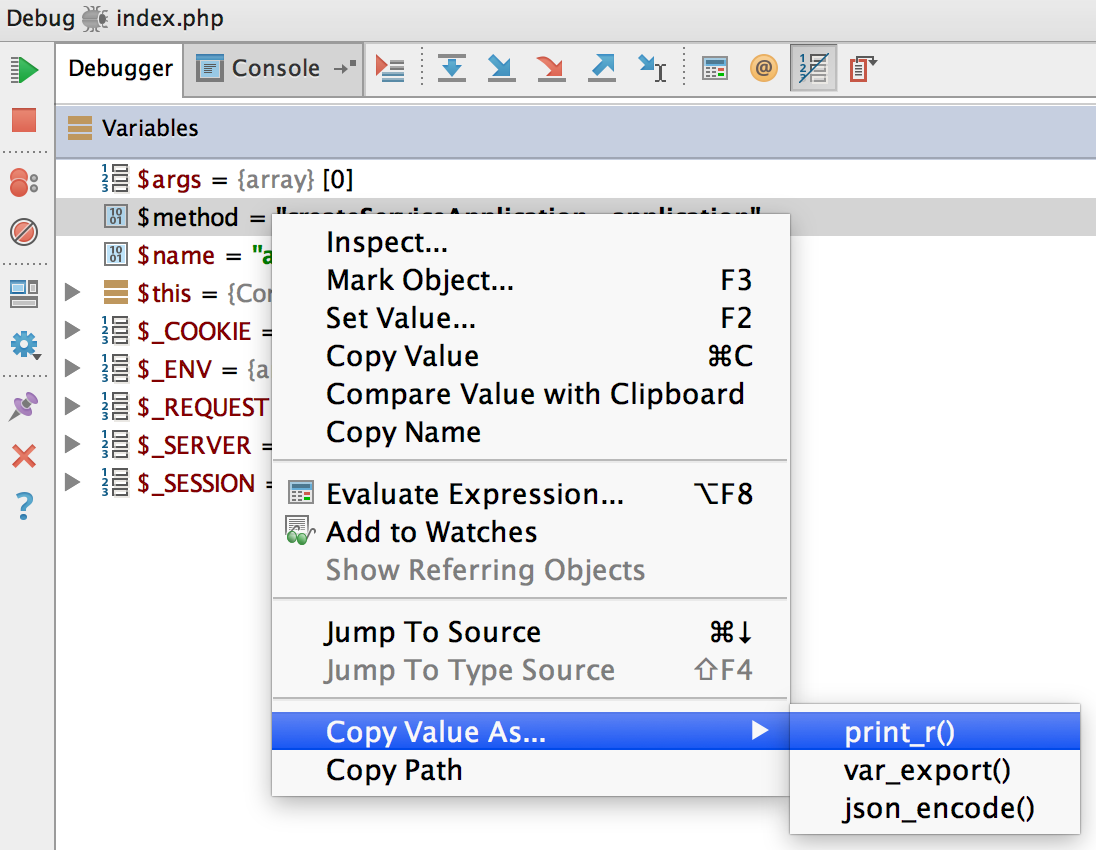
Copy Value as…
Variable values in the Debug tool window can now be copied as print_r(), var_export() or json_encode(). Simply select Copy Value As… from the variable context menu:
Download the latest PhpStorm 9 Public Preview and give the revised debugging workflow a go! Please share your thoughts, feature requests and issues through the issue tracker, by posting in the comments below, or in our forums!
Develop with pleasure!
– JetBrains PhpStorm Team