PyCharm 2016.2 EAP 2 (build 162.917)

Two weeks have passed since the first EAP build of the PyCharm 2016.2. The PyCharm team has returned from PyCon 2016 in Portland, and today we are happy to present you the new PyCharm EAP build, with many new features and bug-fixes inside.
Here are some highlights.
vmprof Profiler Support
For those who care about performance, the PyCharm Professional Edition provides profiling support. It allows running Python code with the cProfile or Yappi profiler enabled, viewing the profiling results in the execution statistics report, and seeing a graph visual representation.
While being very useful in many cases, cProfile and Yappi have their limitations. First, they are tracing profilers, which means that while measuring the duration of function calls, they add an overhead to every call making the final result sometimes inaccurate. Second, they collect the execution statistics for functions, not distinct calls of this functions. Thus, while it is possible to present results in a graph form, there is not enough data to view the call tree, which can be sometimes very informative and helpful.
This all made us support another Python profiler: vmprof.
vmprof is a sampling (statistical) Python profiler written in C (so it has minimal overhead), developed by members of the PyPy team. It works for Python versions 2.7 through 3.5, CPython as well as PyPy, and supports Linux, Mac OS X and Windows.
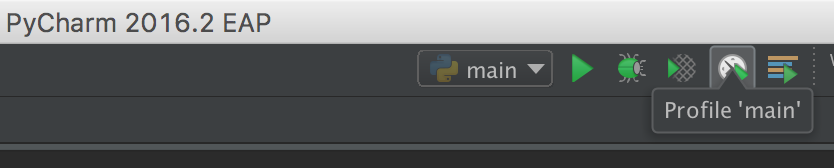
To launch the vmprof profiler from PyCharm, all you need is to have it installed on your selected Python interpreter and then profile your run configuration.
After that, you will see the normal profiling report but with an additional “Call Tree” tab.
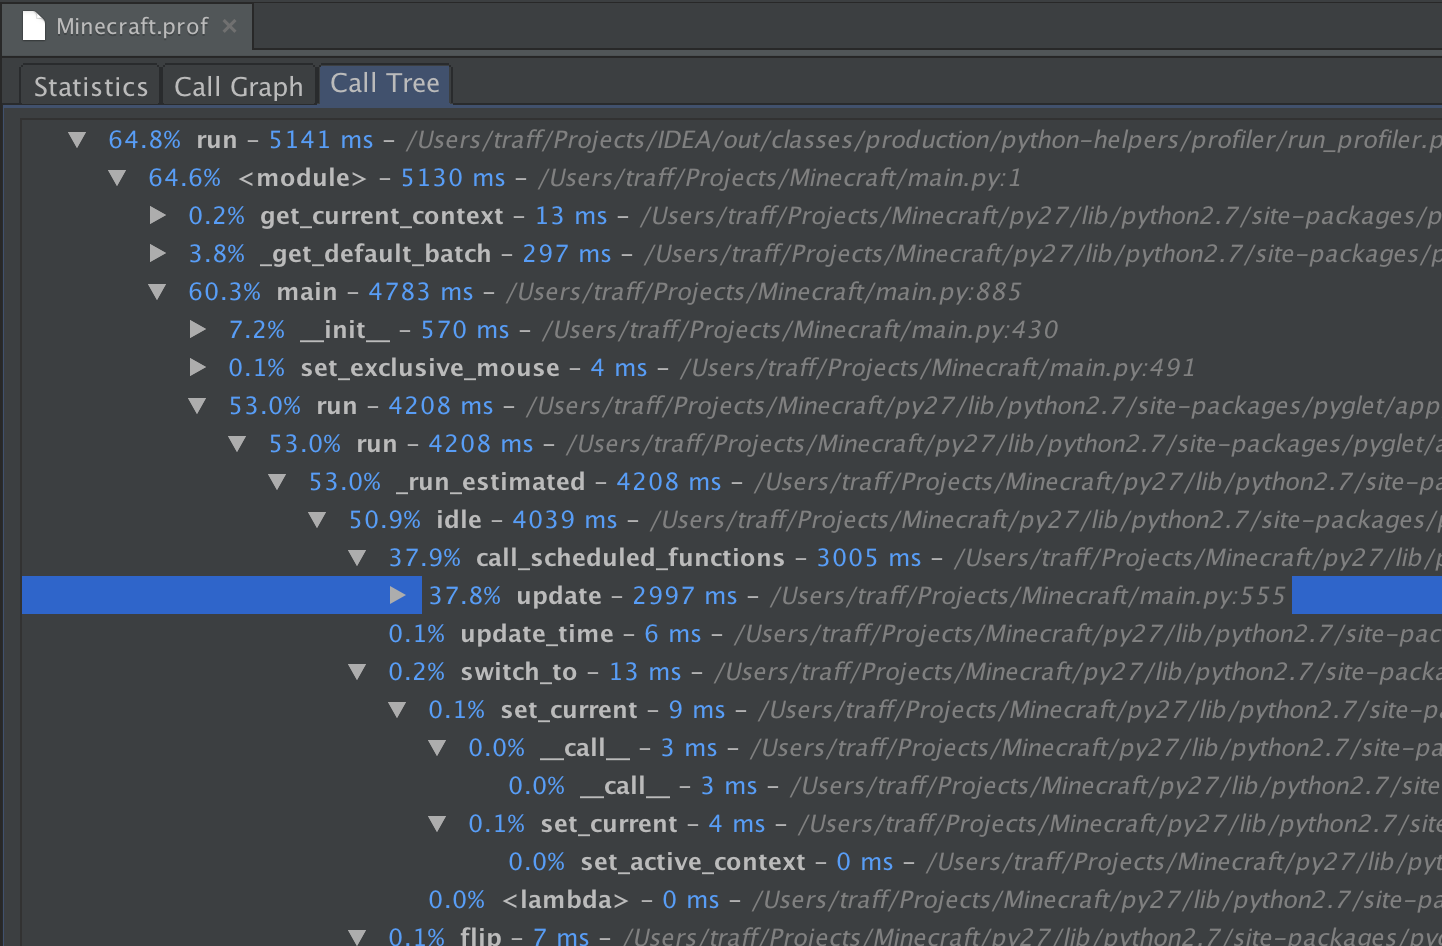
The only limitation is, being a statistical profiler, vmprof-python needs some time to gather enough samples, so it may not work for very short (less than 10ms) scripts.
Configuration for Optimize Imports
The new dedicated setting for “Optimize Imports” actions allows you to configure how imports are sorted and arranged in groups.

Thread Suspend Option
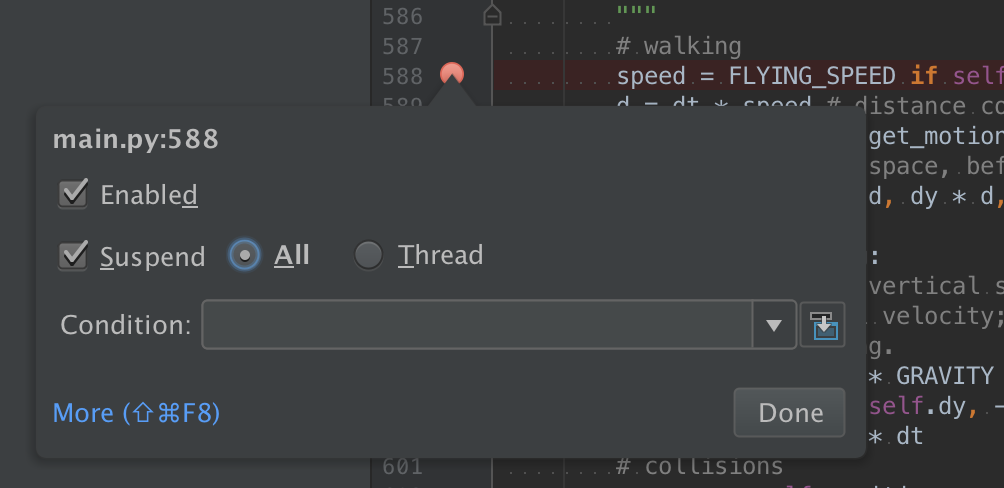
Previously with the PyCharm debugger, on reaching a breakpoint during execution, only the corresponding thread was suspended and others were still running. Now there is a suspend option with two values: All and Thread. ‘All’ makes all threads to stop at once whenever any breakpoint hit. With the ‘Thread’ option, only the corresponding thread stops.
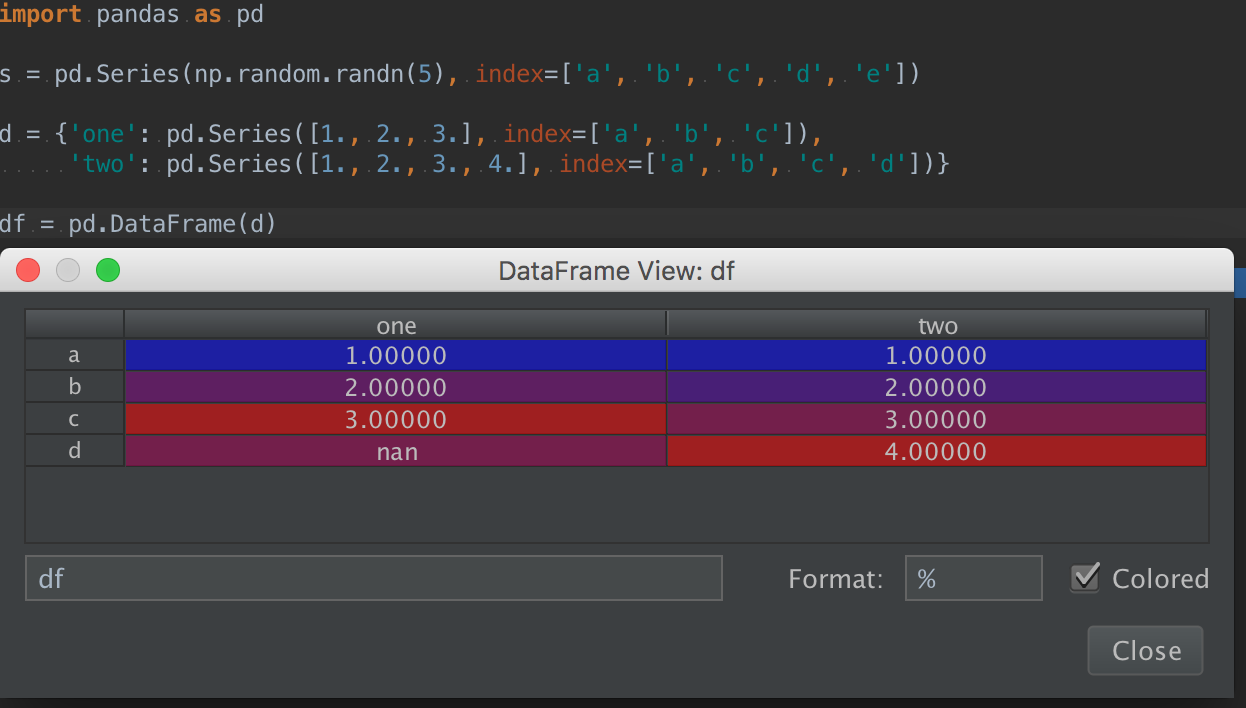
Pandas Dataframes Viewer
PyCharm has had a special array viewer for NumPy arrays since version 4.0, but it didn’t support pandas dataframes, which recently has started to be a highly voted feature. The new EAP enables the array viewer for pandas dataframes as well. Thanks to our user Yuli Fiterman, who contributed this feature!
Git/Mercurial Log viewer
The viewer now loads in the background on every change (a commit, fetch, rebase, etc). As a result, it’s always ready when you open it.
While the loading is in progress, there’s a thin stripe shown under the toolbar.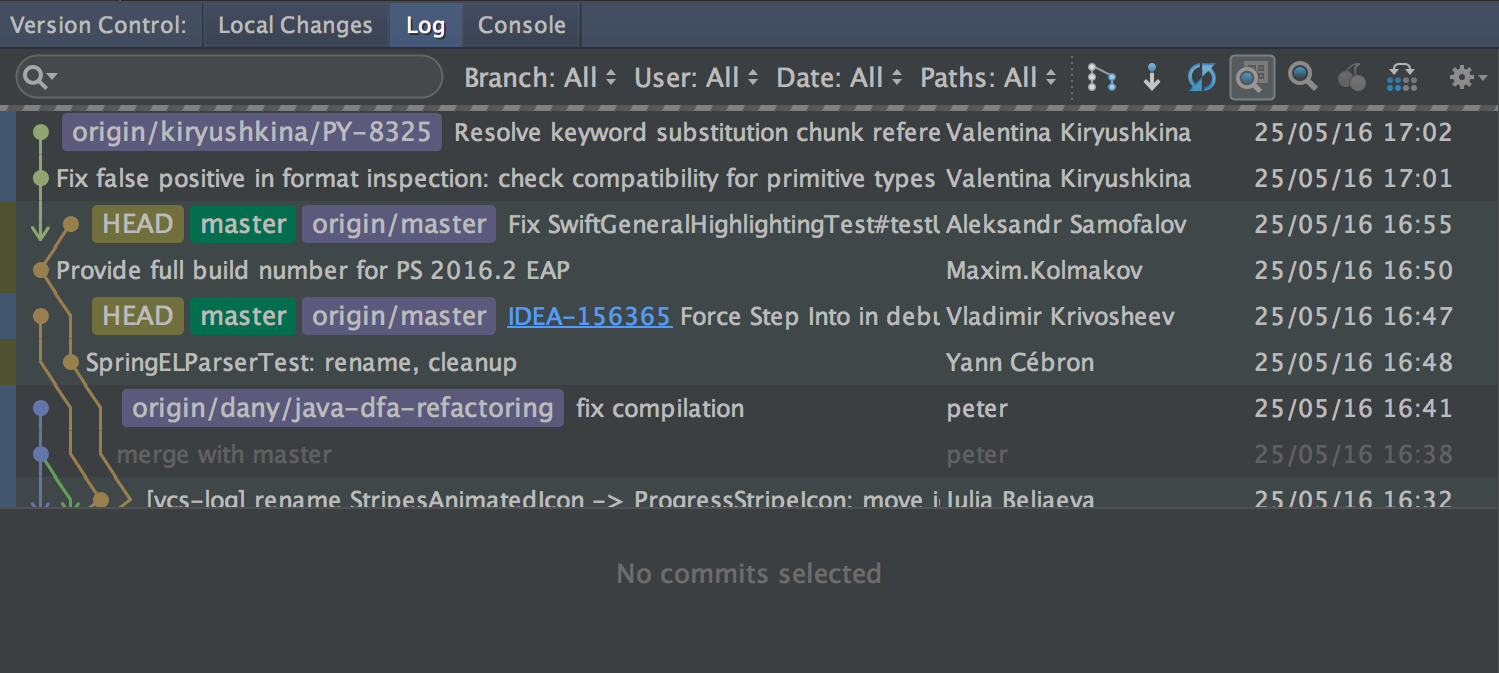
Custom Background Image for Every Project
While it may seem as something that doesn’t matter for productivity at all, a feature is still nice to have. Sometimes appearance is everything.
With the ‘Set Background Image’ (use Find action Shift-Cmd-A) action, you are able to set any image file as a background for PyCharm.
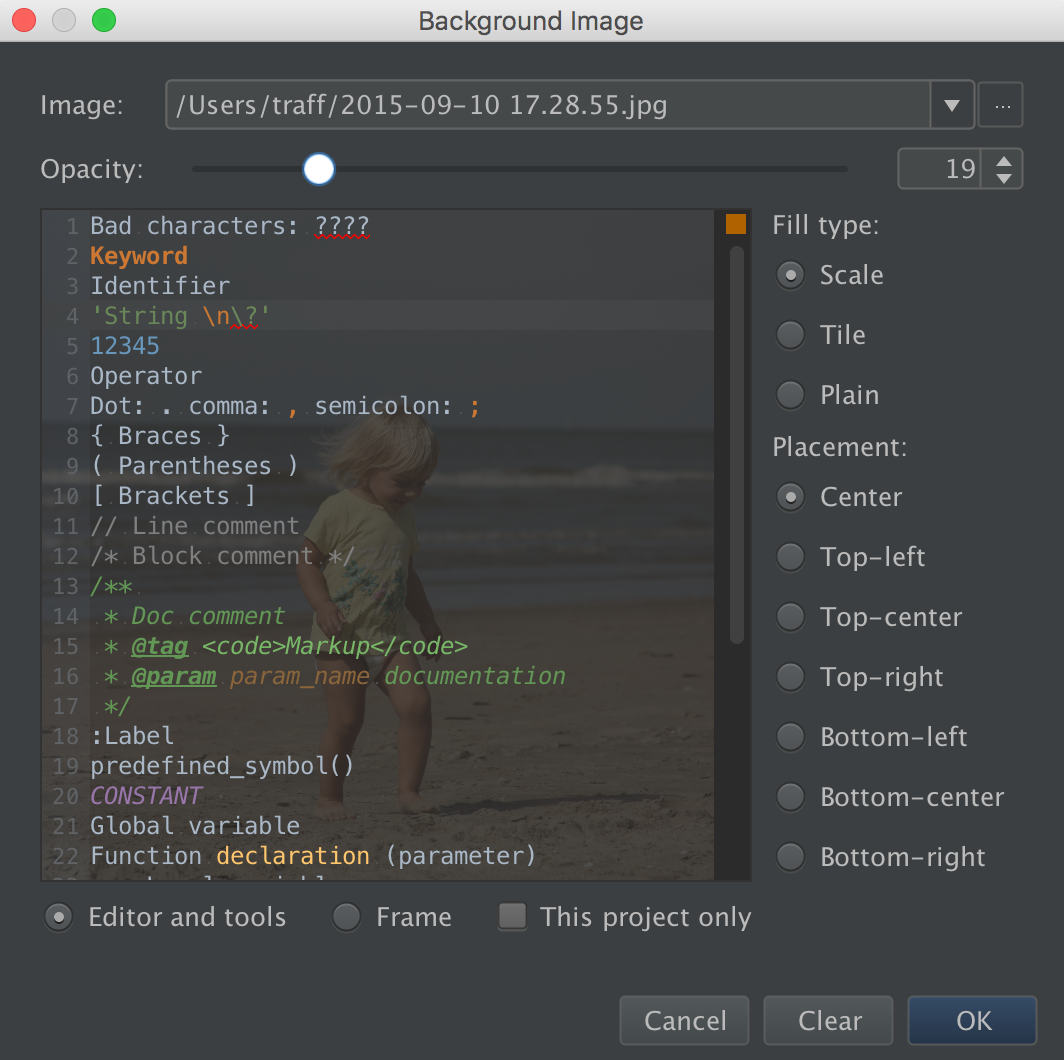
And now you can set different backgrounds for different projects!
That’s all for today, stay tuned!
Download PyCharm 2016.2 EAP build 162.917 for your platform from the project EAP page or update right from the previous PyCharm EAP installation with a patch update within the IDE. Please report any bugs and feature requests to our Issue Tracker, your feedback is very important for us to make PyCharm 2016.2 better.