TeamCity
Powerful CI/CD for DevOps-centric teams
CI/CD Observability with TeamCity Server Metrics

TeamCity has been able to report various metrics in the Prometheus format since version 2019.2. You can open <your server url>/app/metrics endpoint to see all these metrics alongside short descriptions of them.
However, it’s one thing to collect some metrics, but it’s another to transform them into something useful that allows for the monitoring of your TeamCity server’s health. In this post, we’ll shed some light on the most useful metrics and how they can be used and interpreted.
Note that the metrics described in this post are all production-tested on a local TeamCity installation at JetBrains. All of these metrics exist in TeamCity version 2022.04, although some of them are not available in previous versions.
Understanding TeamCity metrics
First of all, we suggest opening the /app/metrics?experimental=true URL on your server to see which metrics are being reported.
A typical metric looks like this:
agents_connected_authorized_number{nodeId=”linux-2″}
Here, nodeId=”linux-2″ is an additional tag added to each metric to indicate the TeamCity node that produced this metric. This is mostly useful in the multi-node setup, where each node reports its own set of metrics. To properly display such metrics in Grafana, you should either specify nodeId, or use aggregation functions like sum() or max().
You can also see that the experimental=”true” tag is set for many metrics. This means that the metric is experimental and may be removed in the future. In fact, the majority of the metrics described in this post are still experimental, but it’s unlikely that they will be removed as they have already proved their usefulness.
Now let’s see which metrics are available to provide you with insight into your TeamCity server’s health.
Current server load (agents, builds, users)
A number of metrics can be used to monitor the current server load: number of connected agents, number of active users, build queue size, etc.
| Metric name | Description | How to use it |
| builds_running_number | Number of running builds | max(builds_running_number) |
| builds_queued_number | Number of queued builds | max(builds_queued_number) |
| agents_connected_authorized_number | Number of connected and authorized agents | max(agents_connected_authorized_number) |
| users_active_number | Number of active users | max(users_active_number) |
Note that we’re using the max() function here and we don’t group data by nodeId. That’s because the number of agents and builds reported by all nodes will be the same. At the same time, the number of users is only important for the main node. In any case, the max() function works fine for all cases.
Build and agent metrics can be plotted on the same chart in Grafana, as they usually have comparable values:
Note that in TeamCity, there are builds that do not occupy agents, so-called agentless and composite builds. Don’t be surprised if the number of running builds is bigger than the number of authorized agents.
JVM process
TeamCity runs inside a JVM. Thus, it’s important to monitor at least basic information about the JVM process. The relevant metrics are:
| Metric name | Description | How to use it |
| jvm_memory_used_bytes | This metric reports the total amount of memory used by the JVM. There are different sections of this memory, which are reported separately with the “area” tag. The most useful one is “heap”. | sum(avg_over_time(jvm_memory_used_bytes{area=”heap”}[1m])) by (nodeId) |
| cpu_usage_process_number | The CPU usage process. | sum(avg_over_time(cpu_usage_process_number[1m])) by (nodeId) |
The formulas above can be used in Grafana and provide the average of these values over 1 minute. The data is also reported separately per node. The result in Grafana for the CPU usage metric looks like this:
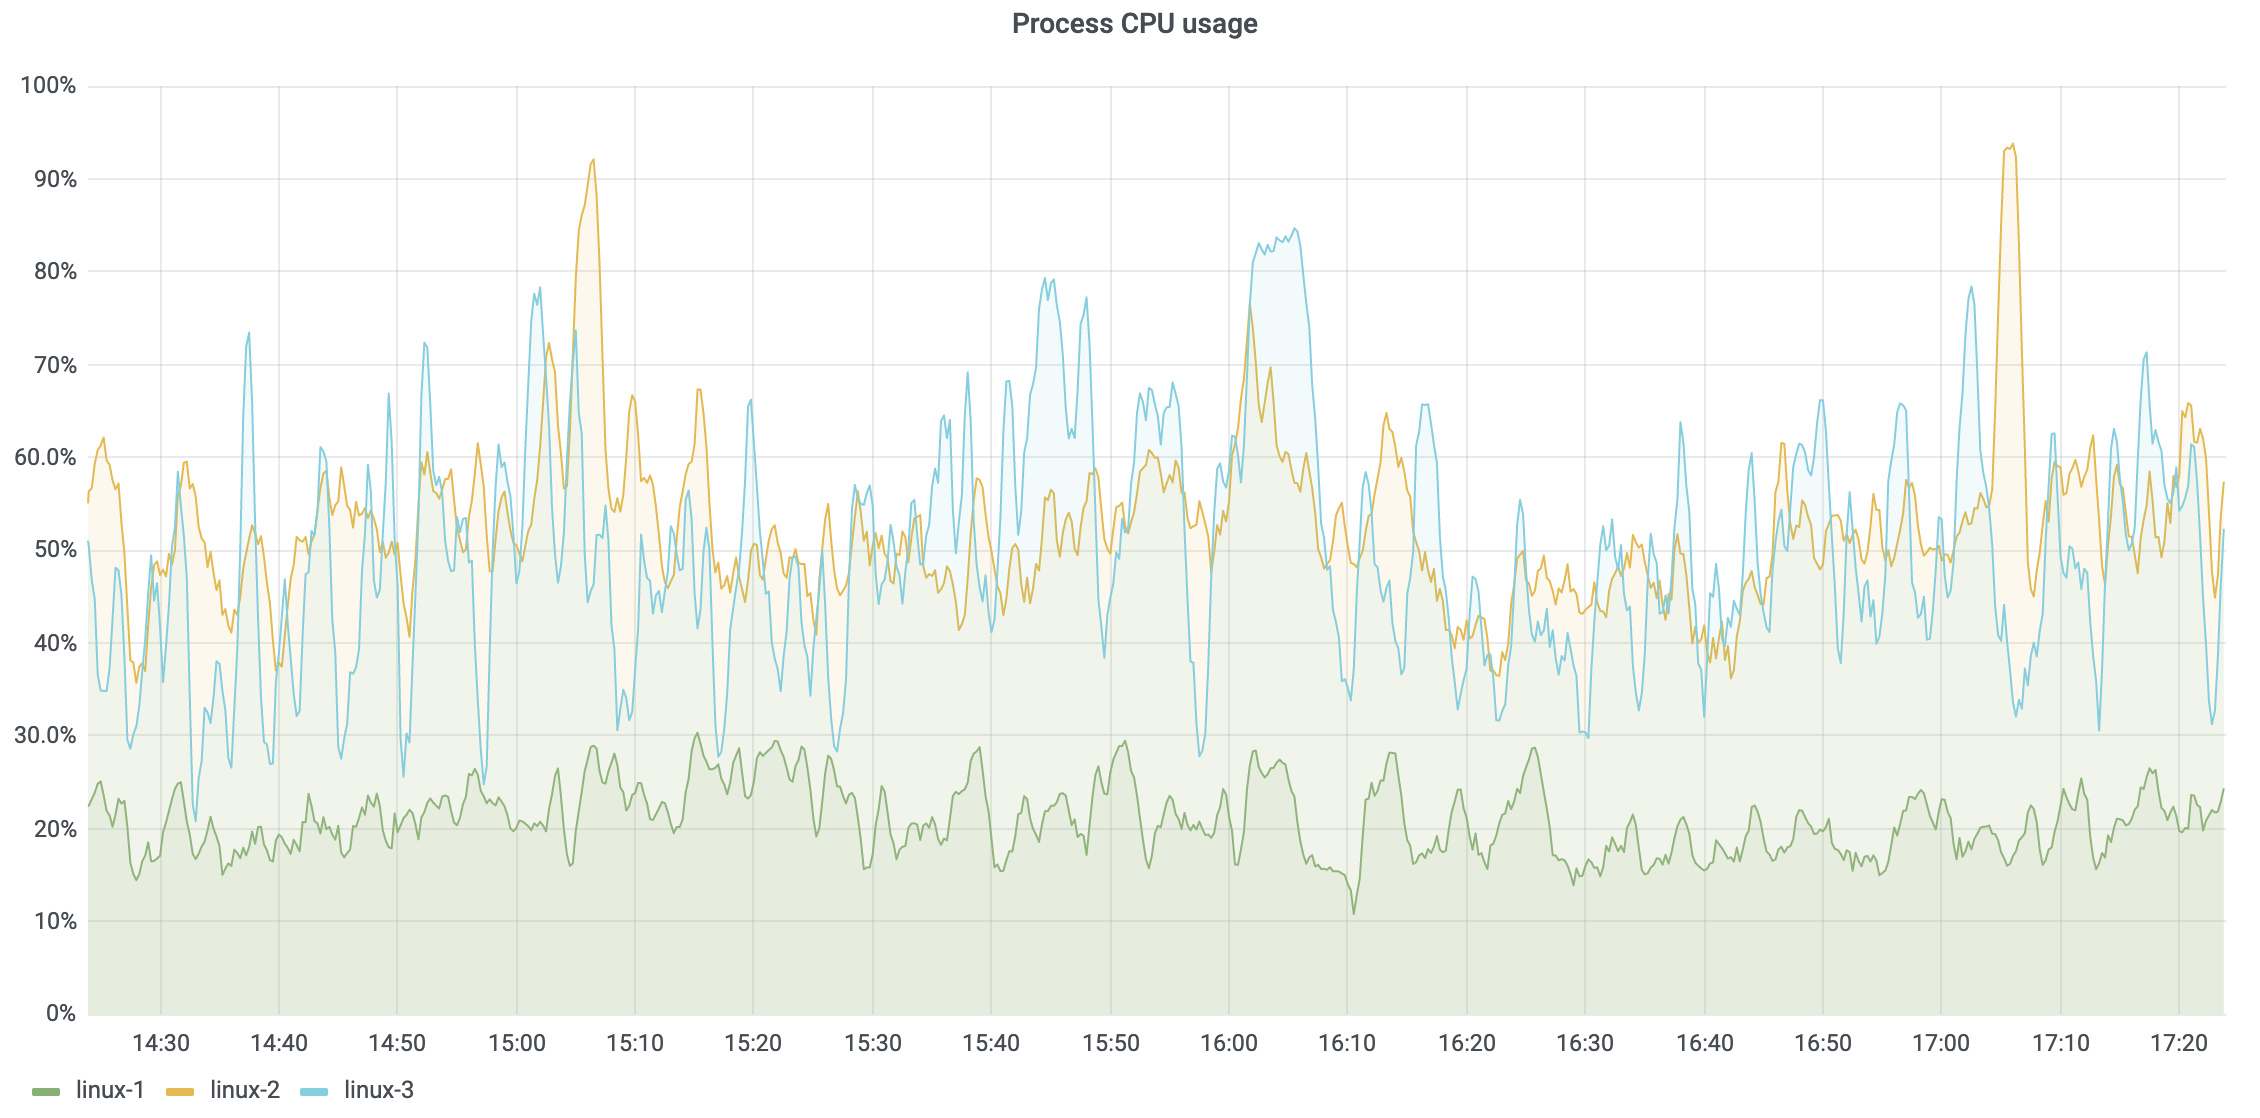
Obviously, if the memory usage or CPU usage remains high, then the server won’t be responsive. If memory usage reaches 80% of the configured Xmx and stays there for a long period of time, then you should try increasing the Xmx; otherwise, TeamCity server performance will be affected. If increasing Xmx does not help, then a problem should be reported to one of our support channels.
If CPU usage is high most of the time, and the server has a decent number of cores already, then a number of thread dumps should be collected and sent to JetBrains for investigation.
HTTP requests
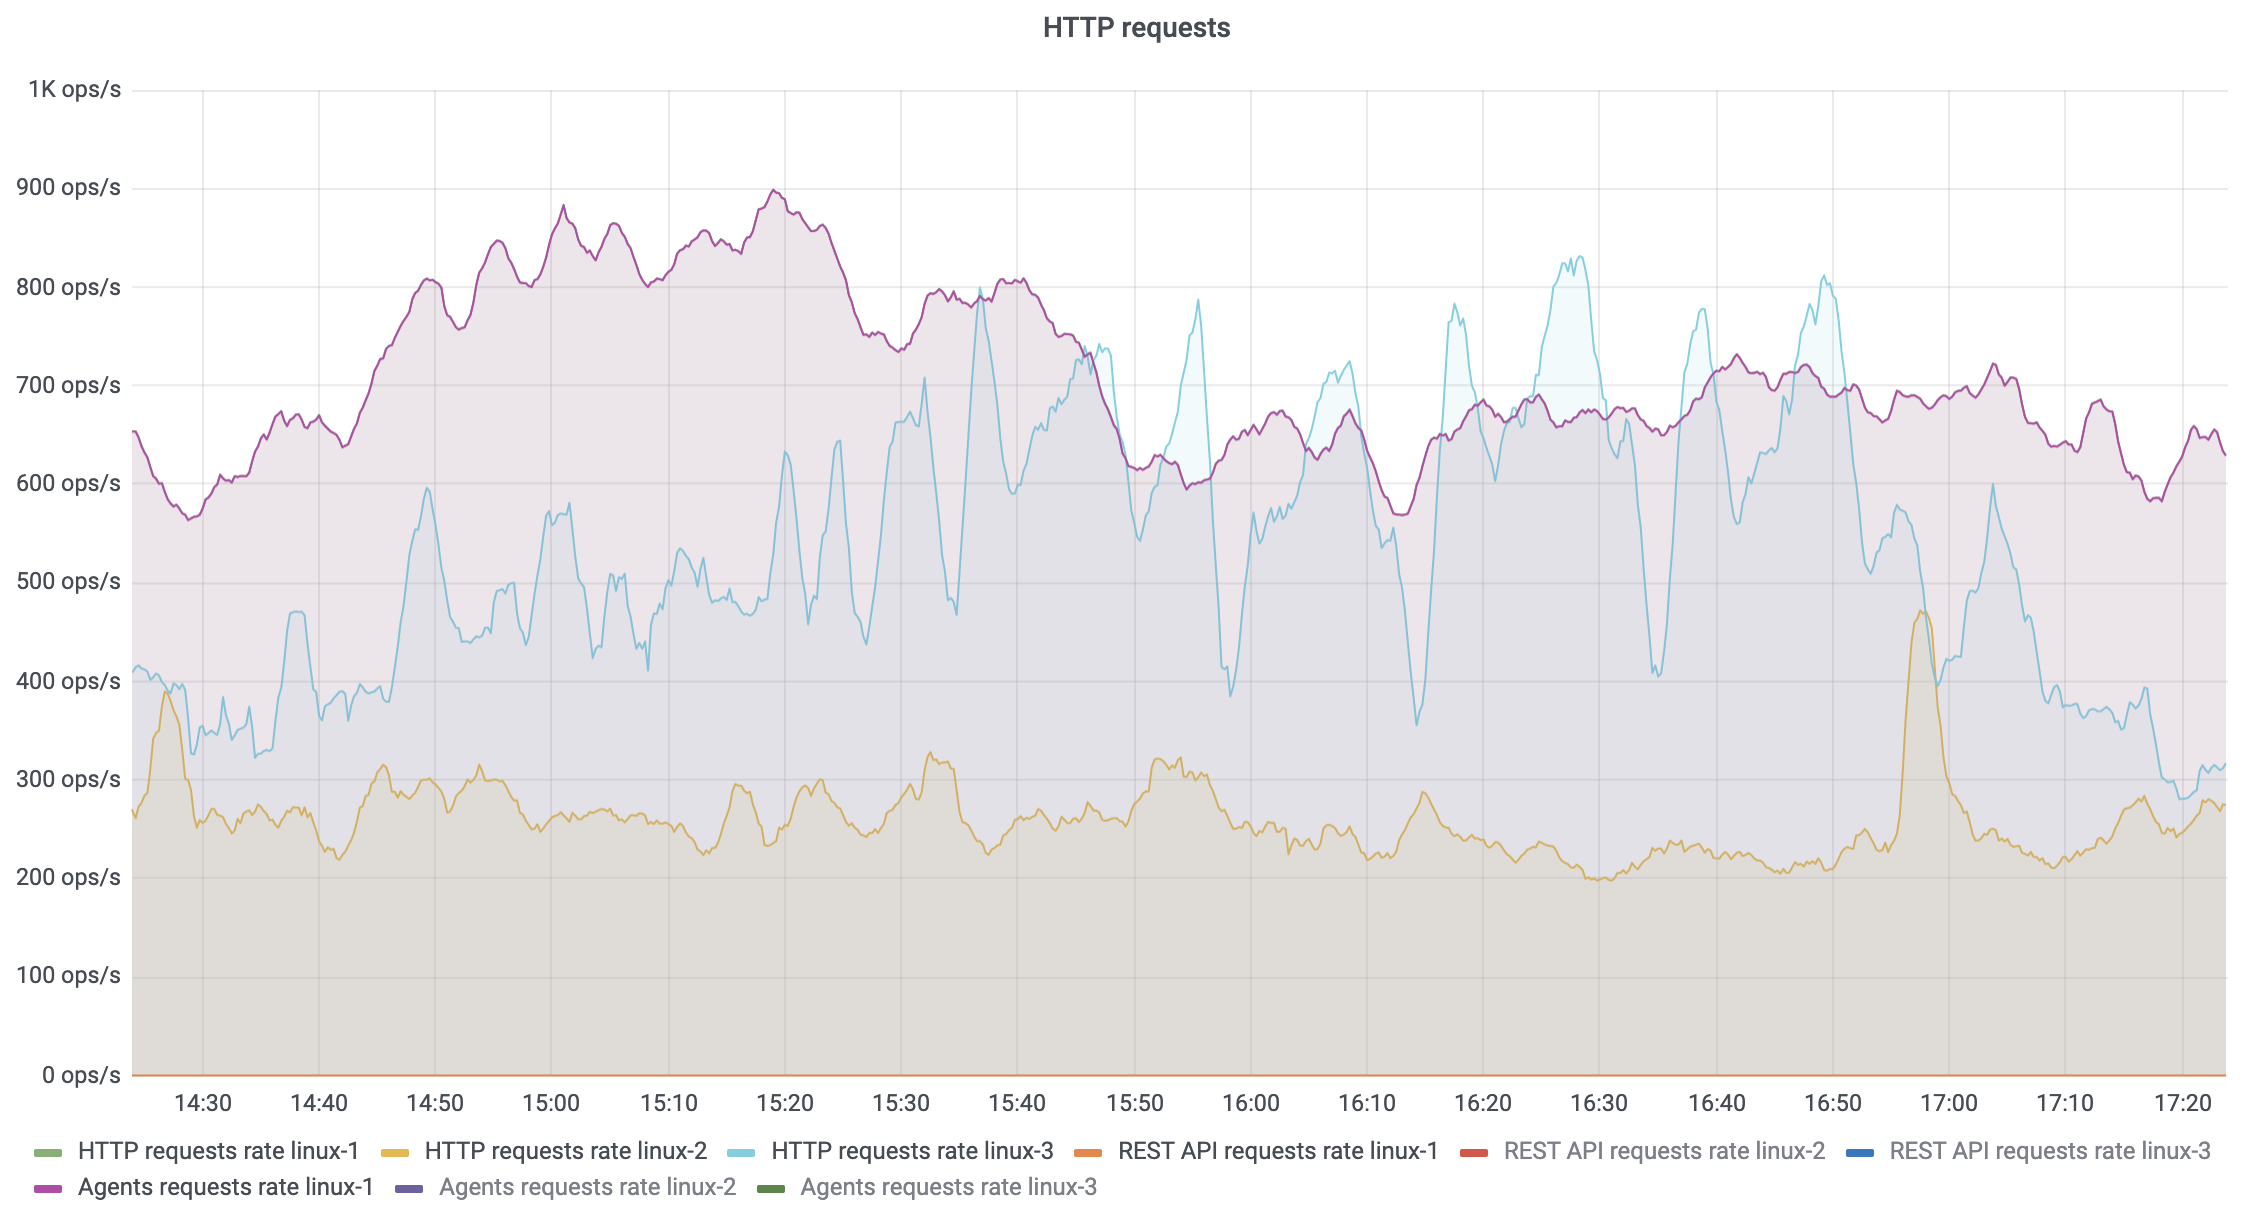
The http_requests_duration_milliseconds_count metric can be used to reveal a variety of interesting insights:
| How to use it | Description |
| sum(rate(http_requests_duration_milliseconds_count[3m])) by (nodeId) | The rate of HTTP requests from all clients (browsers, agents, etc.). |
| sum(rate(http_requests_duration_milliseconds_count{apiType=”rest_api”, clientType != “web_ui”}[3m])) by (nodeId) | The rate of HTTP requests to the TeamCity REST API sent by clients that are not browsers. |
| sum(rate(http_requests_duration_milliseconds_count{clientType=”tc_agent”}[3m])) by (nodeId) | The rate of HTTP requests sent by agents. |
Different TeamCity nodes can have different HTTP request rates; thus, it makes sense to show data per node.
In our practice, we sometimes see performance issues caused by the build scripts using the TeamCity REST API. Such scripts can send too many heavy requests in a short period of time, and this affects server performance. That’s why monitoring this metric is important.
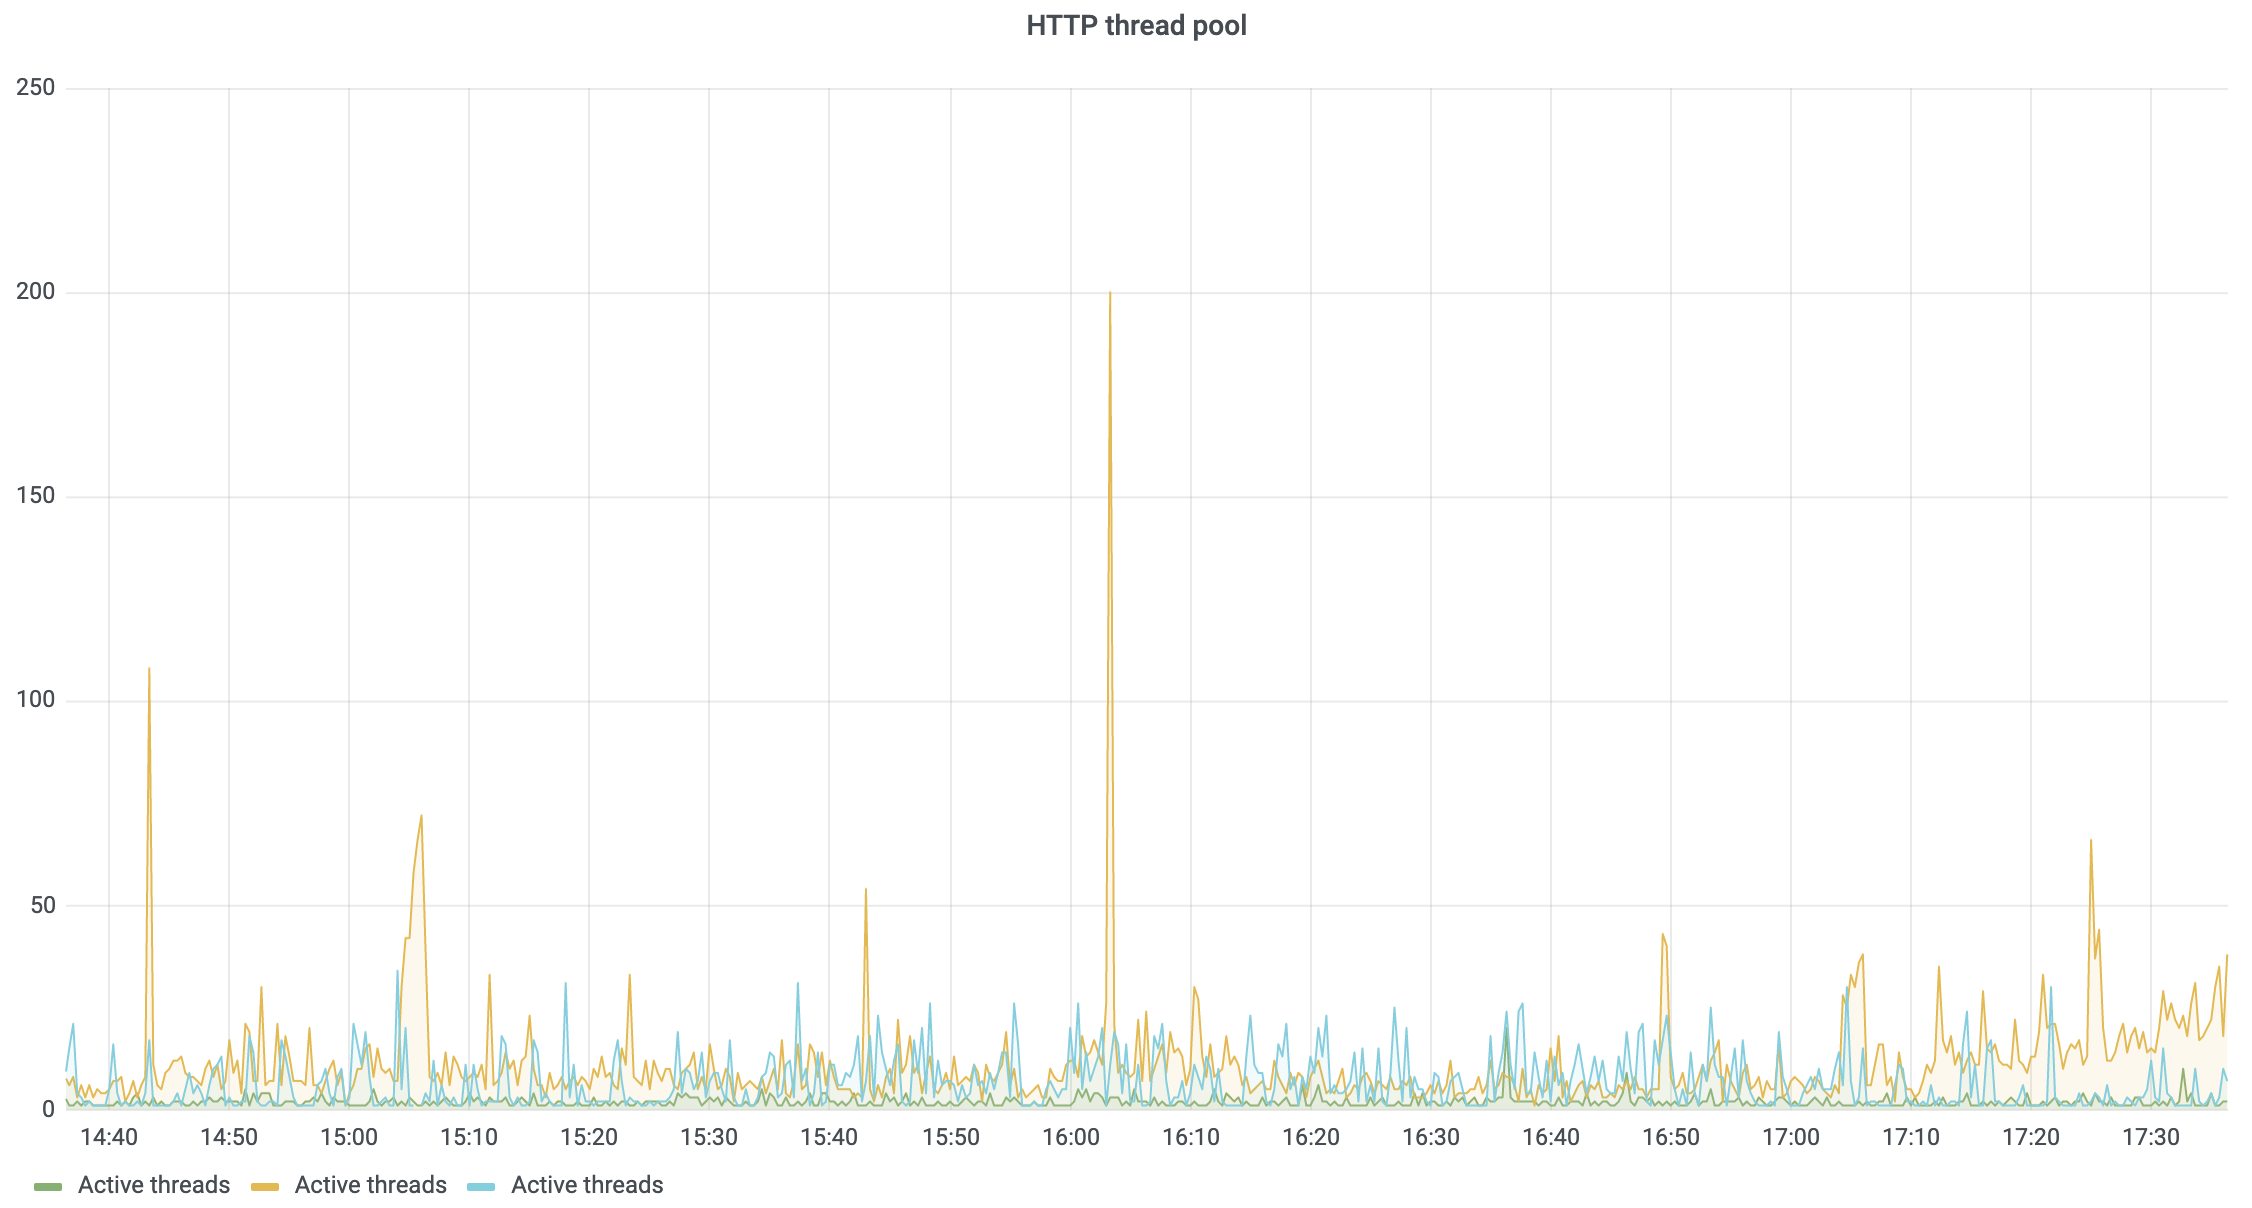
HTTP thread pool
TeamCity is a web application running inside a web server named Tomcat. This web server has a limit for the number of concurrently executing HTTP requests: 200. By default, each request is processed in a single thread. Once 200 threads are occupied by incoming requests, subsequent requests are placed into the queue. Once the queue fills up, a connection refusal is generated.
Obviously, 200 is a small number if there are thousands of clients. For instance, on a busy day, the CI server at JetBrains works with 2,500 agents simultaneously. On top of that, there are also several hundreds of users. Without special measures, we wouldn’t be able to handle so many clients reliably. For instance, the majority of requests from agents are processed asynchronously outside of the main HTTP thread pool, and they don’t affect the 200 thread limit.
Given the thread limit, monitoring the current number of active threads in the HTTP thread pool is important. When the server becomes unresponsive, it makes sense to check whether this pool is fully occupied, and if this is the case, to then take a look at the thread dump to find out which requests are being processed at that moment.
You can use the following metric to monitor the pool’s state:
| Metric name | Description | How to use it |
| executors_tomcatHttpThreadPool_activeTasks_number | Number of active/busy threads processing HTTP requests. | sum(executors_tomcatHttpThreadPool_activeTasks_number) by (nodeId) |
| executors_tomcatHttpThreadPool_poolSize_number | Maximum number of threads available for HTTP requests processing. | sum(executors_tomcatHttpThreadPool_poolSize_number) by (nodeId) |
The result can look as follows:
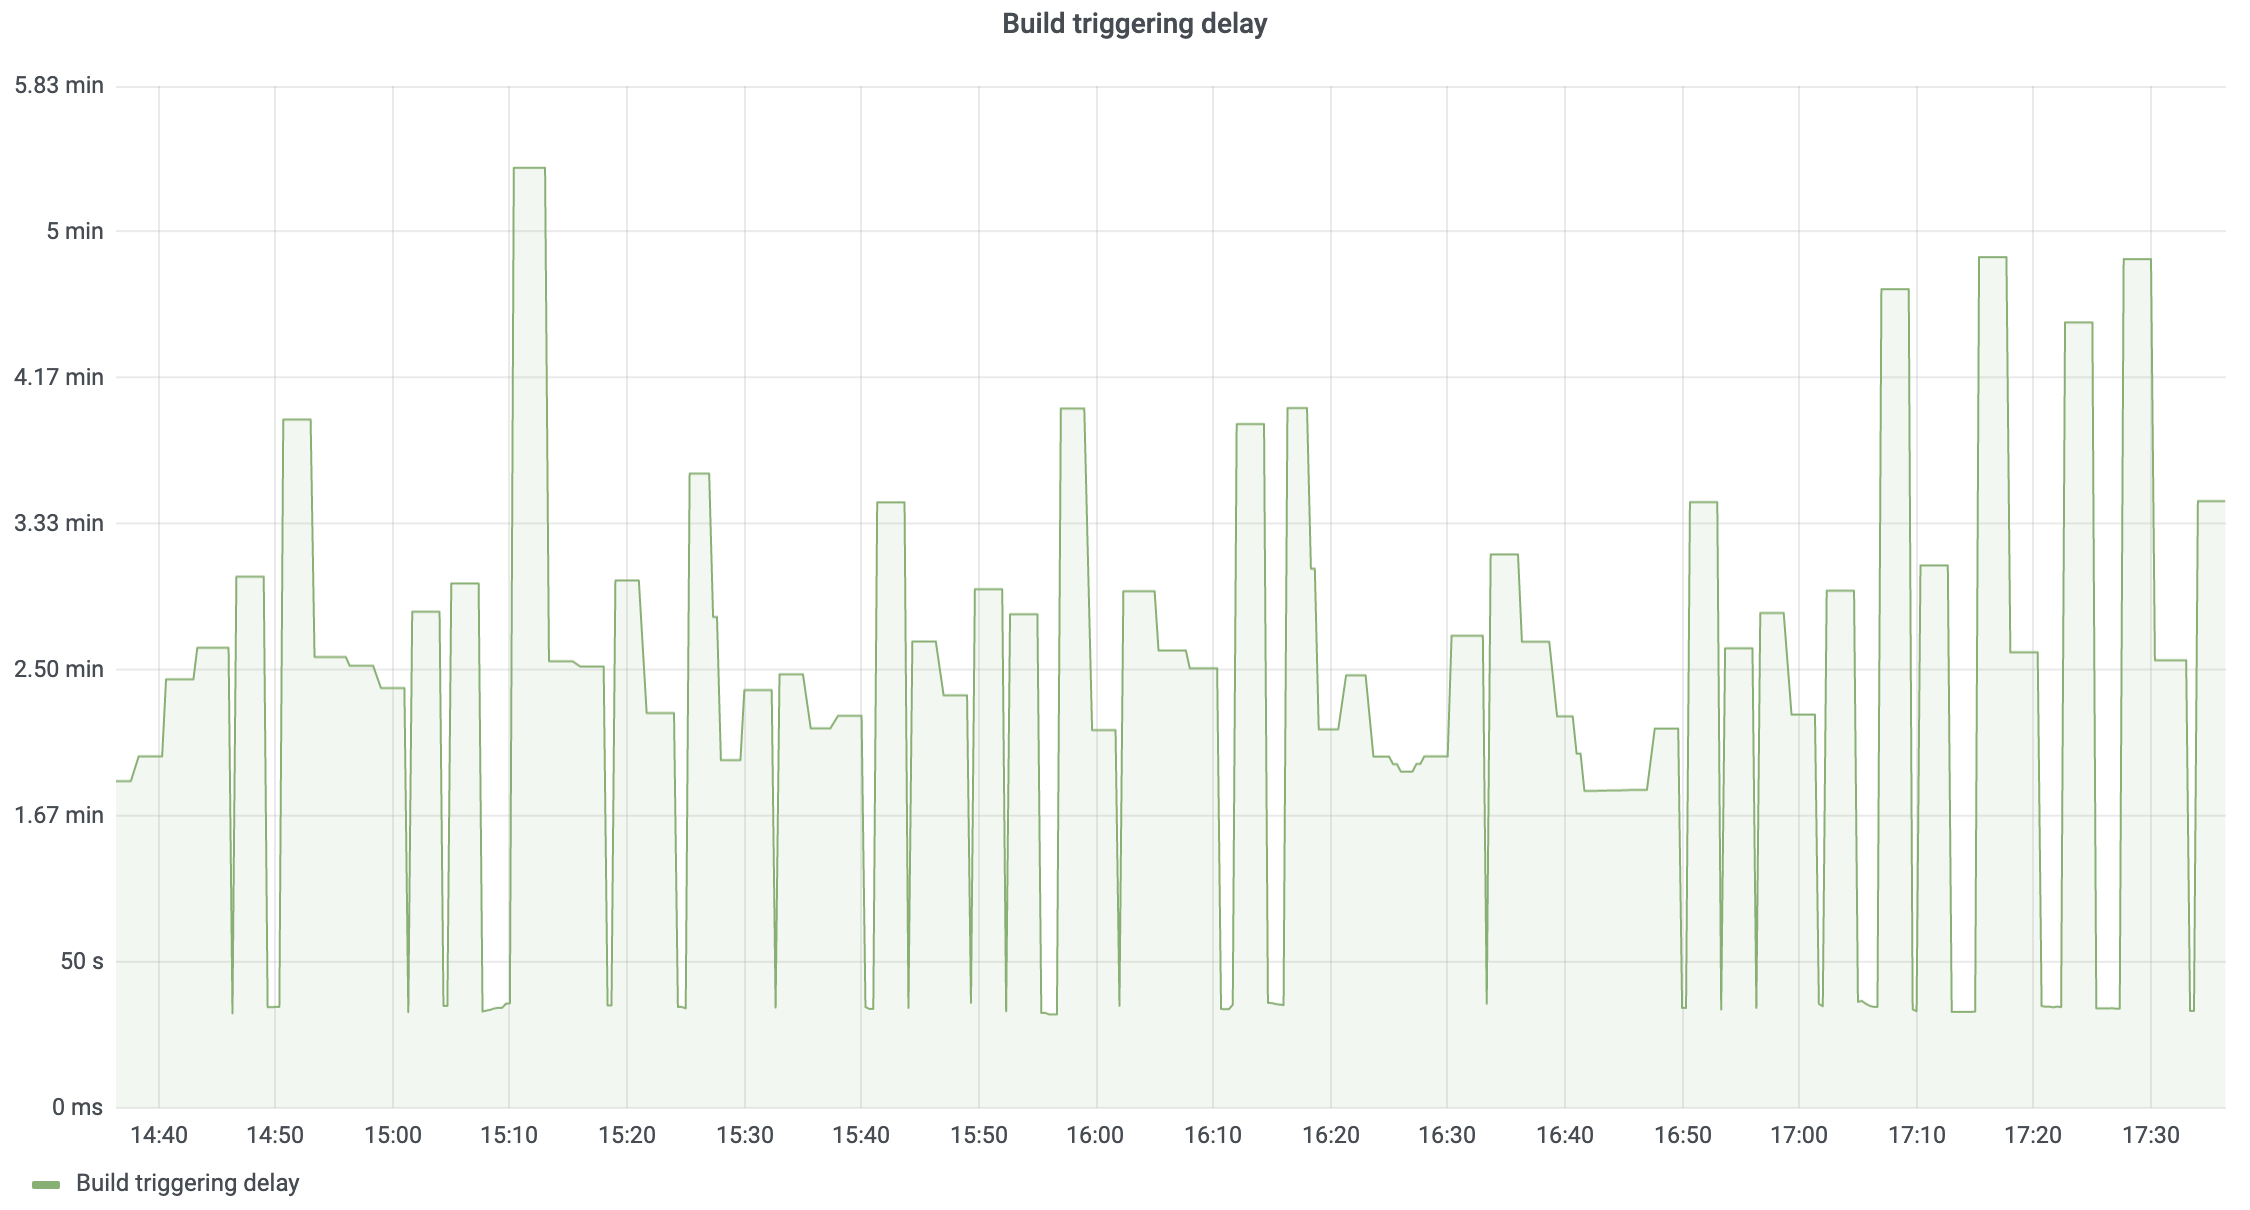
Build triggering delay
In TeamCity, builds are put into the build queue by build triggers. By default, all of the triggers are processed in a single thread. In a multi-node setup, it is possible to assign more than one node to process triggers. In this case, the triggers are divided among the nodes, and this reduces the delay of build triggering.
The time spent on the processing of all the triggers is reported as a separate metric. This time serves as a good estimate for the build triggering delay.
| Metric name | Description | How to use it |
| build_triggers_execution_milliseconds_total build_triggers_execution_milliseconds_count | Total time required to process all the build triggers and the number of times this processing has been called. | max(rate(build_triggers_execution_milliseconds_total[3m]) /rate(build_triggers_execution_milliseconds_count[3m])) |
Note: [3m] here stands for three minutes and indicates the interval at which the reported metrics are averaged. This interval is chosen heuristically, and while it works for our installation, yours might be different. Try to find what works best in your case based on on how long the triggering process takes.
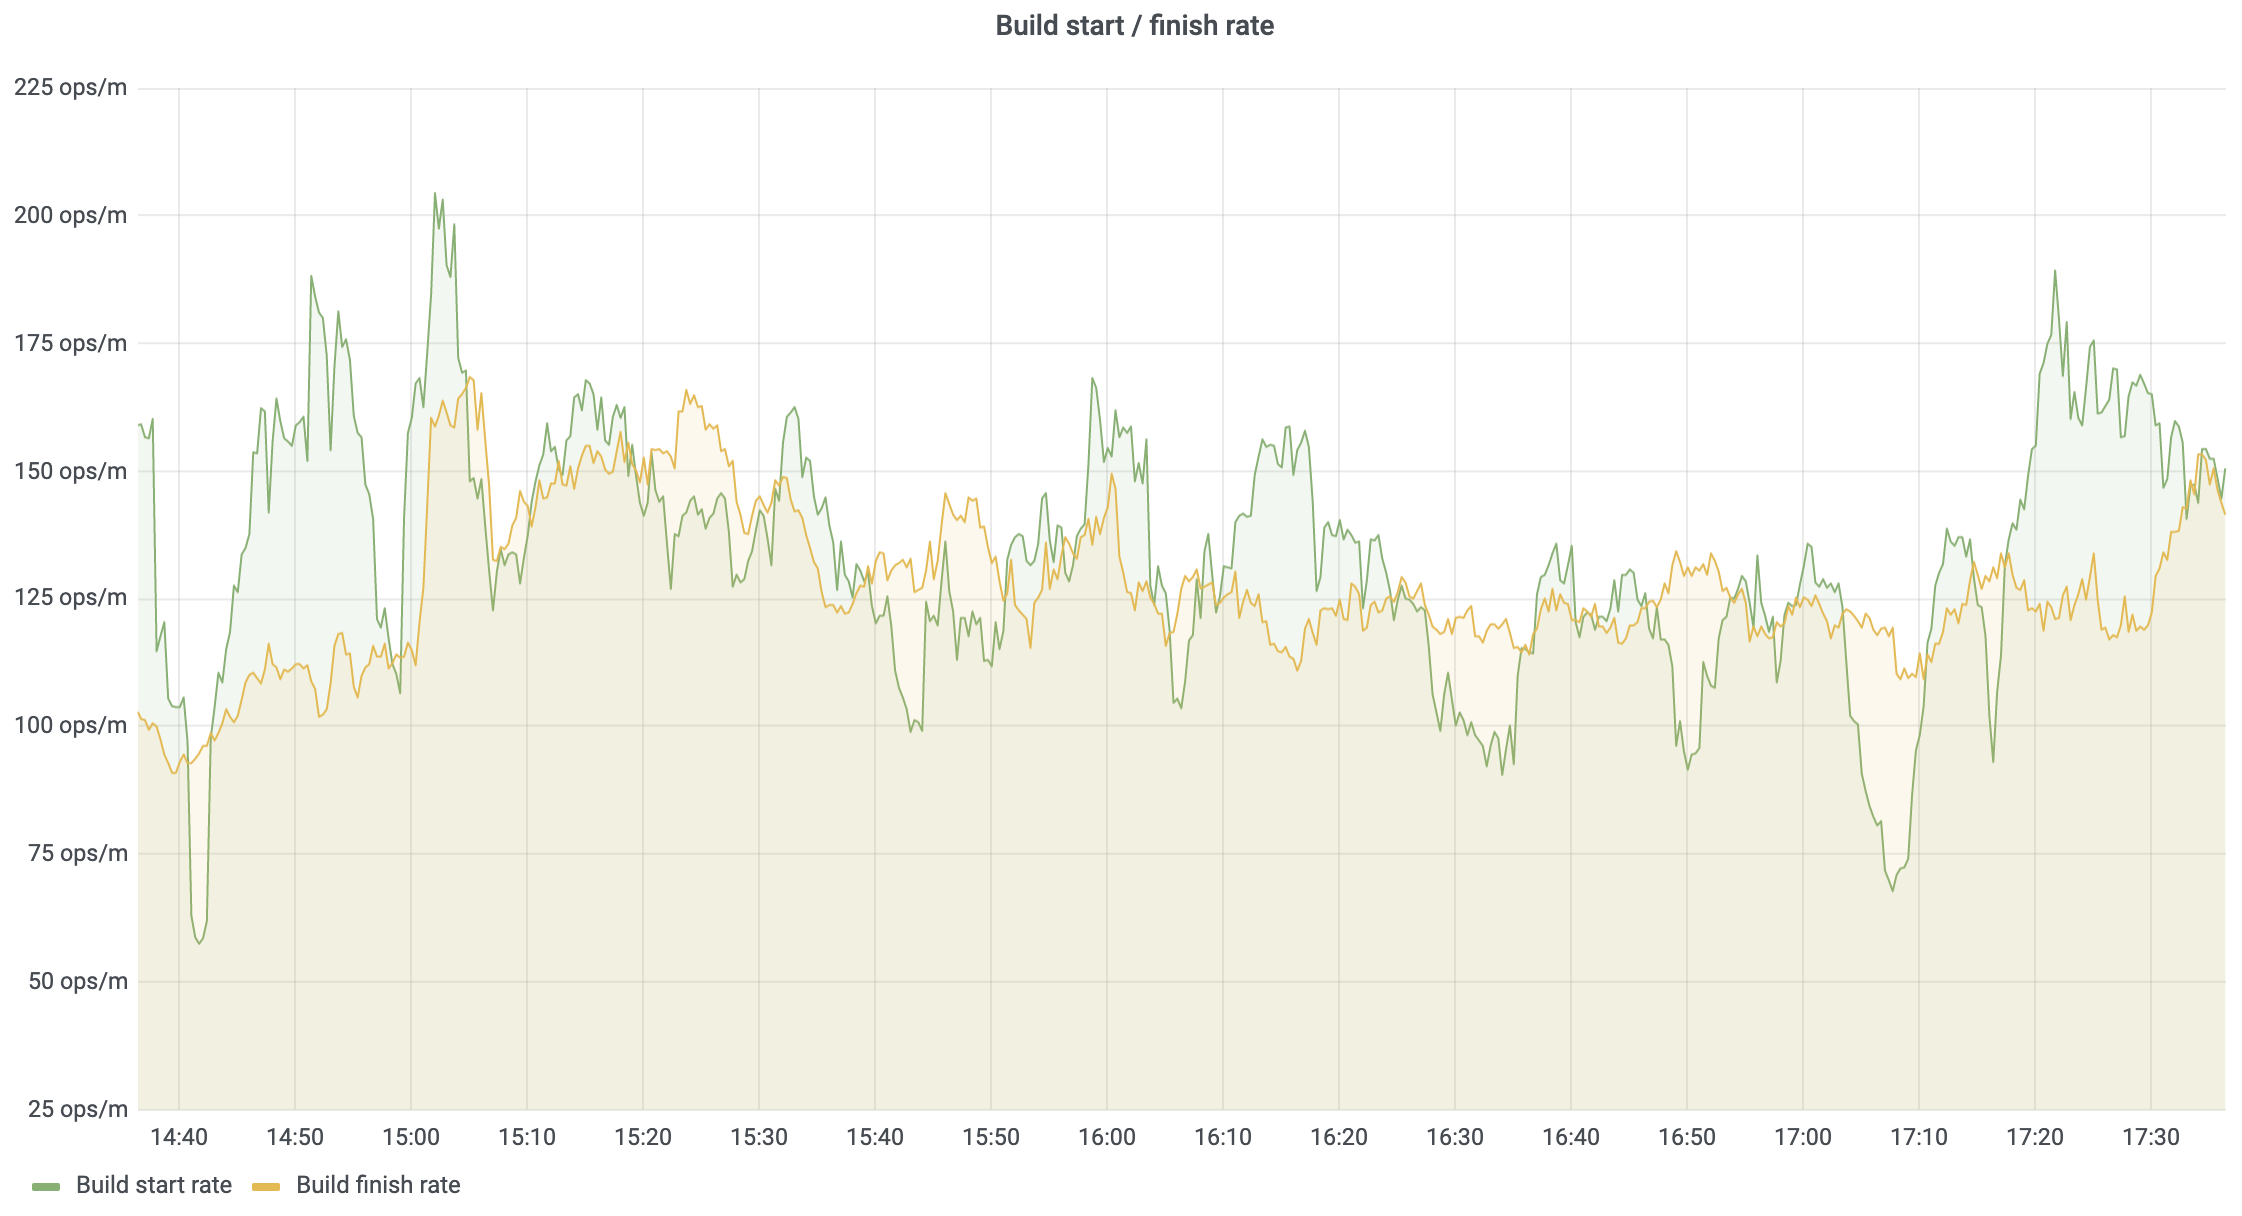
Build start and finish rate
It is possible to watch how many builds are starting and finishing across a defined period of time. For instance, if there are builds in the queue but the rate of the started builds is low, then something has happened that is preventing TeamCity from starting new builds quickly enough.
| Metric name | Description | How to use it |
| builds_started_number | The number of started builds. | max(rate(builds_started_number[5m])*60) |
| builds_finished_number | The number of finished builds. | max(rate(builds_finished_number[5m])*60) |
We’re using the max() function for the number of started and finished builds. This is because every TeamCity node reports the same number for these metrics. Thus there is no need to report them per node. Also note that both metrics are multiplied by 60 to provide measurements per minute.
Here’s an example of the resulting chart:
Unprocessed build log messages
Every running build constantly sends data to the TeamCity server. This data is represented as a collection of messages, and it is stored in an in-memory buffer, which is then flushed to the database or saved on disk. The number of buffered messages should be relatively low most of the time if the server is operating normally. On the other hand, if the server is not keeping up with processing of the incoming data, then the number of buffered messages will be constantly growing. There is also a limit to the buffer size, and as soon as it is reached, new messages from agents will be refused and agents will have to re-send these messages later.
Simply put, the larger the number of unprocessed messages in the buffer, the bigger the disconnect between the state of a build on an agent and the state of the build in TeamCity. In extreme cases, the build log can show data for the events that actually happened half an hour ago.
The following metric can be used to track the number of unprocessed messages in the queue:
| Metric name | Description | How to use it |
| runningBuilds_numberOfUnprocessedMessages_number | Sum of messages stored in in-memory buffers for all running builds. | sum(avg_over_time(runningBuilds_numberOfUnprocessedMessages_number[3m])) by (nodeId) |
In a multi-node setup, it makes total sense to monitor this metric per node, as multiple nodes can be configured to process incoming data from agents.
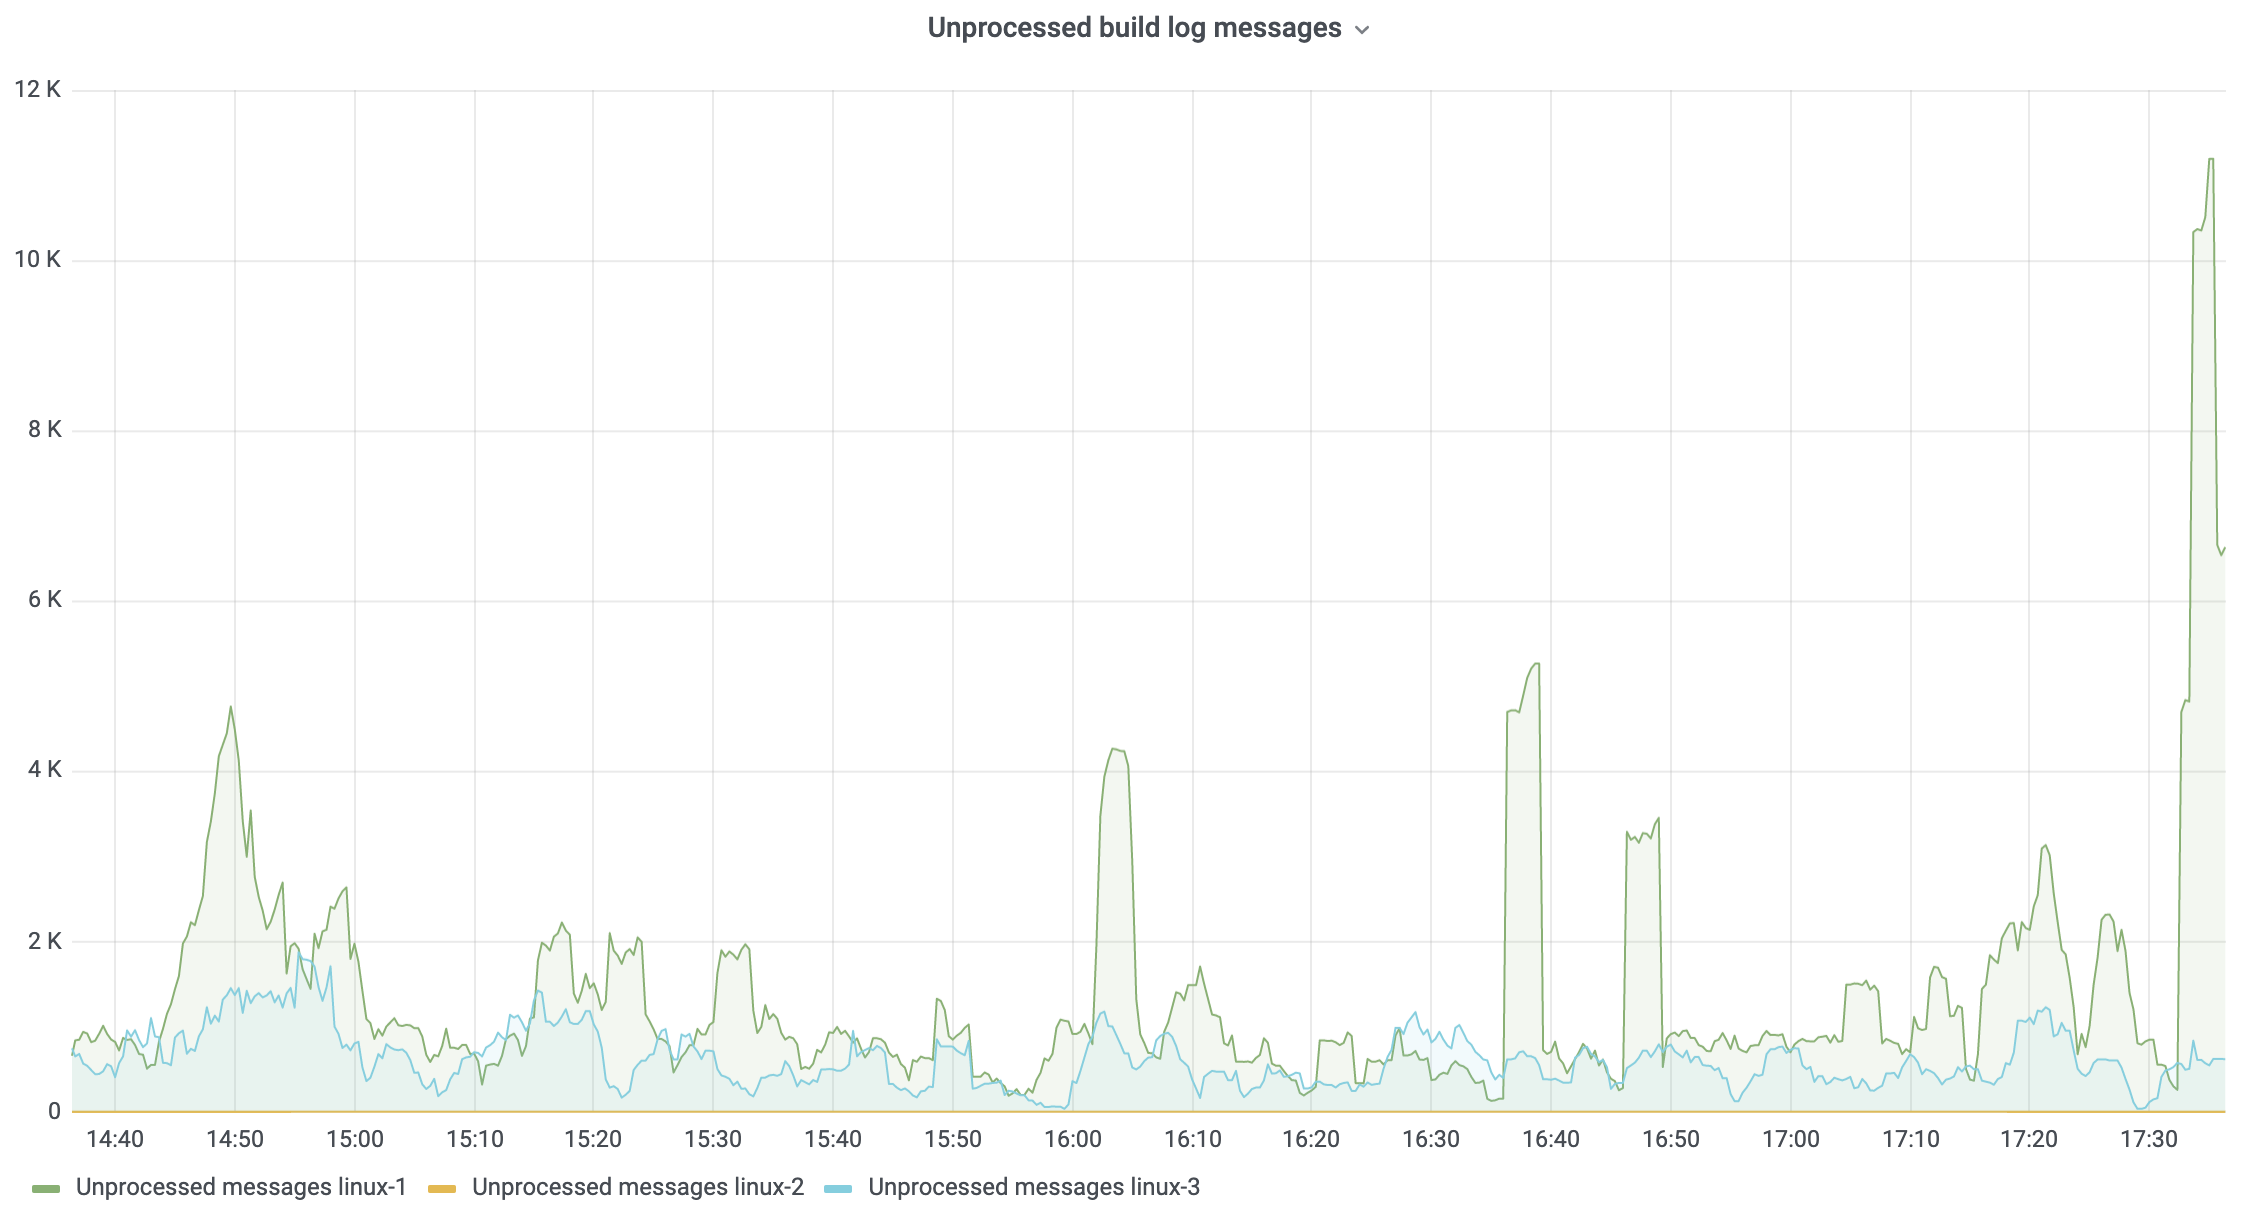
Note that the reported number is the total for all running builds. The default buffer capacity per single running build is 1,000 messages. Thus, having several thousands of messages in the buffer is normal for a large server. However, problems can arise if the buffer is filled up and remains full for a long period of time.
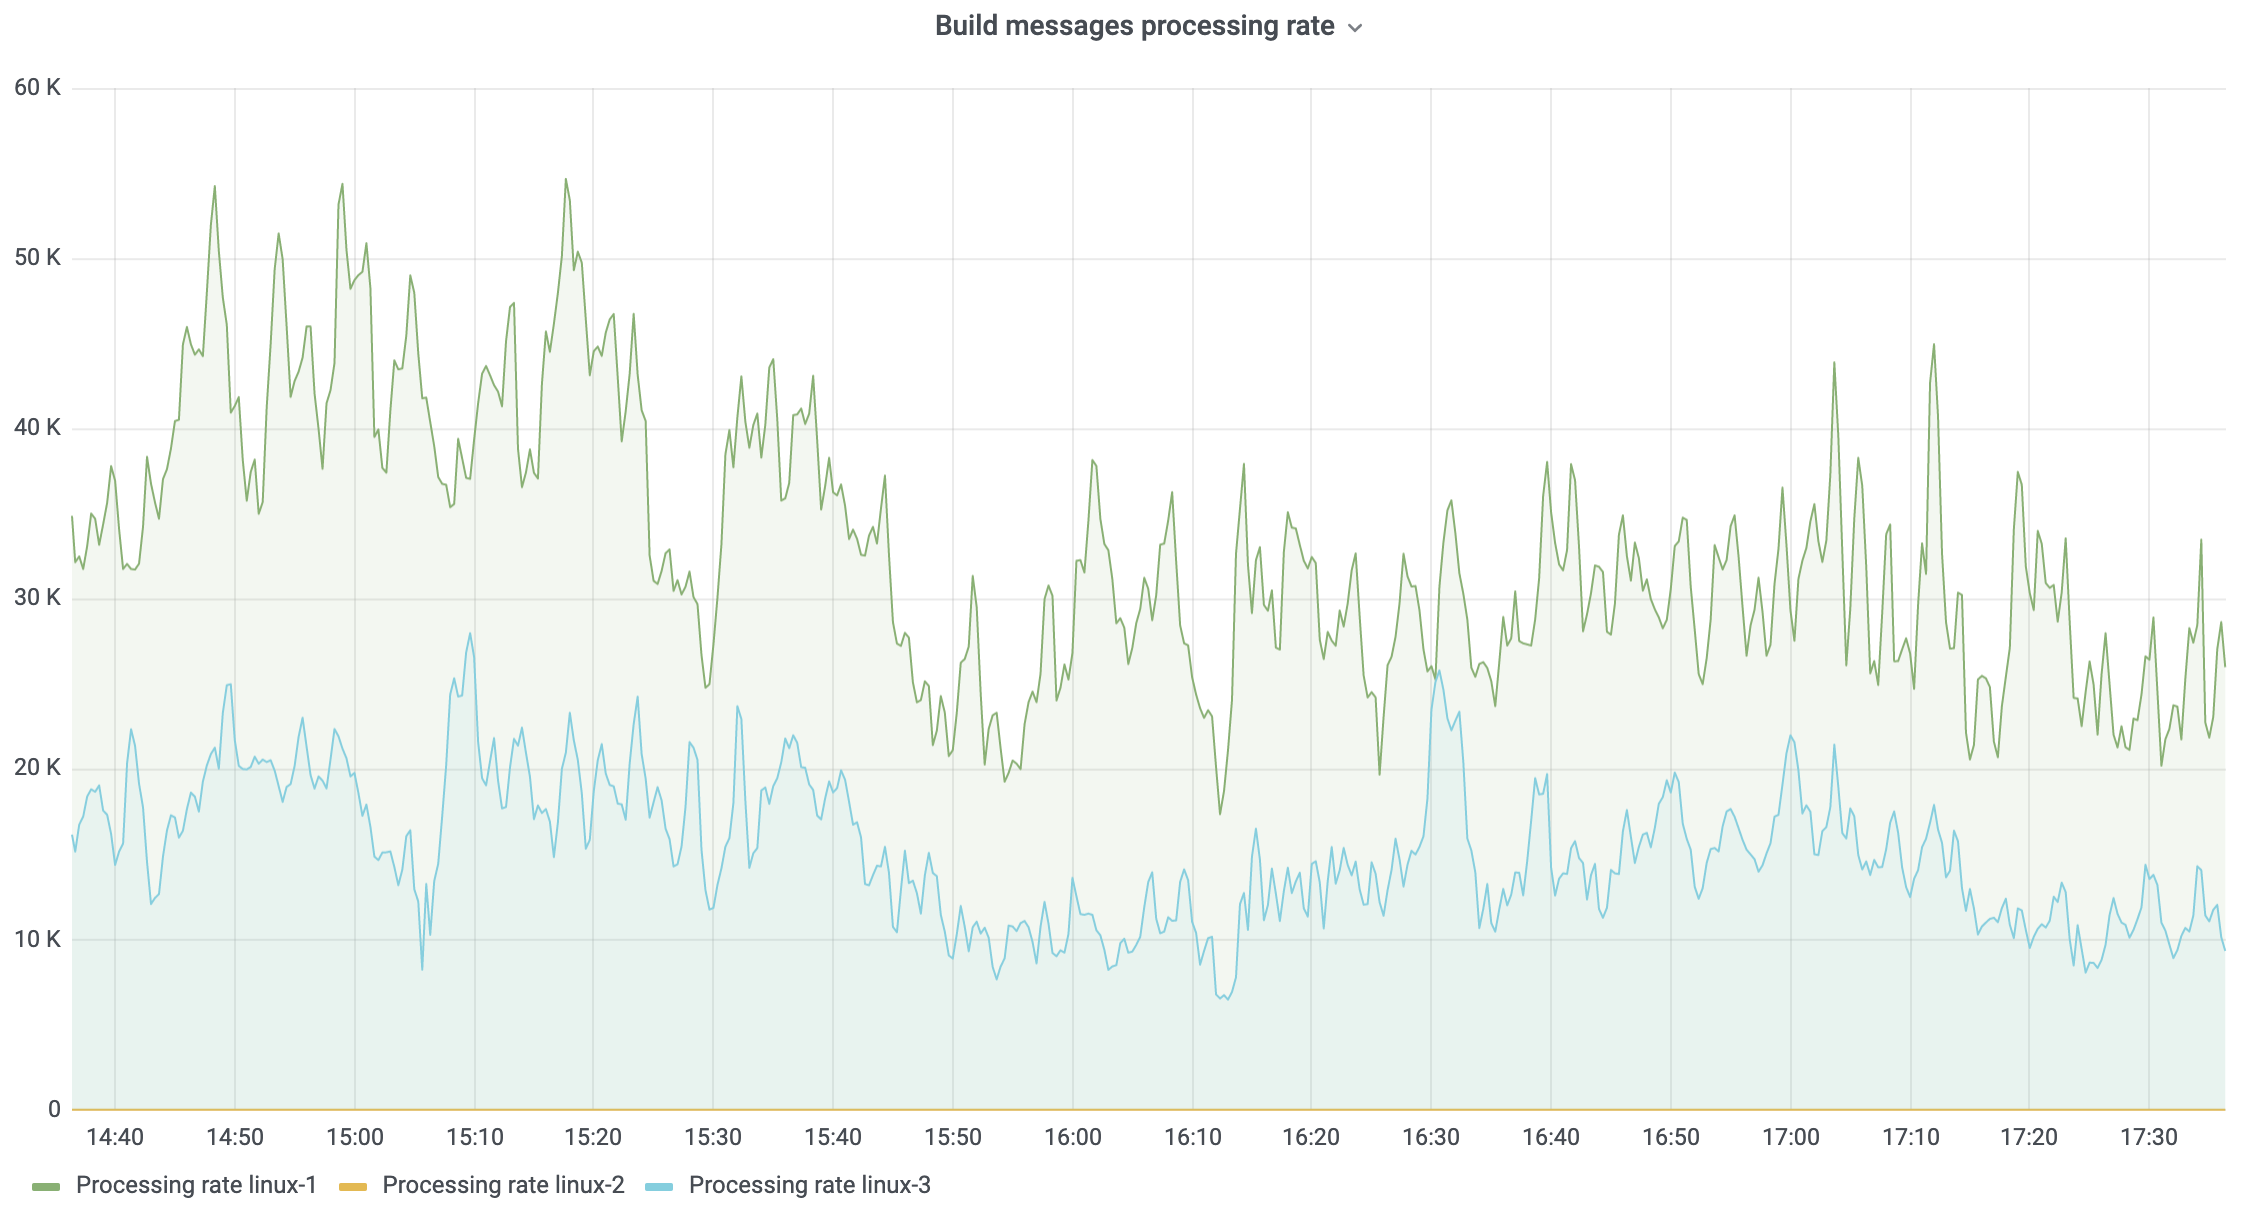
To complement this metric, you can also monitor the rate at which messages are being processed on the server:
| Metric name | Description | How to use it |
| build_messages_processing_number | Total number of processed build log messages. | sum(rate(build_messages_processing_number[1m])) by (nodeId) |
The formula above computes the number of processed messages per second across a 1-minute period, and the resulting chart should look something like this:
Active database connections
When TeamCity needs to store some data in the database, it obtains a database connection from the pool, runs an SQL query, and then returns the connection back to the pool. Each connection occupies a certain amount of memory, on both the TeamCity server and on the database side, so it’s not possible to have a very large number of connections. By default, this limit is set to 50 per TeamCity node. So, if you have 3 nodes in the TeamCity cluster, then there will be 150 database connections open to the database.
If there are no problems with SQL queries or with the database itself, then the connection is only used for a short period of time and the number of connections does not reach the limit. But if something goes wrong, then all the connections can be taken from the pool and they may not be returned for a long time. Eventually this will result in “Database connection pool exhausted” errors.
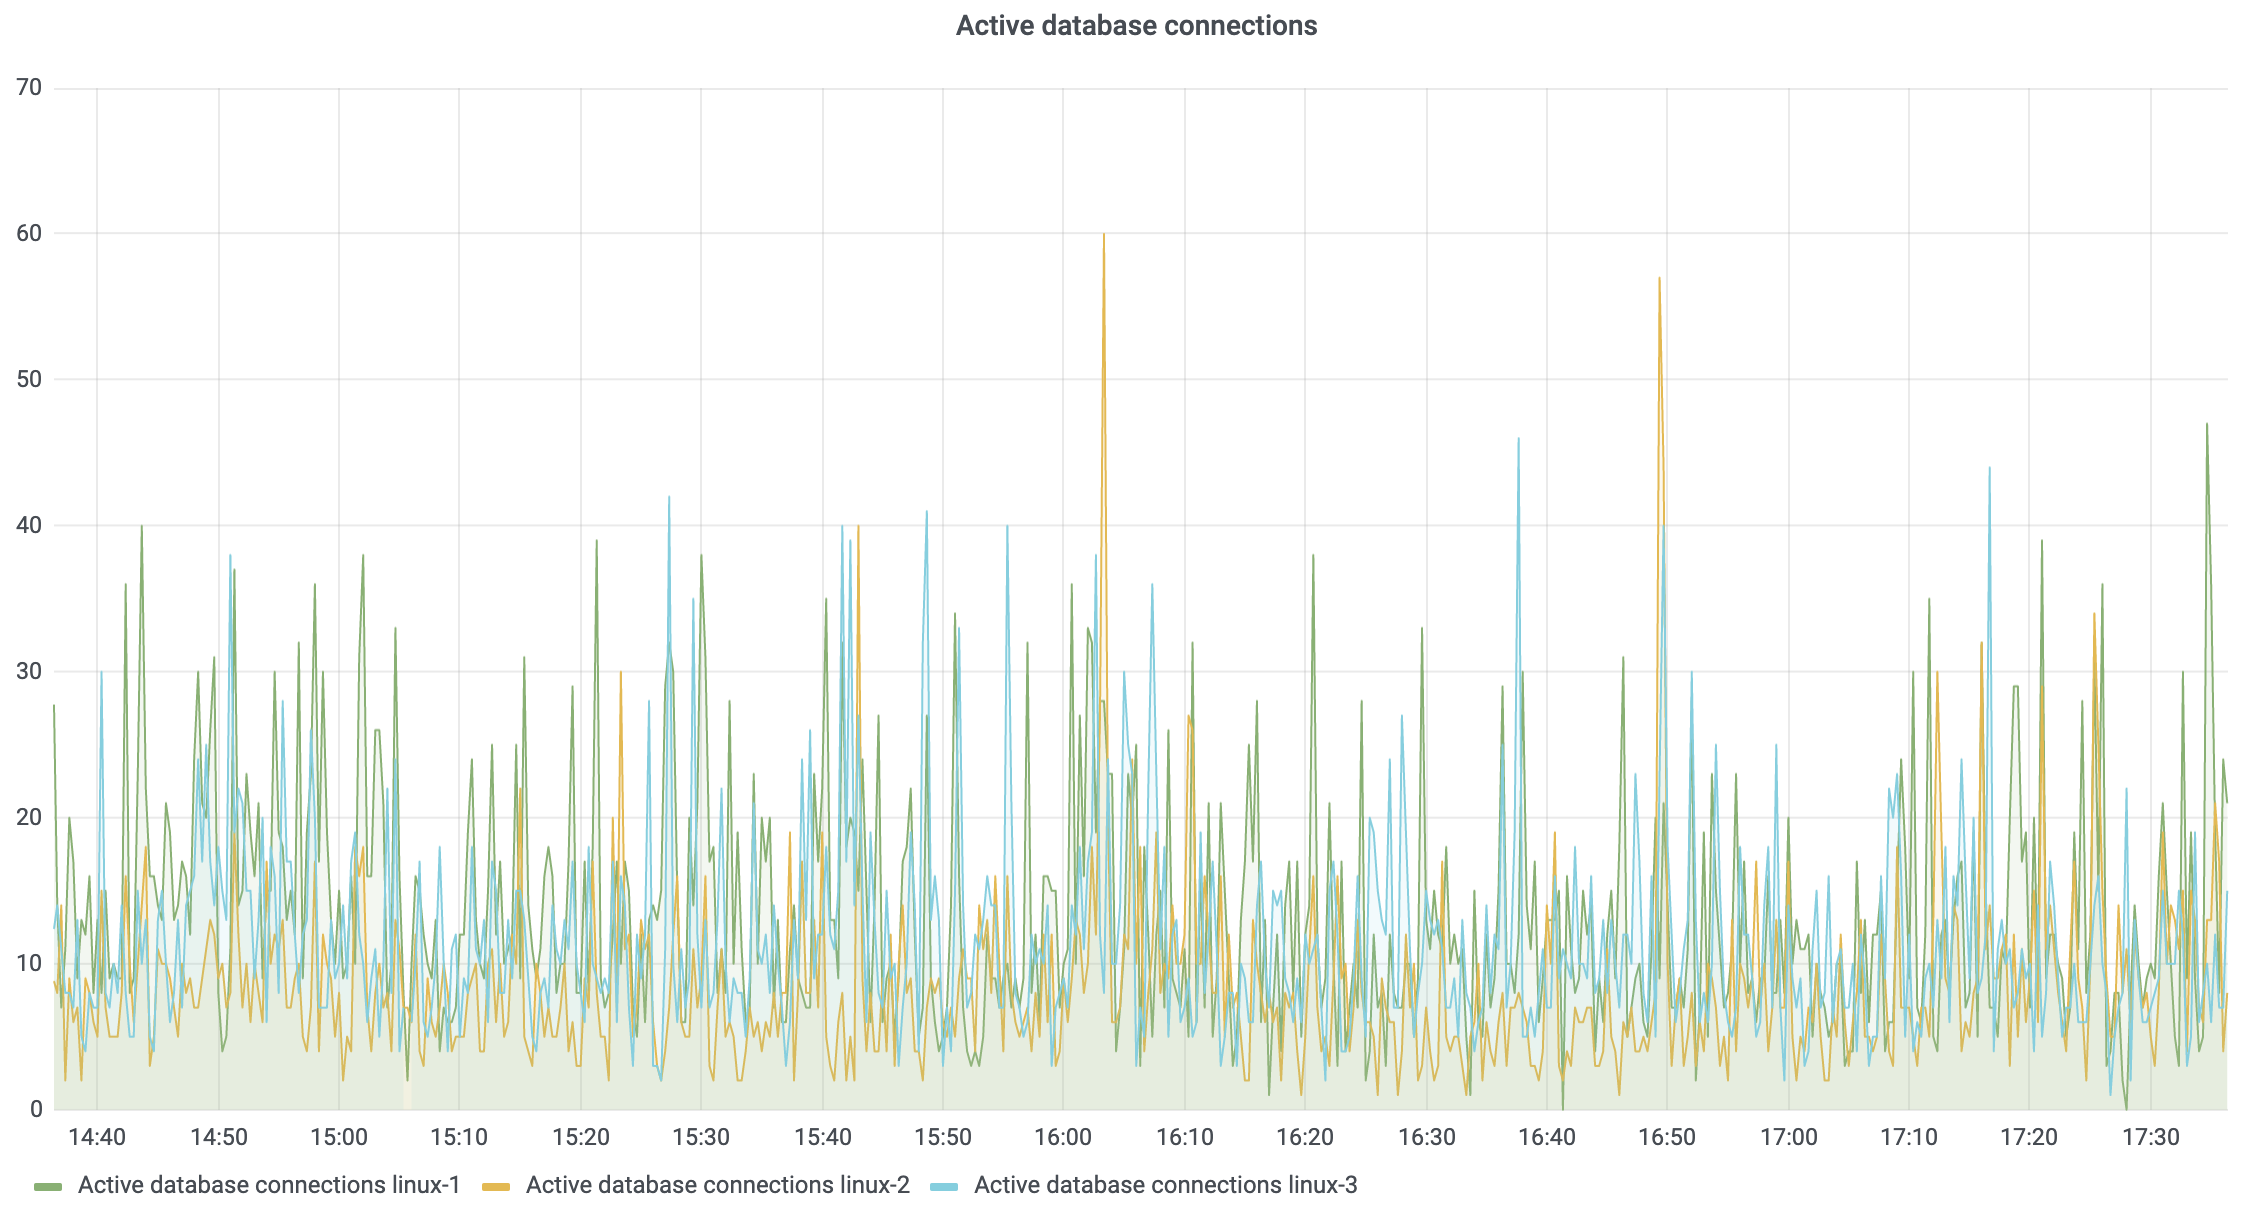
The following metric can be used to monitor the current number of active connections:
| Metric name | Description | How to use it |
| database_connections_active_number | The number of database connections taken from the pool where SQL queries are executed. | sum(database_connections_active_number) by (nodeId) |
The result:
Conclusion
If you already have Grafana set up and running with TeamCity metrics available, then you can import this example dashboard, which contains all of the metrics described in this post.
Otherwise, we highly recommend setting up a metrics collector and Grafana for your TeamCity server. This would give you the ability to react to any problems you encounter faster, with a much better understanding of the potential issues at hand.
? See also: What’s New in TeamCity
Happy building!