WebStorm 10 EAP, 140.2753: V8 profiling, TypeScript 1.4 and built-in TypeScript compiler

The new Early Access build for WebStorm 10 (140.2753) is now available for trying. You can download it and install side-by-side with WebStorm 9. An update from the previous EAP build is available, however, you may need to manually restart the IDE after the update.
While we continue improving JavaScript support and performance, we want to introduce two great new features: V8 CPU and memory profiling for Node.js applications, and a built-in TypeScript compiler.
In other great news, support is now available for the new TypeScript 1.4 features: Union Types, Type Guards, Let and Const keywords, Template strings, and more.
For the full list of addressed issues, see the release notes. If you experience any issues, please report them to our tracker.
Read about other new features that we’ve added in WebStorm 10 EAP:
- Application dependency diagram;
- JavaScript support improvements, distraction free mode, simultaneous HTML tag editing.
V8 CPU and memory profiling
Please meet a new V8 profiling feature that allows you to capture and analyze CPU profiles and heap snapshots for your Node.js applications. You can also open and explore heap snapshots captured in Google Chrome’s DevTools for your client-side code.
This post will help you get started with V8 profiling in WebStorm; later we’ll publish a more detailed guide.
V8 CPU profiling
With V8 CPU profiling you can get a better understanding of which parts of your code take up the most CPU time, and how your code is executed and optimized by the V8 JavaScript engine.
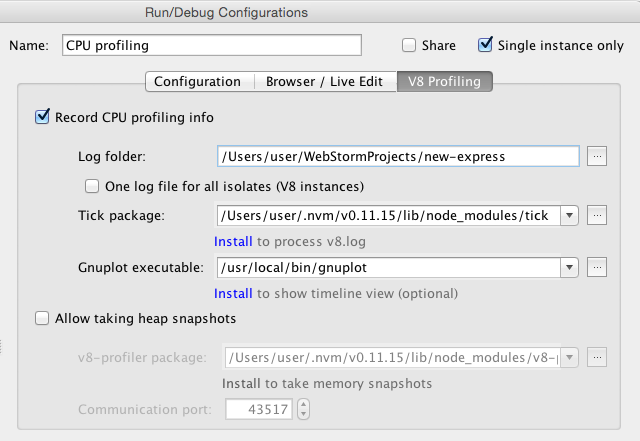
In the Node.js Run configuration, go to V8 profiling tab and enable CPU profiling.
To process the profiling log files, WebStorm needs the help of a third-party Node.js module called tick, which can be installed via npm (run npm install -g tick). If you want to explore a timeline view that shows where V8 is spending time, you also need to install Gnuplot (we recommend using apt-get on Linux and Homebrew on Mac for Gnuplot installation, so that all the required dependencies are installed as well).
Specify the paths to the tick module and Gnuplot executable in the configuration and you’re ready to go. Run the configuration, execute the scenario that you would like to profile, and then stop the process.
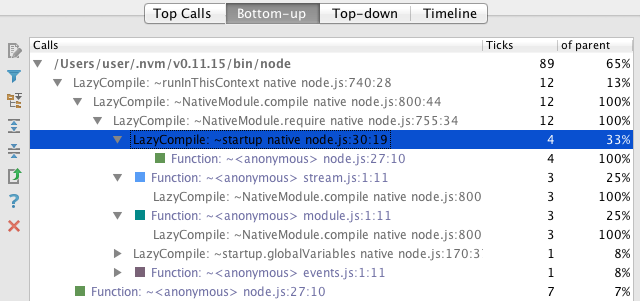
You can look through the call trees and other results in the profiling tool window. We’ll do a follow-up post with a more detailed overview of the tool.
Heap profiling
To start memory profiling, select Allow talking heap snapshots in the Node.js run configuration.
Please install and specify the path to Node.js v8-profiler (run npm install -g v8-profiler), as required for snapshot processing.
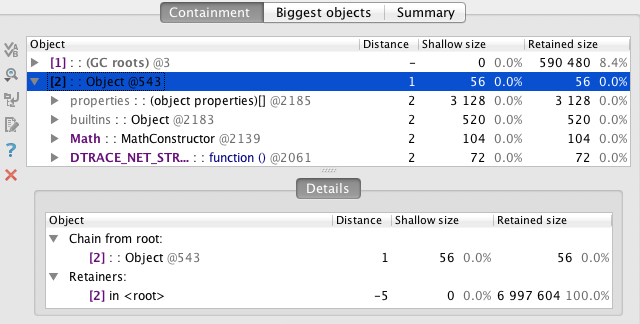
Once you’ve started your configuration, click the Take Heap Snapshot icon on the Run or Debug tool window control panel. You will see a new tool window with the snapshot analysis results.
You can also open and explore profiles and snapshots captured in Google Chrome’s DevTools for the client-side JavaScript app or previously captured in WebStorm for Node.js app. Go to menu Tools – V8 profiling and select either Analyze V8 CPU profiling log… or Analyze V8 Heap snapshot…, and then select the file you want to analyze.
TypeScript 1.4 and Built-in compiler
WebStorm adds support for the latest TypeScript 1.3 and 1.4 features. Please let us know if you have any false warnings or red code in your TypeScript code in WebStorm.
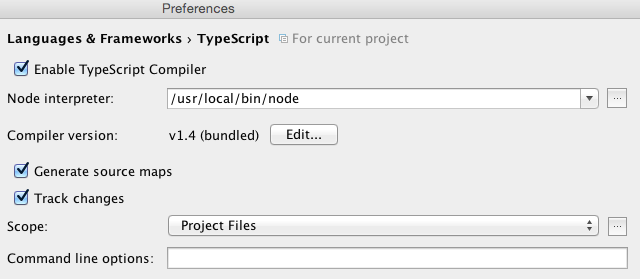
WebStorm now features a built-in TypeScript 1.4 compiler. We recommend using it instead of the TypeScript file watcher. You can enable in for your project in Preferences | Languages and Frameworks | TypeScript. Select Track changes if you want to compile your code to JavaScript on changes. The action TypeScript Compile all is available from the search action popup (Alt+Shift+A) or from the TypeScript compiler tool window.
Scratch files
As you may know, WebStorm 9 added an opportunity to create Scratch file (Tools – New Scratch file), temporary files with notes, or code samples. Now all scratch files created across your projects are saved in the IDE settings, and can be executed like any JavaScript file (using Node.js run/debug configuration). You can see all the files in the Project view (select Scratches from the drop-down list).
Go ahead, download and install WebStorm 10 EAP build right now. A patch update is available from WebStorm 10 EAP, build 140.2543. And if you have a minute, please submit your feedback to our issue tracker—thanks!
Develop with pleasure!
– JetBrains WebStorm Team