WebStorm 12 EAP, 144.3143: remote debug for Node.js, unused imports warning, debugging Electron and more

A new WebStorm 12 EAP build is now available! The highlights of this update include: running and debugging Node.js apps remotely from the IDE, unused import warning for JavaScript and TypeScript, more improvements in Angular 2 support, and more.
As always, you can download it here or, if you have a previous EAP build (144.2925) installed, you should soon get a notification in the IDE about a patch update.
Read about the features and improvements added in other WebStorm 12 EAP builds:
- WebStorm 12 EAP, 144.3600: Support for Git worktrees, updated look and feel of the Git Log, Missing import statement inspection for JavaScript.
- WebStorm 12 EAP, 144.3357: SSH Console, Extract field refactoring in TypeScript, support for debugging Node.js apps built with Webpack, and more.
- WebStorm 12 EAP, 144.2925: Inline rename, smarter auto-imports and Optimize imports action for TypeScript, debugging async client-side code, and improvements in Angular 2 support.
Unused imports warning
WebStorm will now highlight any unused ES6 imports in JavaScript and TypeScript files.
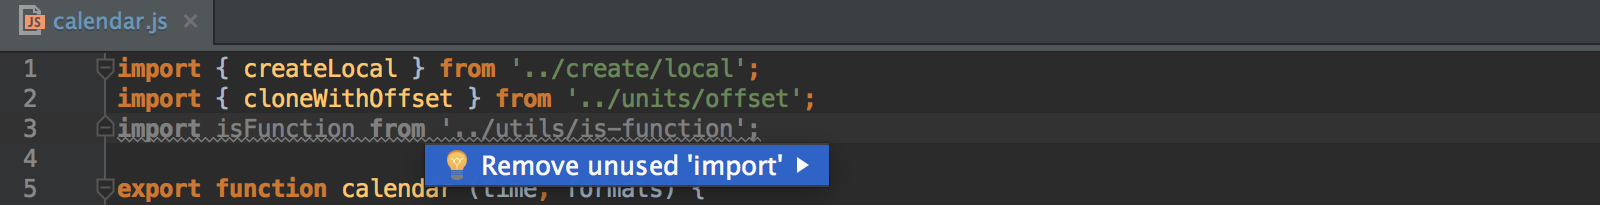
With Optimize imports (Ctrl-Alt-O) (which now also works in JavaScript files), you can get rid of any unused imports and merge multiple import statements for symbols from one module. Or you can remove each unused import individually using a quick-fix – just press Alt-Enter on the highlighted import.
Code folding for ES6 imports
Import statements in JavaScript and TypeScript files are now folded by default.
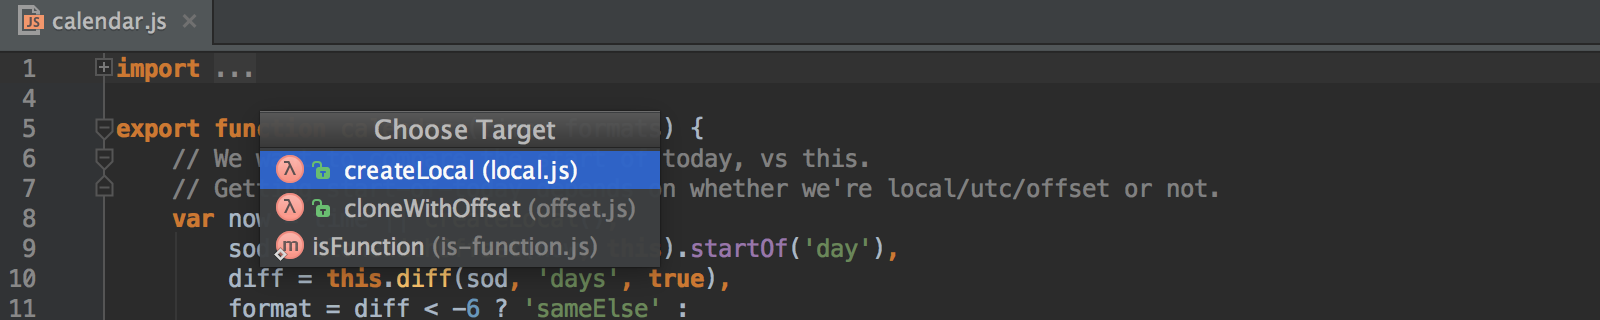
With the updated Related symbols… action (Cmd-Ctrl-↑ on OS X, Ctrl+Alt+Home on Windows and Linux), you can see the list of imported symbols and jump to their definitions.
Code assistance in tsconfig.json, .babelrc and .eslintrc
WebStorm now provides smarter code completion based on JSON Schemas in tsconfig.json, .babelrc and .eslint configuration files. Press Alt-Enter or just start typing to get a list of all properties and their available options.
Remote run and debug for Node.js apps
One of the biggest new features in WebStorm 12 EAP is that you can now run and debug your Node.js apps on a remote server or Vagrant box right from the IDE.
To set up a Remote Node.js interpreter, click the … button to the right of the Node.js interpreter field in the Node.js run/debug configuration. Then click + and select Add Remote. You can configure a remote interpreter using an existing SFTP deployment configuration or Vagrantfile, or by entering SSH credentials.
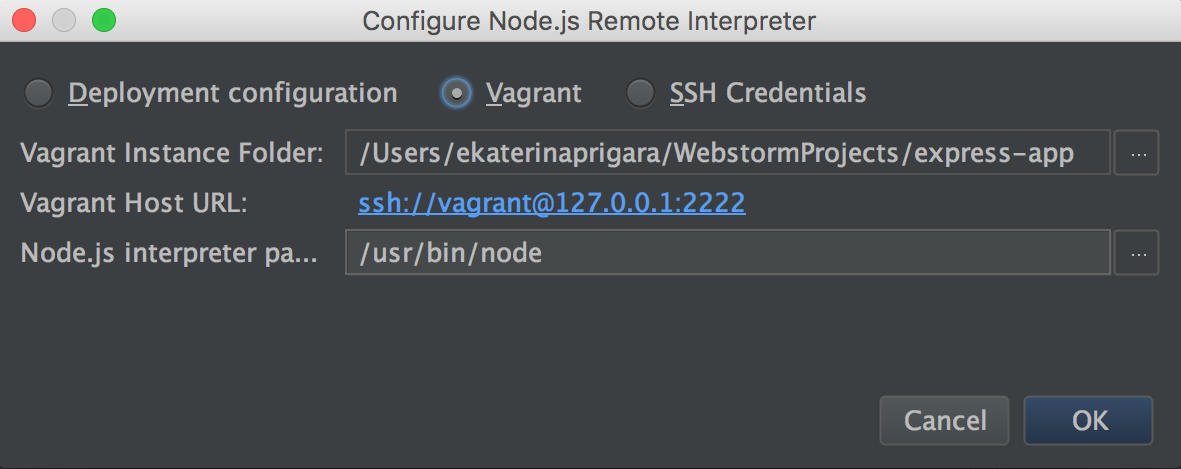
If you’re using SSH credentials, you need to configure a mapping between the local project root and its remote location in your run/debug configuration.
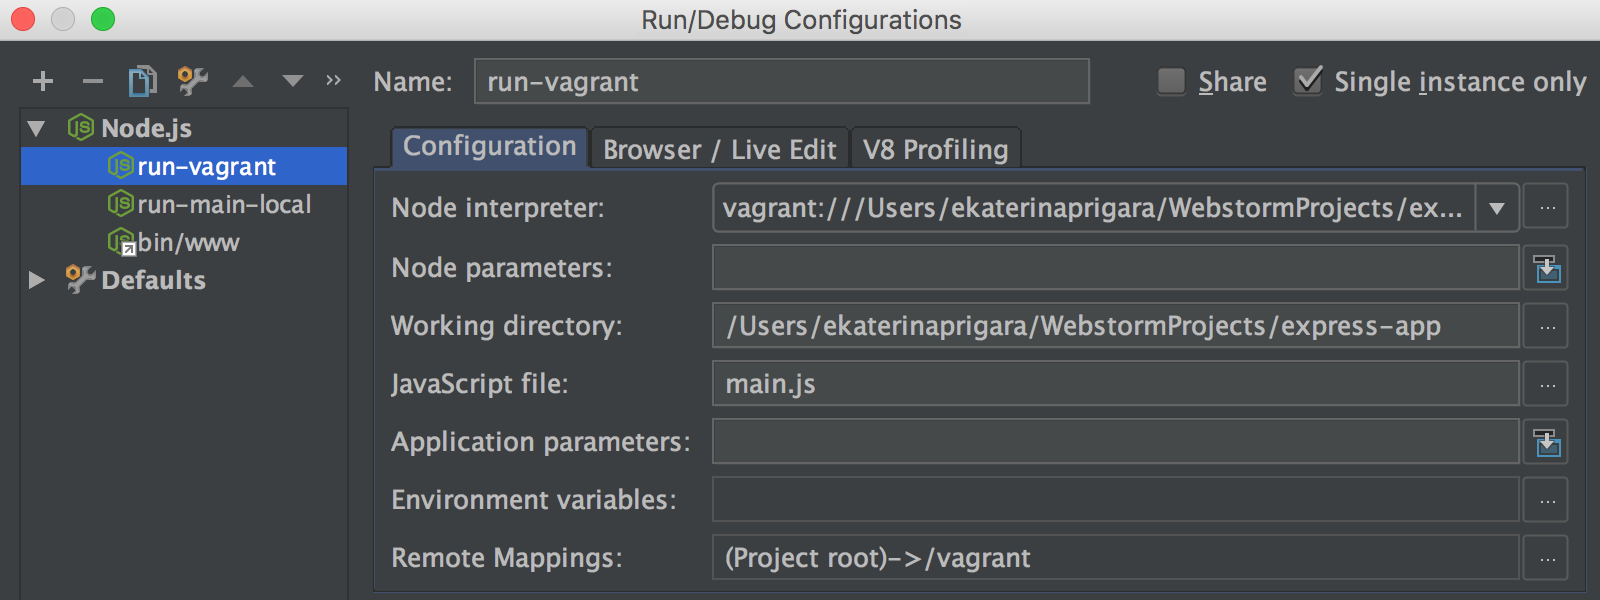
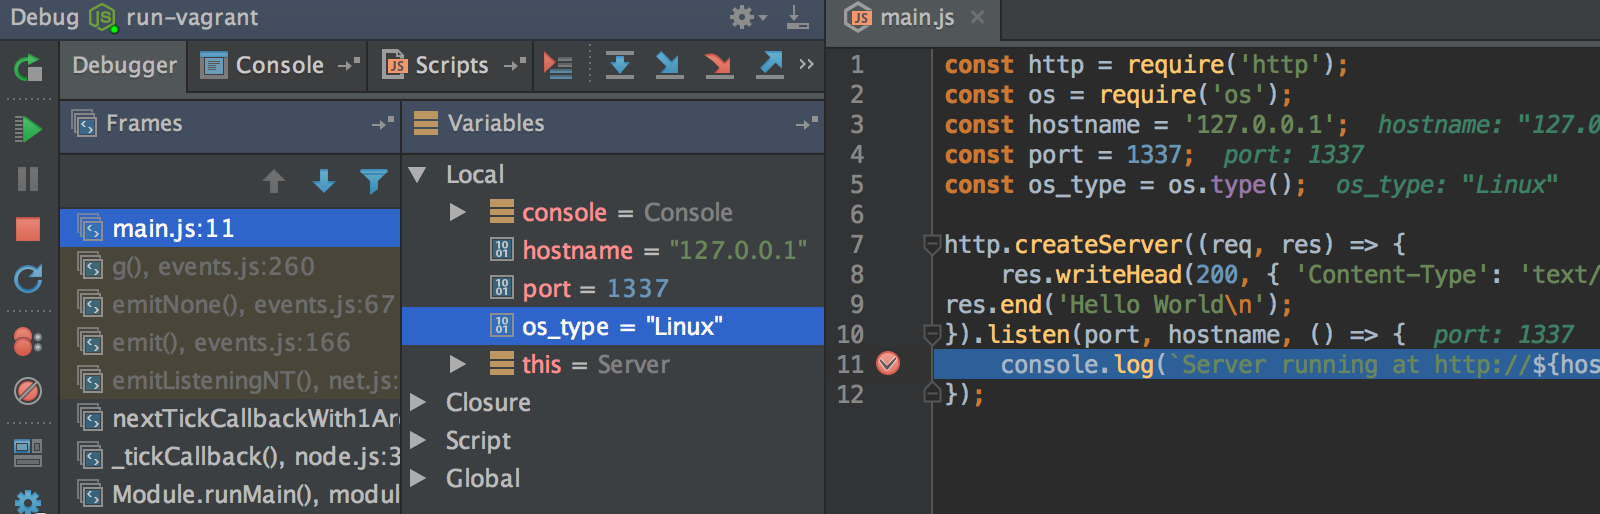
Then specify the JavaScript file you need to run, save the configuration and you’re ready to go – put the breakpoints in your code and click Debug.
Vagrant integration
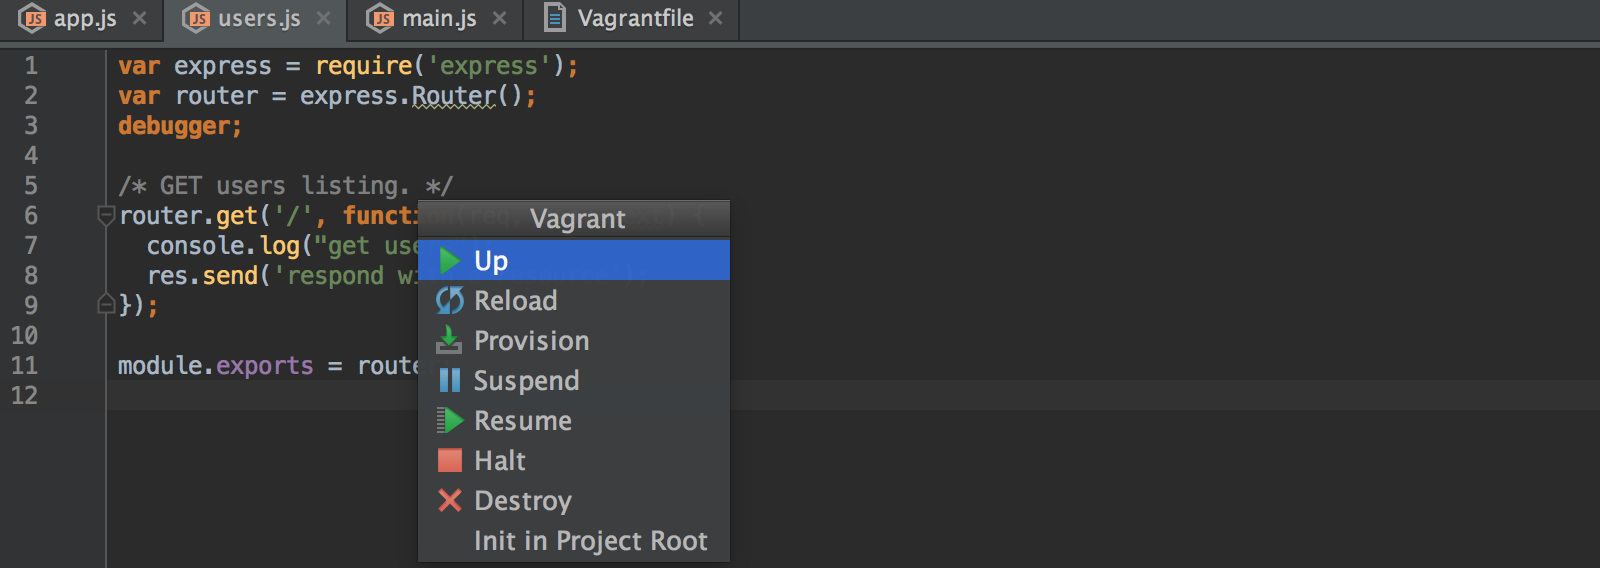
Integration with Vagrant is now available in WebStorm out-of-the-box. You can run, reload and stop the Vagrant box from the IDE, without using the command line.
Press Cmd-Shift-A, type Vagrant and press Enter to access the list of available Vagrant commands or assign this action to a shortcut of your choice in Preferences | Keymap.
Angular 2 support improvements
Lots of improvements in Angular 2 support have landed in this EAP build.
Paths in templateUrl and styleUrls fields are now resolved and you can in one click jump to the file.
WebStorm will now inject JavaScript inside any bindings so you can enjoy code completion.
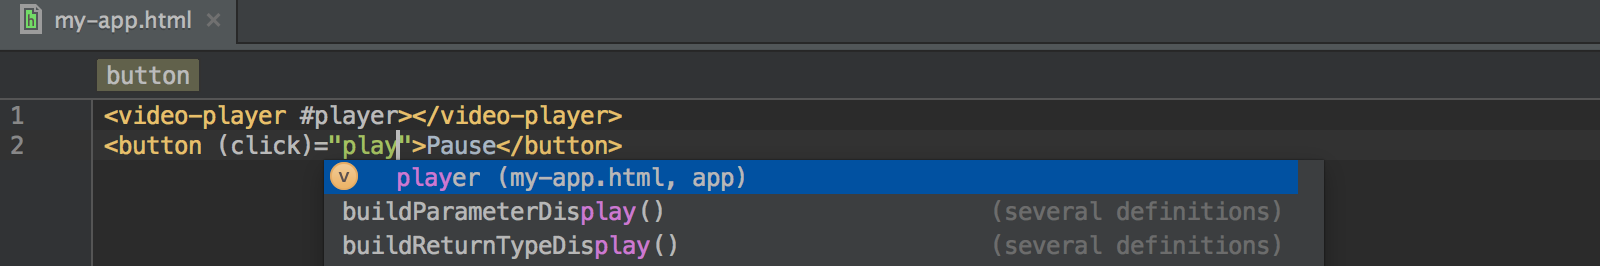
You can now get coding assistance and type inference for the variables defined in the template.
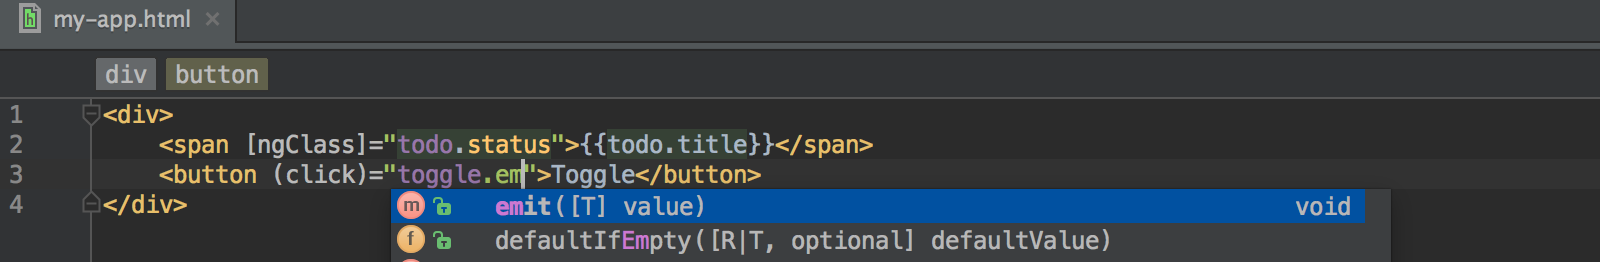
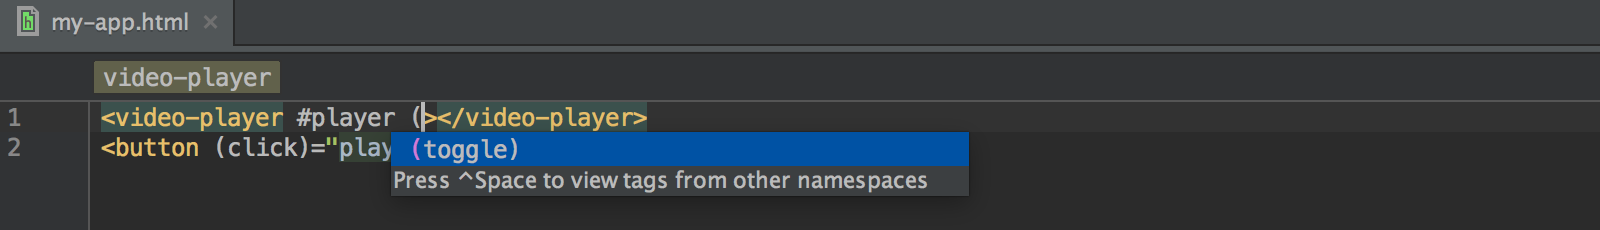
Other improvements include code completion and resolve of custom event handlers defined in the component with the @Output decorator.
Debugging Electron applications
Now you can debug Electron applications with WebStorm.
To debug the app’s main process, you need to create a Node.js run/debug configuration and specify the path to the Electron executable in the Node.js interpreter field. To debug packaged apps, specify the path to Electron inside the built app (for example, on Mac that would be your_app.app/Contents/MacOS/Electron).
If you’d like to debug the render process, first start the app with the --remote-debugging-port= option. Then create a Chromium remote run/debug configuration, specify that port number and start the debugger. That’s it!
Start run and debug configurations while indexing
We’ve made it possible to start run/debug configurations while your project is still indexing. For example, you can now start a build task or run your Node.js app. Please note that there might be some limitations when you start the debugger while indexing is in progress.
And finally, check out some new features coming to WebStorm from IntelliJ Platform:
- support for right-to-left languages in the editor
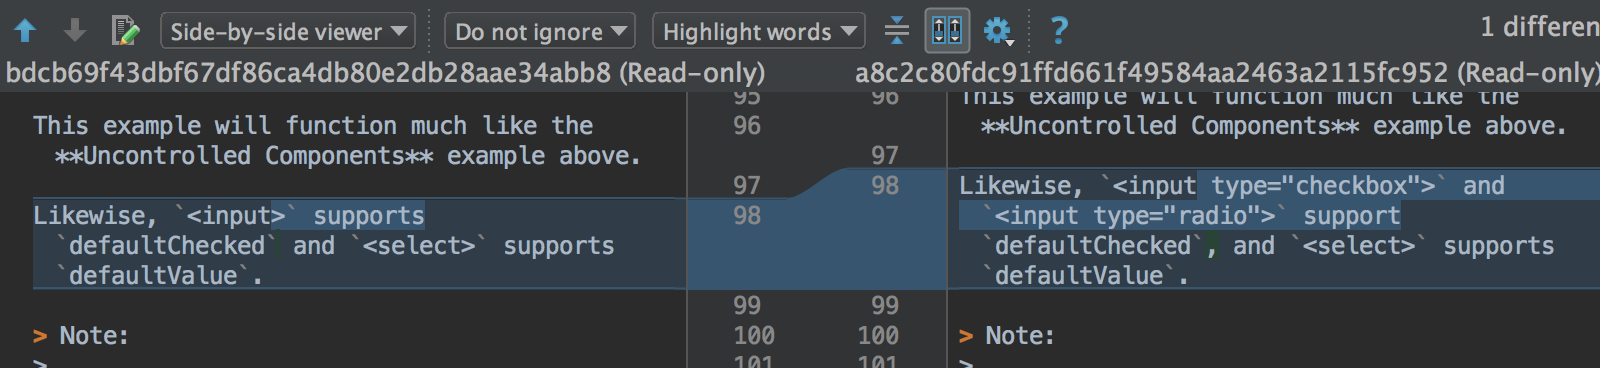
- by-word difference highlighting in all diff dialogs
- an option to compare revisions of a file between branches in Mercurial
The full list of issues addressed in this EAP build is available in the Release notes.
Please report your feedback to our issue tracker. To get notifications of new EAP builds as they become available, subscribe to the EAP channel in Preferences | Appearance & Behavior | System Settings | Updates.
– JetBrains WebStorm Team