WebStorm 2018.1 EAP, 181.3986: create new projects with Vue CLI
The new WebStorm 2018.1 Early Preview build (181.3986.8) is now available!
You can update via Toolbox App, or download the build here and install it beside your stable WebStorm version.
To learn more about all the new features added in earlier WebStorm 2018.1 EAP builds, please check out these blog posts.
Create new project using Vue CLI in WebStorm
Now you can use Vue CLI to create new Vue projects right from WebStorm’s Welcome screen.
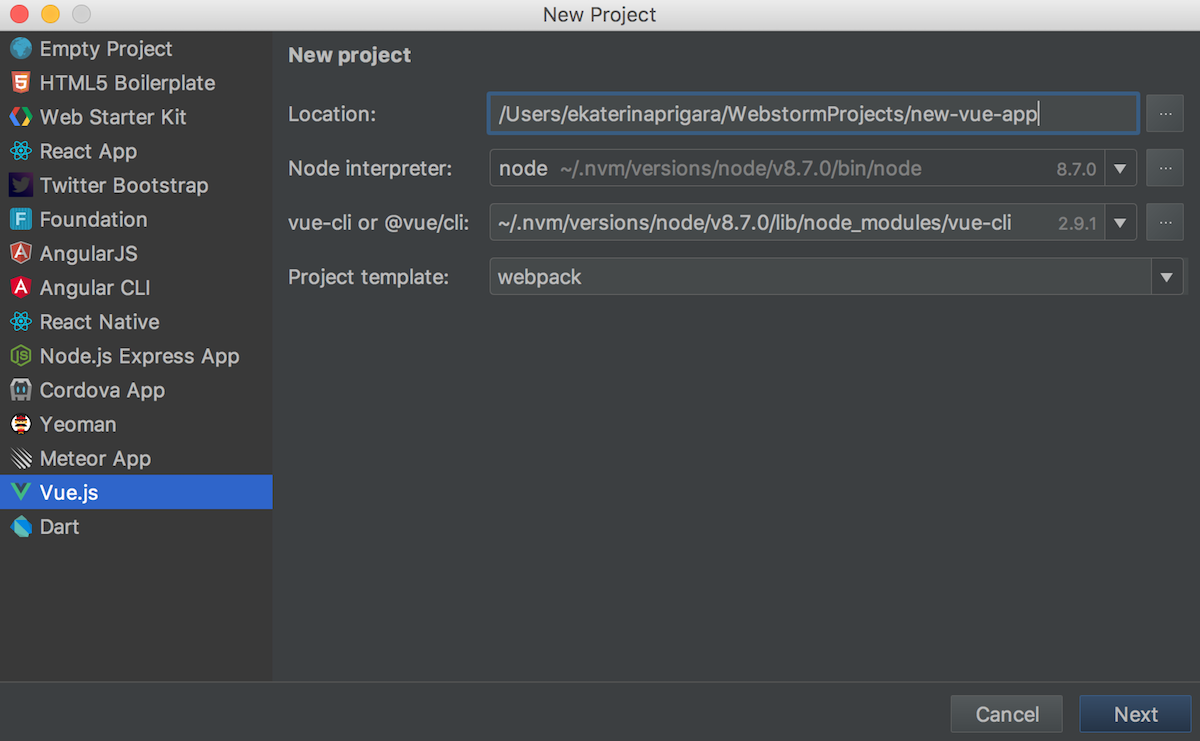
vue-cli is an official tool for scaffolding Vue apps. You’ll need to install it first by running npm install --g vue-cli
in the terminal. WebStorm will then use this package to create a new project.
With Vue CLI version 2, you can select one of 6 default project templates and then answer additional questions about tools like linters and test runner that can be added to the project.
Alternatively, you can use Vue CLI version 3 which is currently in beta.
Process and Debugger consoles in the Node.js debugger
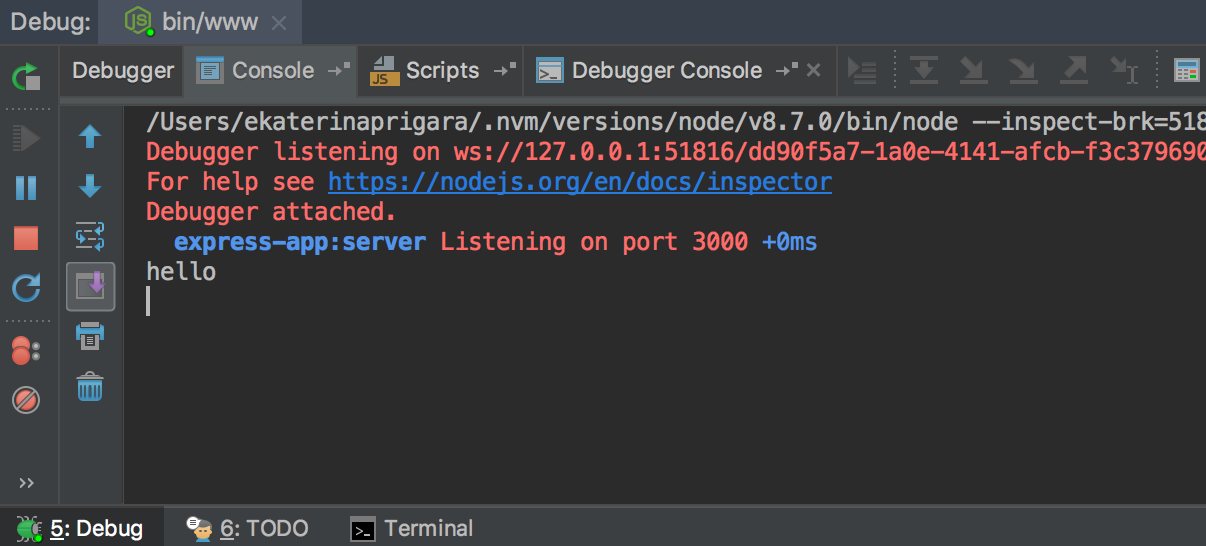
When debugging a Node.js application in WebStorm, you can now see two console tabs – the Console and the new Debugger Console.
The Console shows the output of the node process itself – everything written to the process.stdout and process.stderr directly or logged using console.*.
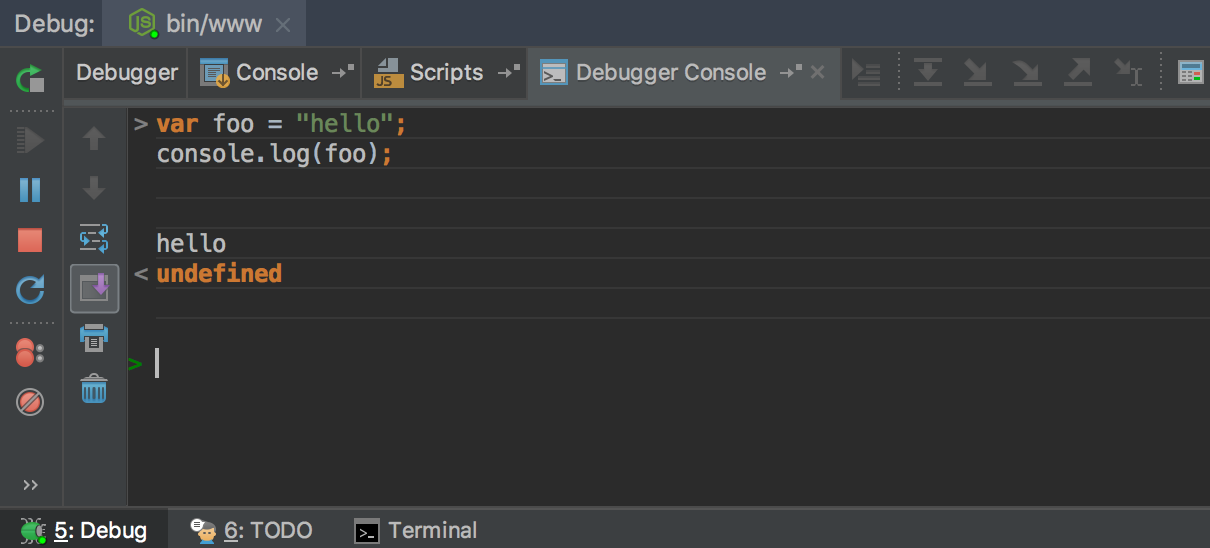
The new Debugger Console, on the other hand, lets you do more: execute JavaScript, see the console.log messages, jump to the location where console.log was called, and use other features of the console provided by the Inspector debug protocol.
Renaming default export
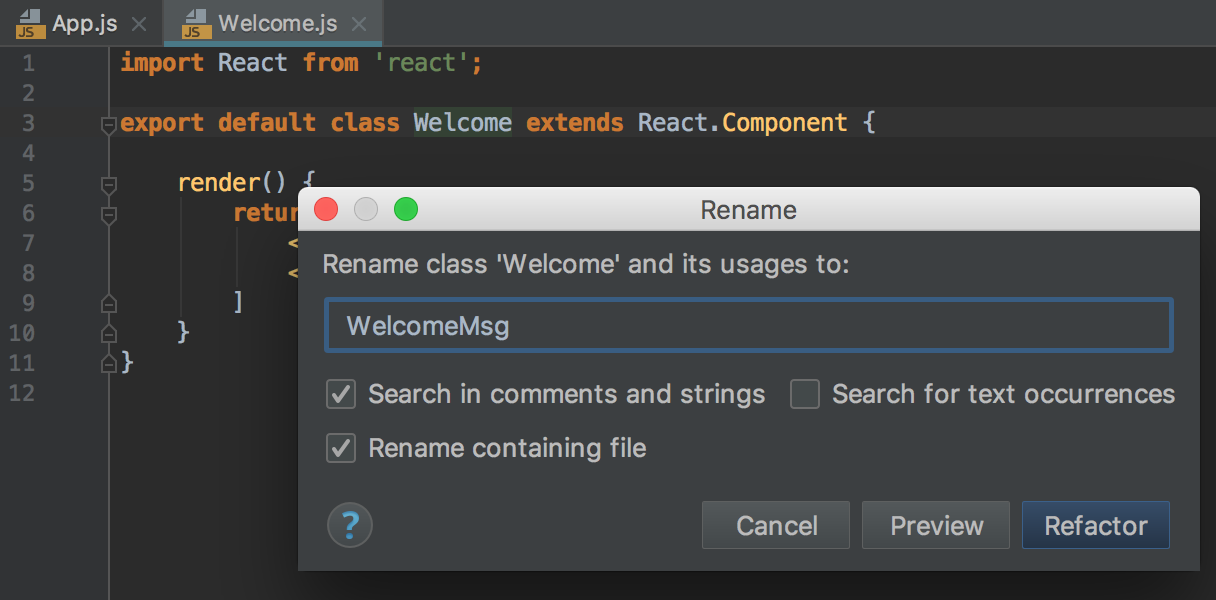
It’s a common pattern to use export default
for a class and then import it with the same name in another file. Now, when you rename this class, WebStorm will also rename its usages with the same name (even though the import will work properly even with the old name).
Among other improvements:
- Support for the overriding mapped type modifiers in TypeScript 2.8 (WEB-31364)
- Support for a number of ECMAScript proposals:
You can find a full list of issues fixed in the WebStorm project in the Release Notes.
Please share your feedback and report issues on our tracker. Thank you!
WebStorm Team
Jozef says:
March 2, 2018WebStorm debug mode doesn’t hit breakpoints.
Chrome@64
WebStorm@2017.3.4
vue/cli@3.0.0-beta.2
node@8.9.4
Thanks!
Ekaterina Prigara says:
March 2, 2018Could you please provide a bit more information on your debug configuration and where the breakpoints are. You can contact our tech support or report an issue on our tracker. Thank you!
Jozef says:
March 2, 2018Hint: A project (debugging) created with old version of vue-cli v.2 works fine.
1. Create new project by vue/cli v.3
– vue create my-project
– Manualy select features [Router, Vuex, CSS Pre-processors, Unit Testing]
– Pick a CSS pre-processor [SCSS/SASS]
– Pick a unit testing solution [Mocha + Chai]
– Prefer placing config [In dedicated config files]
2. Open project
– npm install
3. Add new Run/Debug configuration
– Javascript Debug [http://localhost:8080/, Chrome]
4. npm run serve
5. Add breakpoint & click Debug
– In template: Click Me!
– export default {
methods:{
doit(){
console.log(‘go go go’); //STOP !?
}
}
}
Ekaterina Prigara says:
March 2, 2018Have you tried debugging the app in Chrome’s DevTools? For me that doesn’t work either. That means that the problem might be related to the webpack configuration used in the project. Will investigate further.
Jozef says:
March 2, 2018Screenshot:
https://1drv.ms/u/s!Ah_rZjjiAy3f-T5JTgbGiagTFmC_
Ekaterina Prigara says:
March 2, 2018Can you please try the following: press Ctrl-Shift-A and search fore Registry…, find and enable the option called `js.debugger.break.on.first.statement.with.regexp` and restart the IDE.
Jozef says:
March 2, 2018‘js.debugger.break.on.first.statement.with.regexp’ not found.
Screenshot:
https://1drv.ms/u/s!Ah_rZjjiAy3f-T9Dd1J5nImIfXK_
Ekaterina Prigara says:
March 2, 2018Sorry, it’s only available in WebStorm 2018.1 EAP and I assumed that you’re using it because of the blog post.
Jozef says:
March 2, 2018Sorry, btw in WebStorm 2018.1 EAP it works?
Ekaterina Prigara says:
March 2, 2018Debugging works with this registry option in WebStorm 2018.1 EAP.
Ekaterina Prigara says:
March 2, 2018Thanks! Reproduced. Wasn’t working if the doit method contained only a single line with the console.log.
Joseph Tam says:
June 29, 2018is there a step-by-step to get debug working for a vue.js project using typescript?
Ekaterina Prigara says:
June 29, 2018No, sorry, we don’t have a specific guide for that. You need to make sure that source maps are generated for your app. As long as they are available, debugger should just work as described here: https://www.jetbrains.com/help/webstorm/debugging-javascript-in-chrome.html#debugging_js_on_external_web_server
Jerome Villiseck says:
February 11, 2019Warning : if you have vue-cli not found (node_modules vue-cli not found)
specify this directory in vue-cli field :
C:\Users\[your_username]\AppData\Roaming\npm\node_modules