WebStorm 2018.2: Extract React component, integration with ‘ng add’, Node.js on WSL, and more

🎉 Today we’re announcing WebStorm 2018.2! 🎉
WebStorm 2018.2 brings a lot of new powerful features and improvements, including the Extract React component refactoring, new integrations with Angular CLI, better testing workflow and Node.js debugging experience.
Explore the top new features and download WebStorm 2018.2 on our website.
We’ve been running the Early Access Preview program for WebStorm 2018.2 for the past two months. We published WebStorm EAP builds on a weekly basis, covering all the new features on this blog. Now we want to share with you the detailed release notes for the WebStorm 2018.2 update as compiled from these EAP blog posts.
Here are the features and improvements grouped by the WebStorm subsystems:
- Development with React: Extract React Component refactoring, convert class components into functional components, and code snippets.
- Development with Angular: faster project startup, add new features using the integration with ng add, and run schematics from the IDE.
- Development with Vue.js: completion for Vue events and event modifiers.
- Node.js development: support for Node.js on Windows Subsystem for Linux, an ability to automatically reconnect the debugger to the running node process, and remote mappings in Attach to Node.js configuration.
- Built-in tools: find unused code in the client-side app with Code Coverage reports, global File Watchers.
- Editor: new UI for inspection tooltip.
- JavaScript and TypeScript support: custom templates for postfix completion, and TypeScript 2.9 and 3.0 supported.
- JSON support: JSON5, and Iimproved support for JSON Schemas.
- Linters integrations: different highlighting for TSLint errors and warnings, and an ability to automatically apply code style rules from all types of ESLint and TSLint configuration files.
- Debugging: breakpoint intentions, Drop Frame action, and debugging JavaScript scratch files.
- Testing: rerun failed tests, navigate to Jest snapshot, compare Jest snapshots, and debugging Karma tests using Chrome Headless.
- Version Control: Browse Repository at Revision action, completion for tags, register roots automatically.
- Other IDE improvements: Touch Bar support.
Development with React
Extract React component
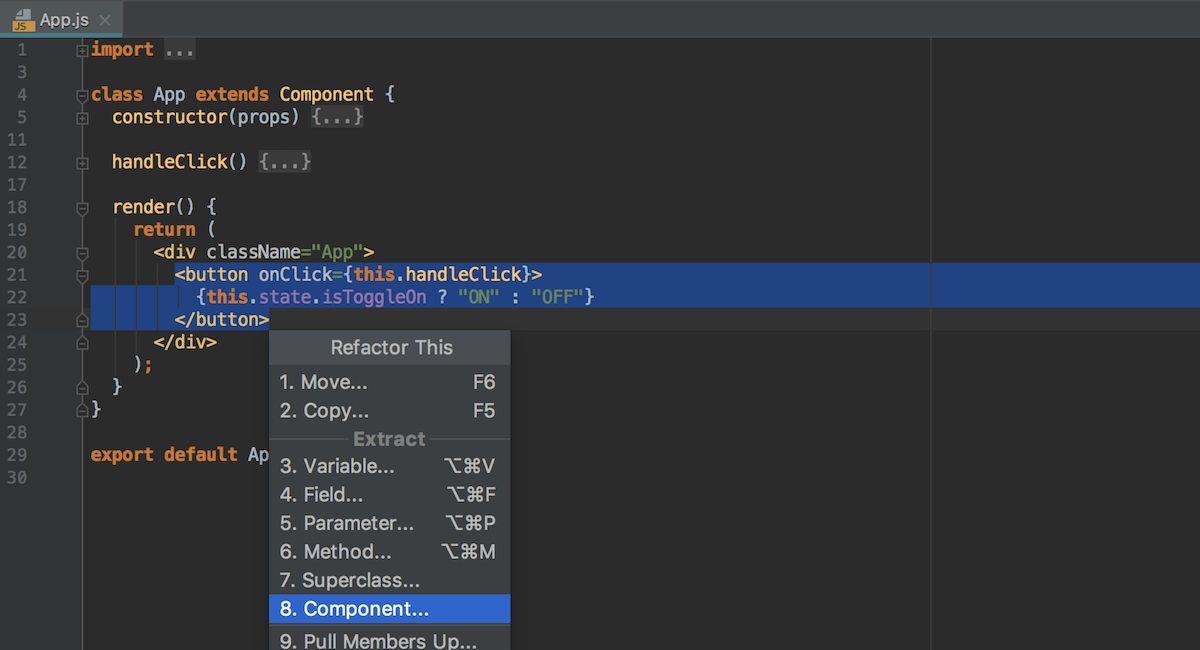
We’re very excited about this feature! WebStorm can now help you create a new React component, by extracting the JSX code from the render method of an existing one.
Select the code you want to extract, and then select Component… from the Refactor this… popup (Ctrl-T on macOS or Ctrl-Alt-Shift-T on Windows and Linux). Name the component and select whether it should be a class component or a functional component.
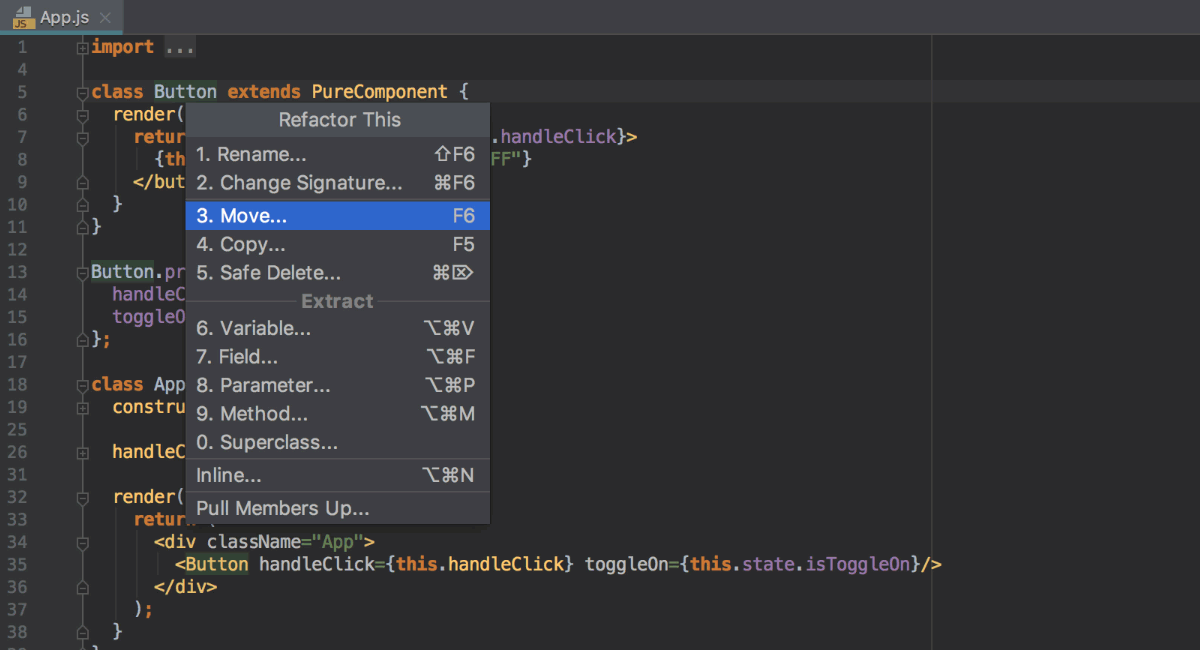
That’s it! Now your new component is defined next to the existing one and used in it.
You can then use the Move refactoring to move the new component and all the required imports to a separate file. (Do let us know if you’d like this option to be available right on the Extract Component refactoring dialog.)
In this Gist you can see the code before and after the refactoring.
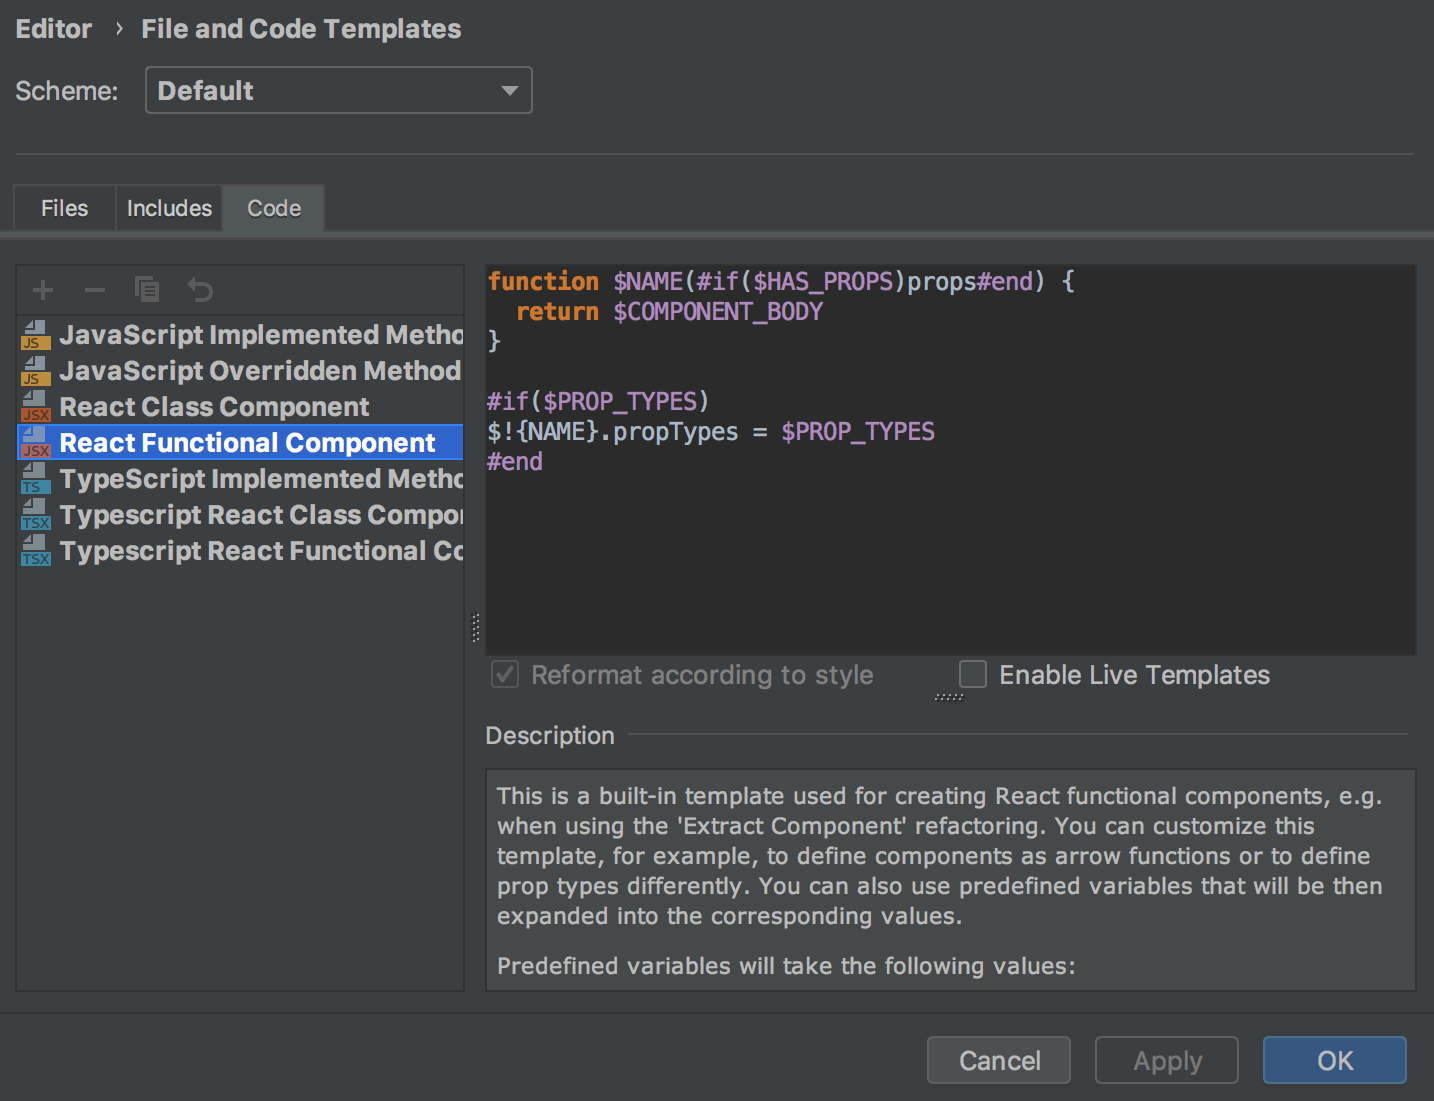
You can modify the code templates WebStorm uses for the new components, by going to Preferences | Editor | File and Code Templates and selecting the Code tab. For example, you can switch from using Component to using React.Component or PureComponent when creating a class component. Or, change the template for functional components to using arrow function. You can also change the style of using PropTypes or remove them altogether.
Convert React class components into functional components
With the new intentions, you can now convert React class components into functional components and back again – press Alt-Enter on the component definition and select the action you need.

React code snippets
WebStorm now has a collection of code snippets for React. It has over 50 abbreviations that expand into different statements and blocks of code often used in React apps. The collection was adapted from the popular plugin for VS Code.
Type the abbreviation in the editor and then press Tab to expand it. Or press Cmd/Ctrl-J (Insert Live Template) and select the snippet from the list. All abbreviations are also available in the completion popup.
Here we use the abbreviation rcjc to create a class that defines a new React component:

You can find the full list of available templates in Preferences | Editor | Live Templates – React.
For the JSX tags, you can now also see the breadcrumbs and colorful highlighting for the tag tree on the editor gutter.

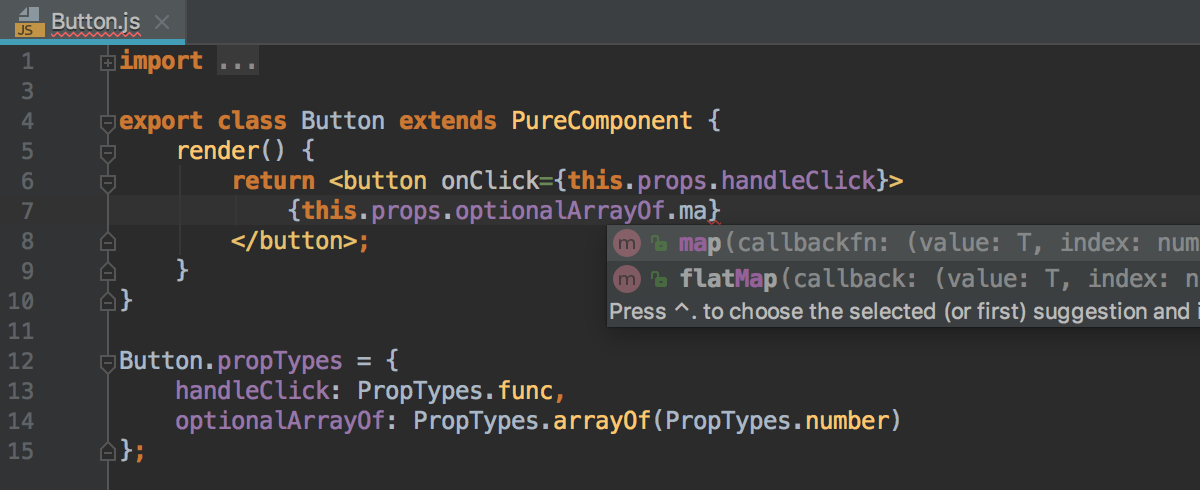
Better support for PropTypes
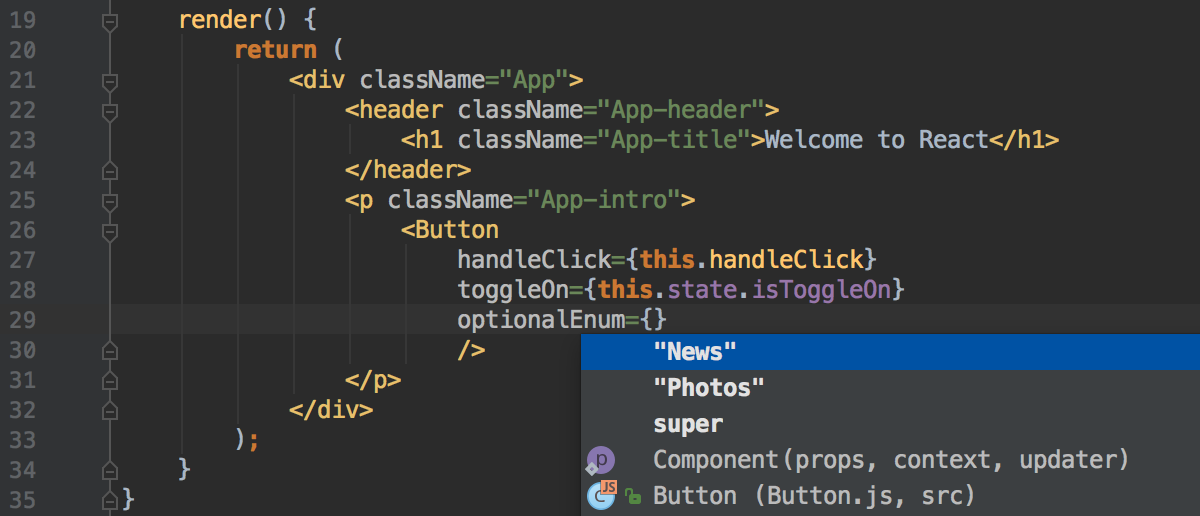
Code completion is now more precise when you use PropTypes like shape, oneOf, instanceOf, or arrayOf. Here are a couple of examples. Here in the completion we have the values listed using PropTypes.oneOf:
And here we have completion for array methods because PropTypes.arrayOf is used:
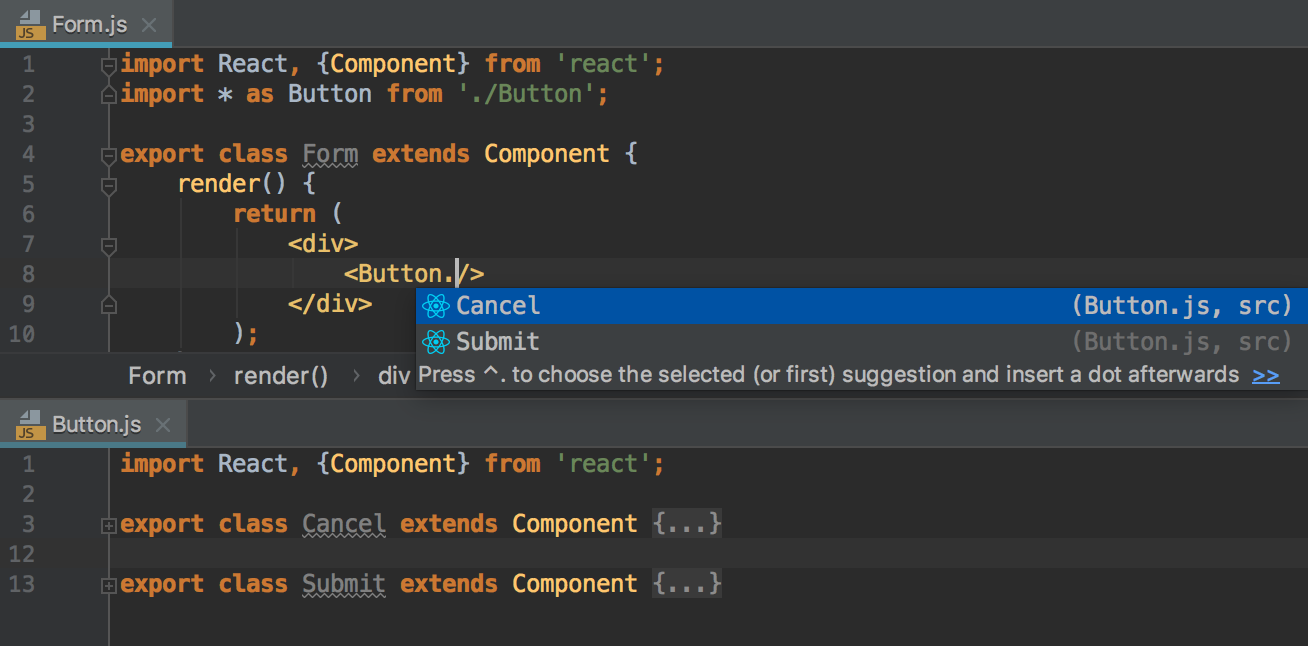
Support for React namespaced components
WebStorm now has better support for React components that have a namespace in their name. You can now get appropriate code completion and navigation to the definition for these components in JavaScript and TypeScript files.
Development with Angular
Faster project startup
Previously, when you opened your Angular project for the first time, WebStorm would spend significant time indexing the compiled JavaScript files shipped with the Angular core modules.
We’ve decided to update the way WebStorm handles the core Angular module and modules written in TypeScript in general. Now, if the module’s package.json has a typings field with the path to the *.d.ts file, then WebStorm indexes only the TypeScript files and ignores all the JavaScript files.
As a result, we’ve halved the time WebStorm needs to index a new Angular project, with no compromises affecting the quality of code completion and resolve (which also work faster now, too!).
Run more Angular schematics using the Angular CLI integration
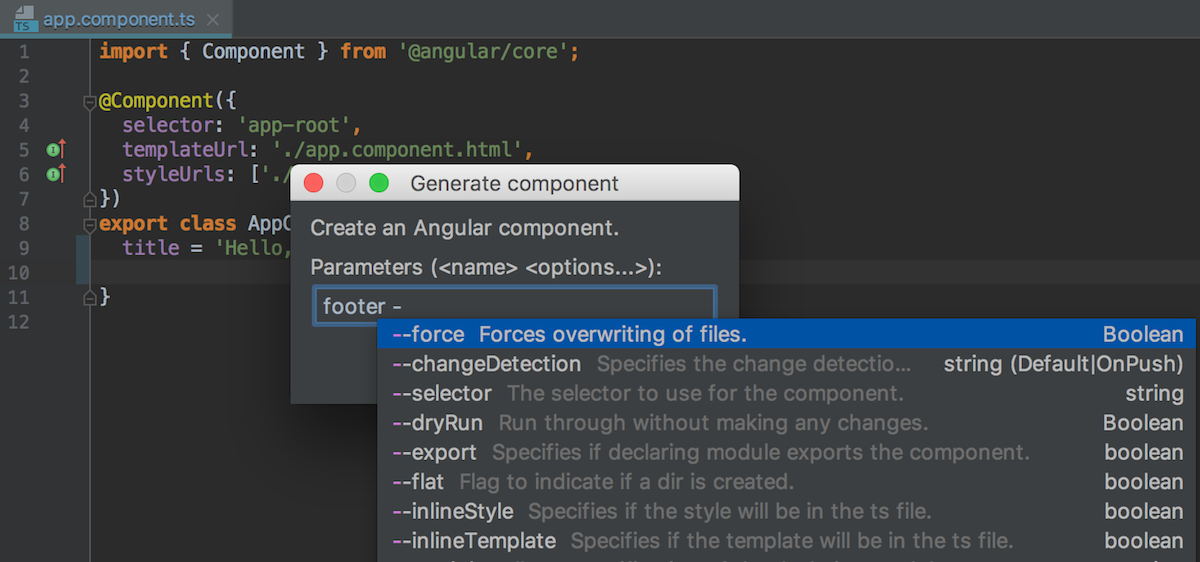
With the New… – Angular Schematic… action in the Project view, you can now generate code using schematics that are defined in libraries like @angular/material (note that you need to use Angular 6 for this). Previously, you could only generate components, services, and other blueprints defined in the Angular CLI itself.
In addition, WebStorm now shows the schematic’s description and provides code completion and description for available options.
Adding new features to an Angular app with ng add
Another new feature introduced by the Angular and Angular CLI 6 update in the new ng add command to help add new capabilities to your app. It will install the selected dependency and then invoke the installation script to take care of all the rest.
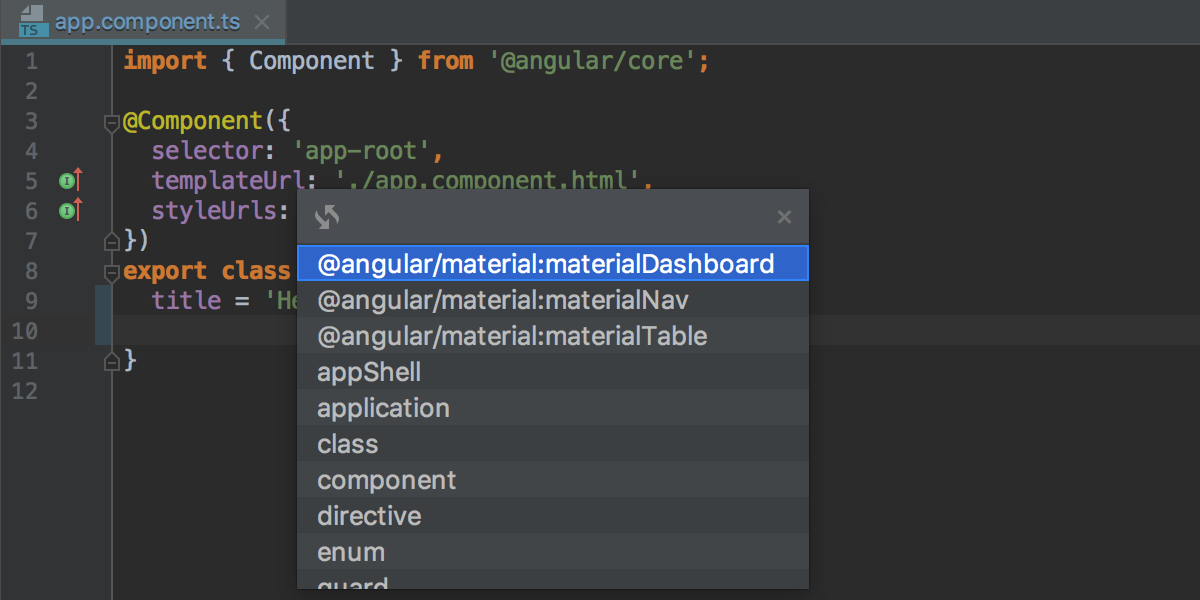
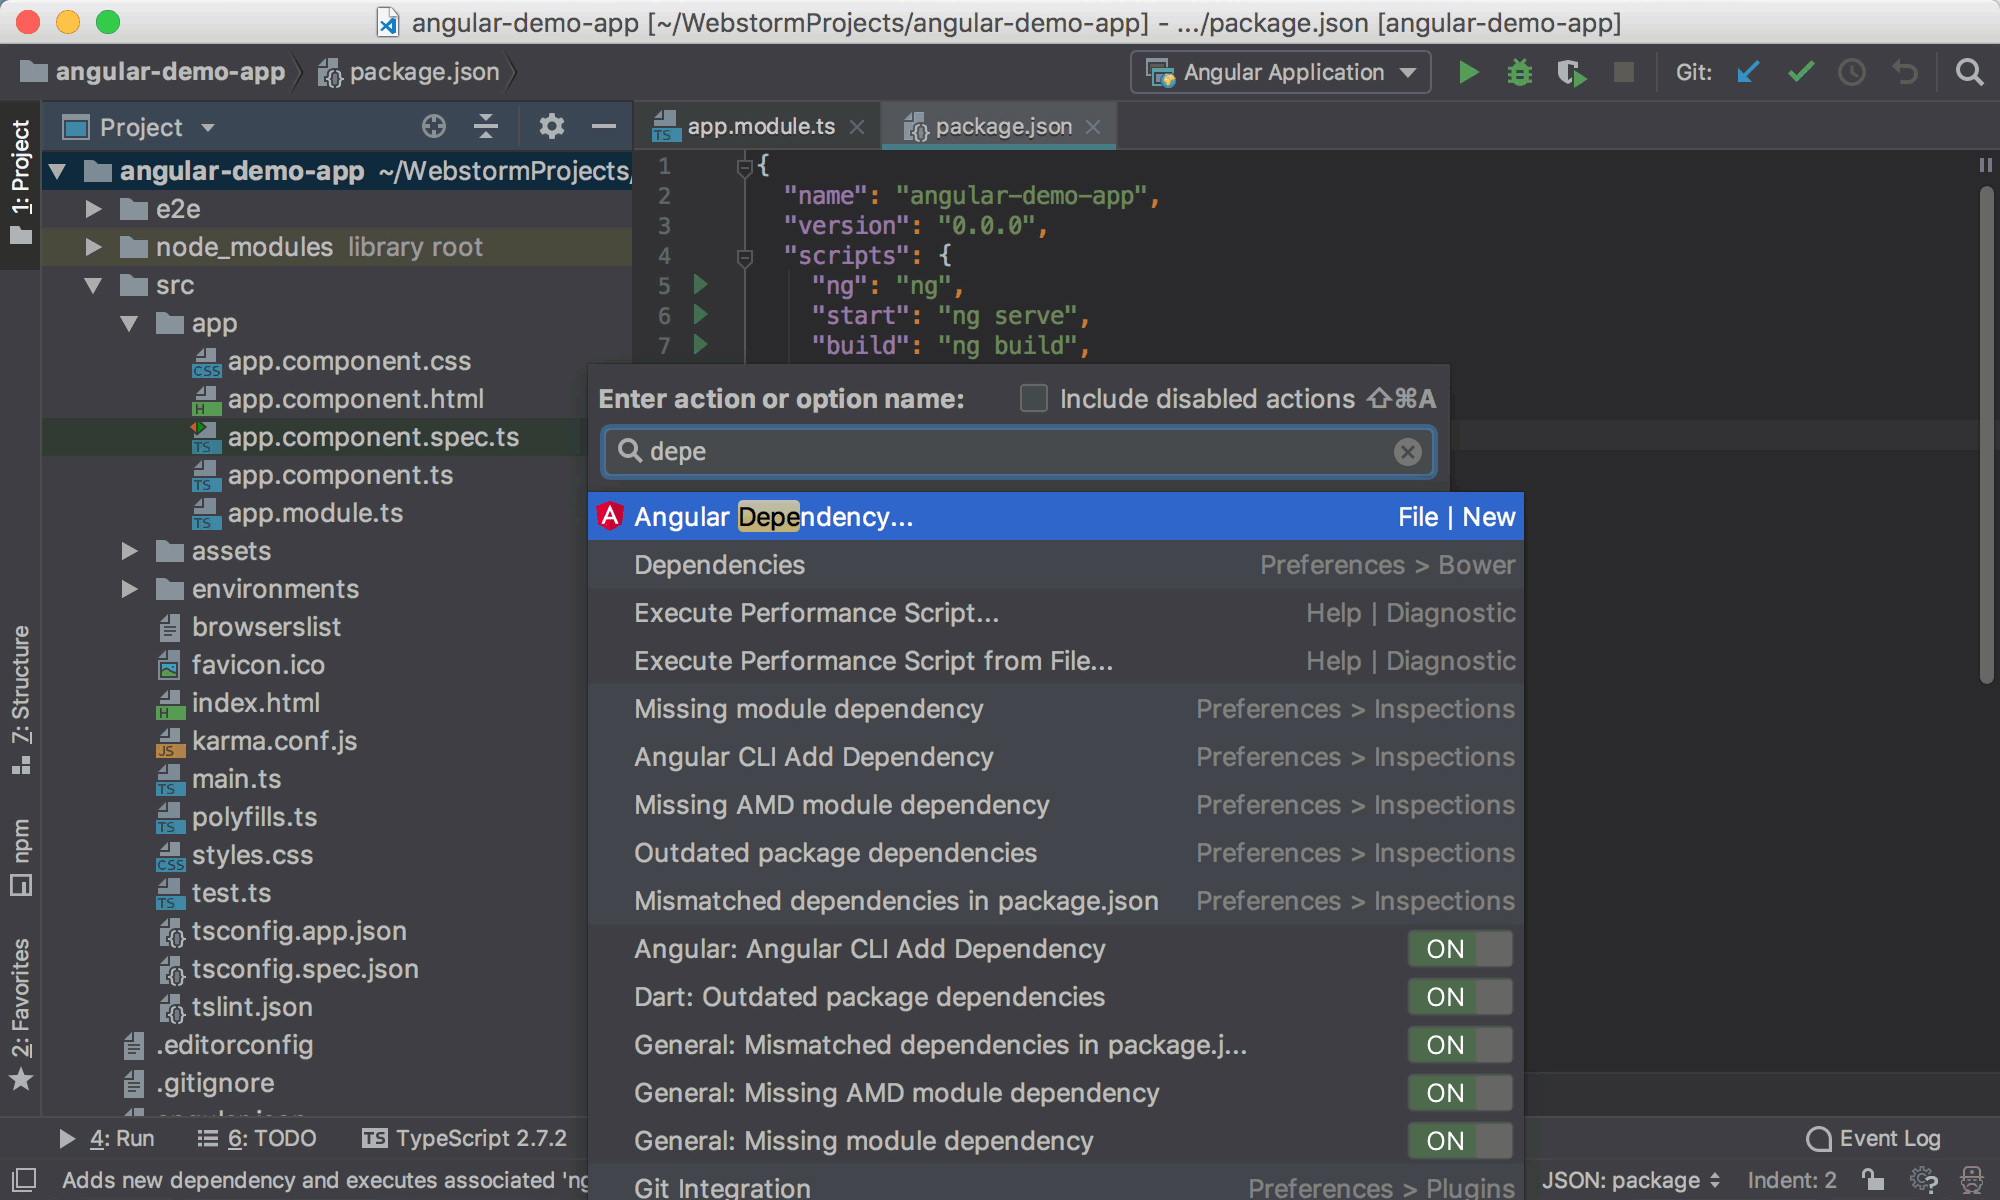
In WebStorm, you can now use the new Angular Dependency… action to install libraries that support installation with ng add without using the terminal. This action is available via the Find Action (Cmd-Shift-A/Ctrl+Shift+A) popup or the New… popup (Cmd-N/Alt+Insert) in the Project view.
In the list you can select the library you want to add. Right now it contains only the libraries that we know have ng add support, but you can also specify any package name you want. By the way, the list is available on GitHub and you can send us Pull Requests to add more libraries.
In this example, we are adding Angular Material to our project:
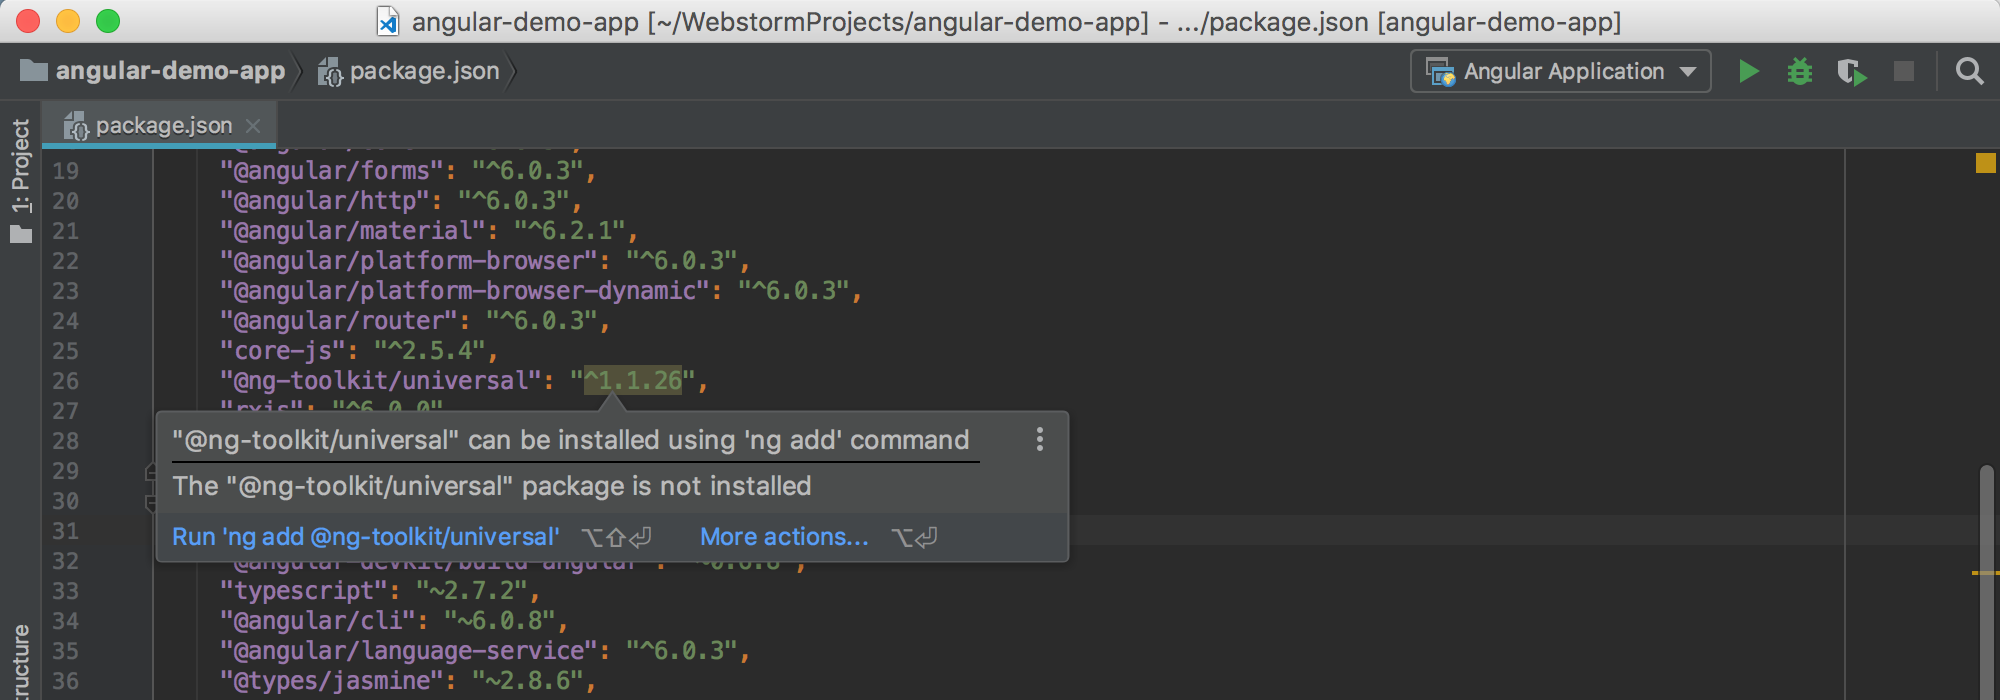
If you add a dependency to package.json that WebStorm knows supports ng add, the IDE will suggest installing it with ng add:
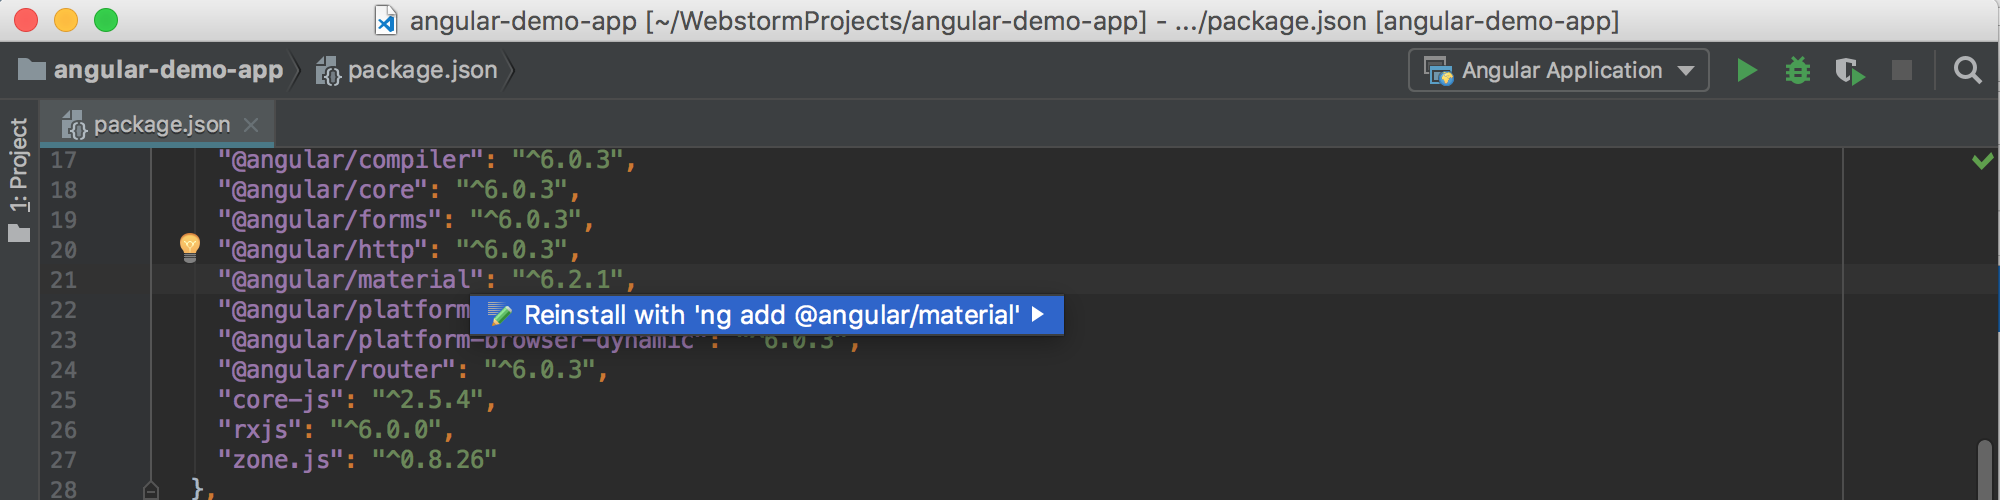
And even if a dependency is already installed, it can still make sense to reinstall it with ng add. To do so, press Alt-Enter on the package name in package.json and select Reinstall with `ng add`:
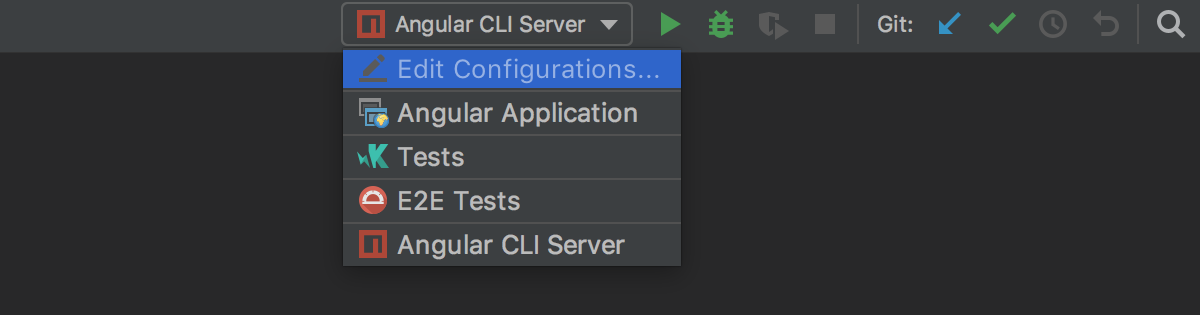
Run configurations for new Angular projects
If you create a new Angular project using Angular CLI in the IDE, WebStorm now automatically adds run/debug configurations that will help you start and debug the app and run Karma and Protractor tests in the IDE.
Development with Vue.js
Completion for Vue events and event modifiers
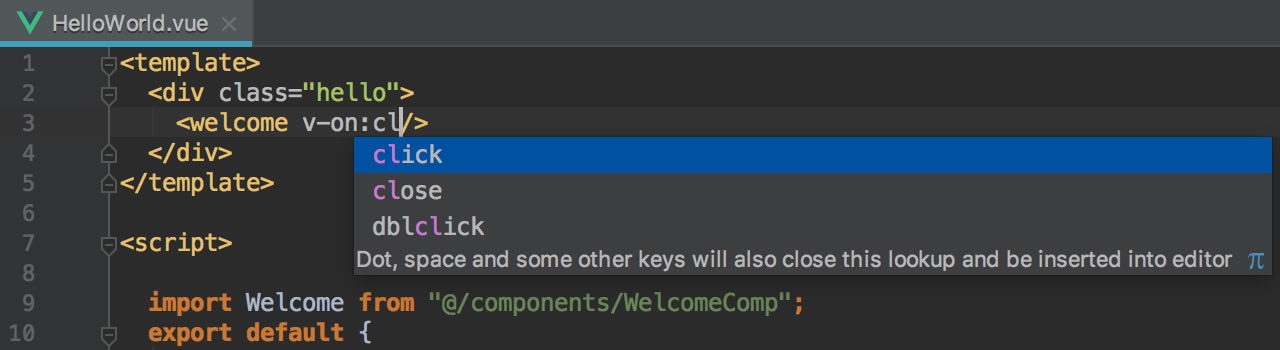
In Vue templates, WebStorm now provides code completion for events and event modifiers.
The list of events is available following `v-on:`:
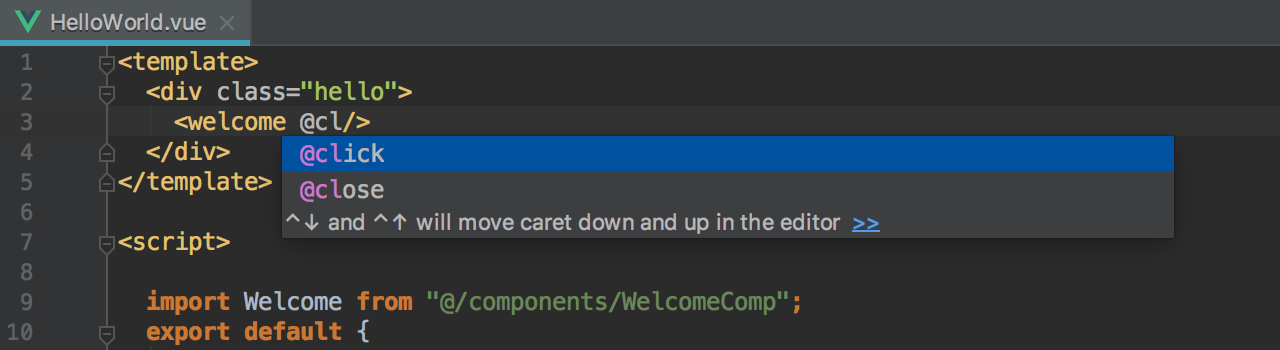
You can also use the shorthand notation, @event:
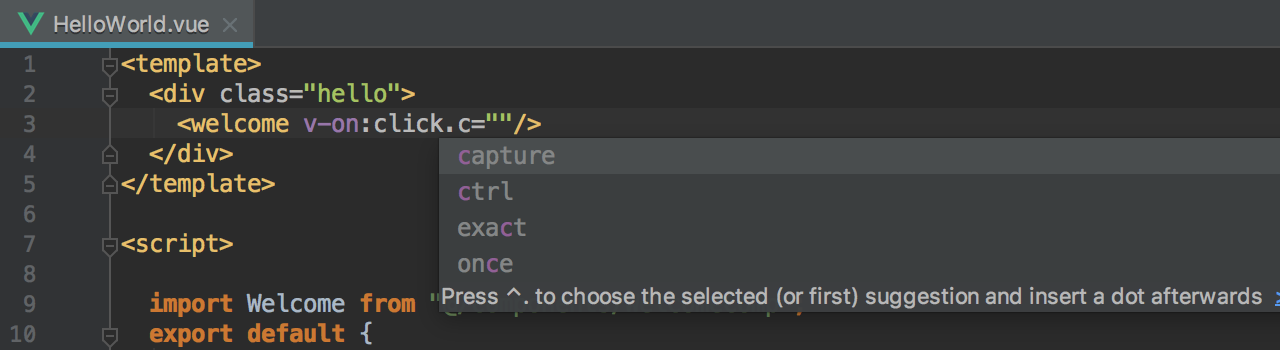
Event modifiers can also be automatically completed:
Node.js development
Support for Node.js on Windows Subsystem for Linux
If you’re using Node.js on WSL, we have some good news for you: you can now run and debug Node.js apps using Node.js on WSL right in WebStorm.
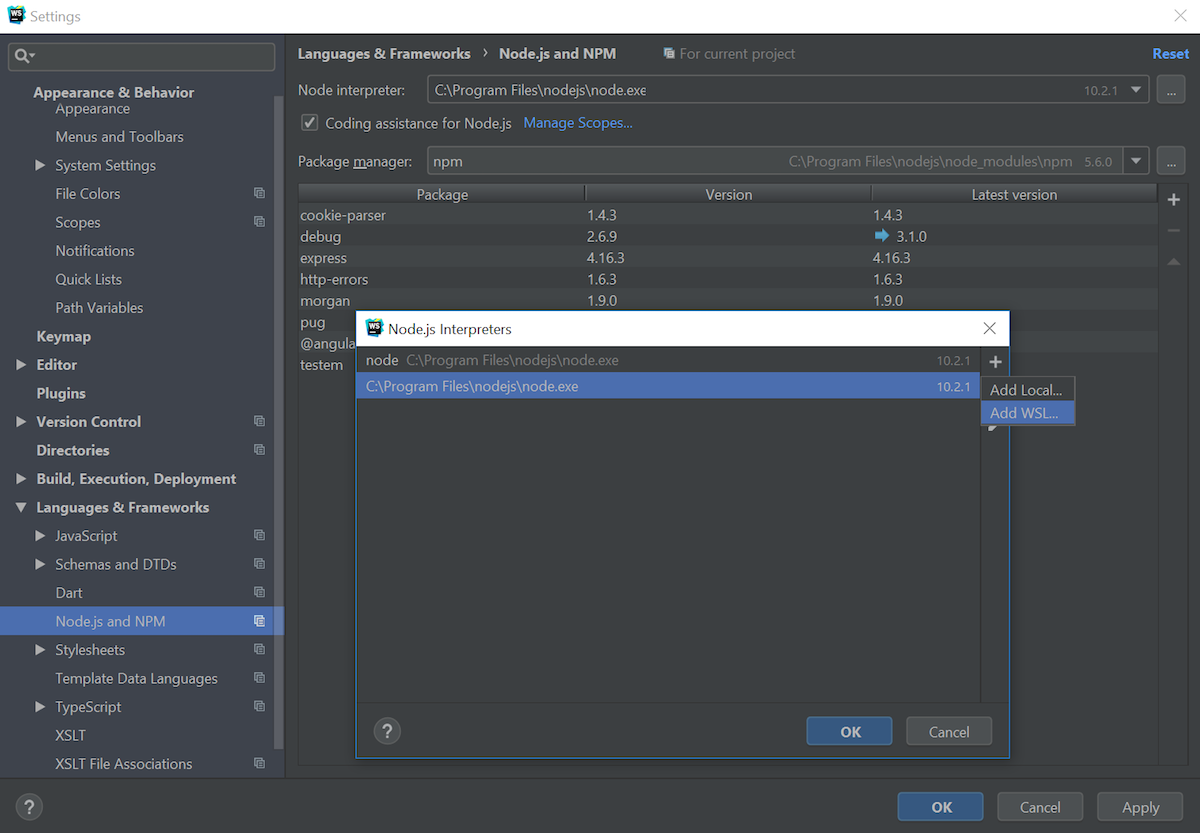
You can select Node.js on WSL as a project’s node version in Preferences | Languages & Frameworks | Node.js and npm or you can configure and use this node version in a Node.js Run/Debug configuration.
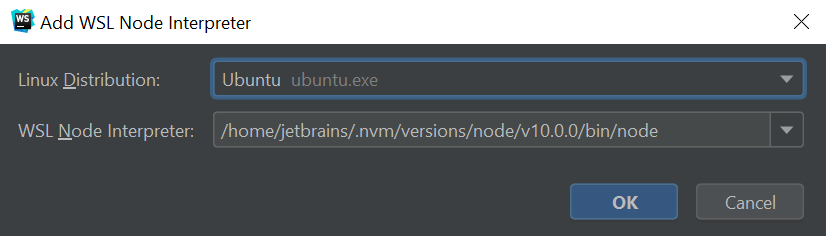
In Preferences | Languages & Frameworks | Node.js and npm, click … next to the field with the path to Node.js, then click + in the opened dialog and select Add Node.js on WSL.
Now select the Linux distribution you’re using from the drop-down menu and set the path to Node.js and click Save.
WebStorm will now use this Node.js version when running npm scripts or creating new Node.js run/debug configurations.
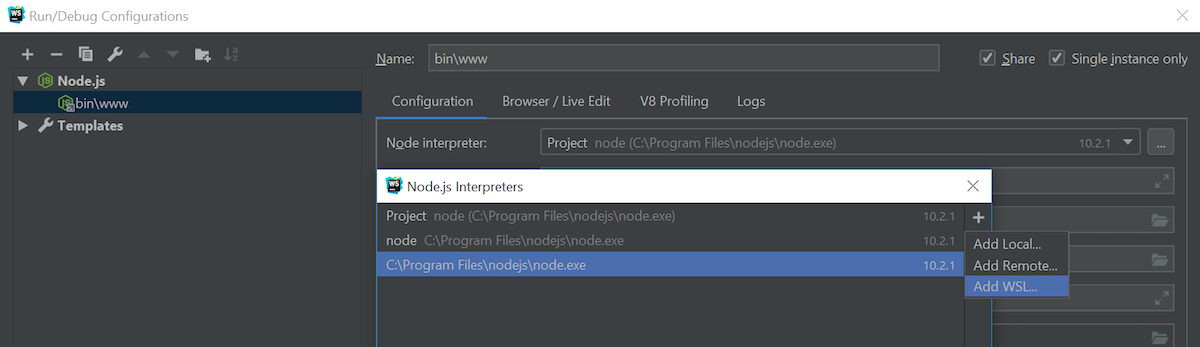
If you want to use Node.js on WSL only in some specific run/debug configuration, instead of changing the project’s node version in Preferences, you can add a new Node.js WSL interpreter in the Node.js configuration. Again, click on the … button next to the path and follow the steps described above.
This integration is still work in progress. We are now working on support for Node.js on WSL for test runners, linters, and build tools integrated in WebStorm. Stay tuned!
Reconnect the debugger to the running node process
We have added a new Reconnect automatically option to the Attach to Node.js/Chrome debug configuration.
Thanks to this option, it is now easier to debug Node.js apps that use nodemon. Nodemon is a utility that automatically reloads your node process when you change the code of your app.

Here’s how you can debug such an application:
- Start your app in the debug mode. To do this, pass an
--inspectflag to nodemon. You can create and run a newnpm debug scriptthat would look like this:debug": "nodemon --inspect ./app.js(be sure to replace ./app.js with the path to the file that starts your app). - Create a new Attach to a Node.js/Chrome configuration and select the Reconnect automatically check-box.
- Usually, you don’t need to change the port in the configuration (9229) because it’s the default port the debugger is listening on. But you can double-check what port is used in the message logged when you run the app in the debug mode.

- Now run the new configuration. The debugger will stop on the breakpoints that you’ve put in your code in the IDE.
- If you make any changes to the code and click Save, nodemon will automatically reload the app. The debugger will now be able to automatically re-attach to the restarted process.
Remote mappings in Attach to Node.js configuration
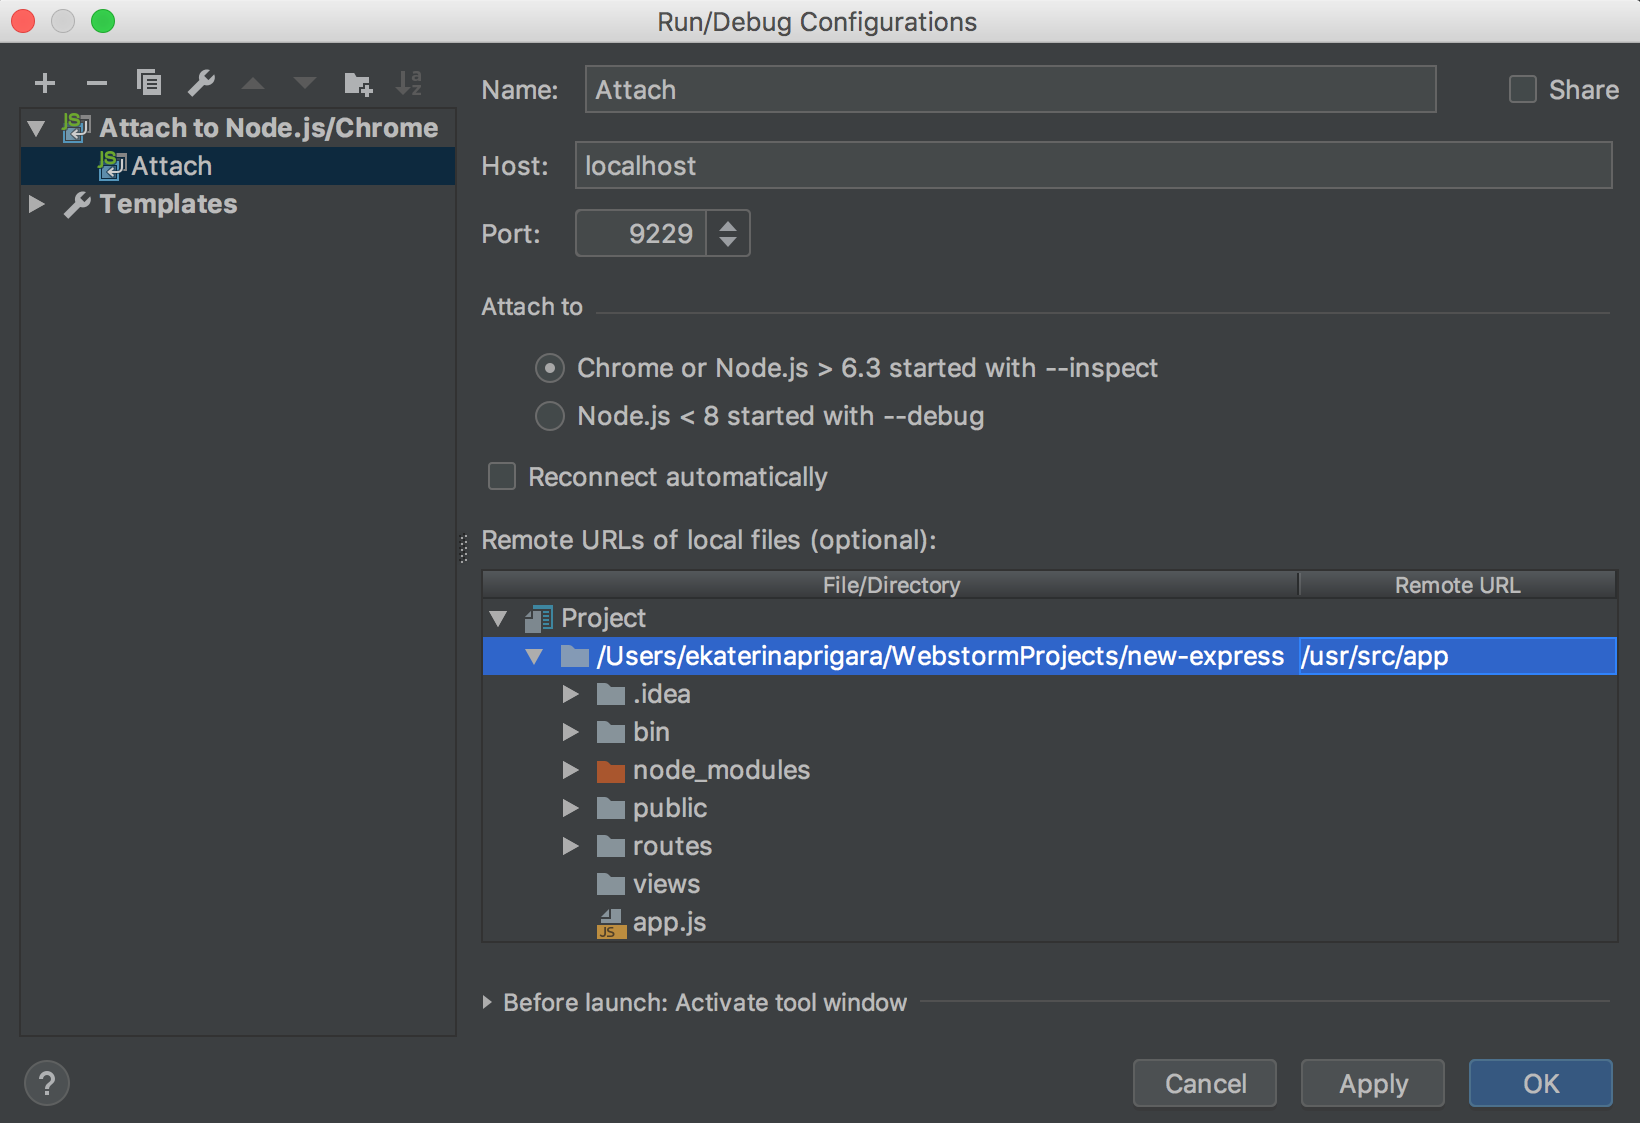
We have added another Node.js-related improvement in the Attach to Node.js configuration that you can use to attach WebStorm’s debugger to the running node application.
You can now specify the remote paths for the project folders. Which is useful if the app root folder on the remote server or the Docker container have a different name to the local root folder.
Manage logs when running a Node.js app
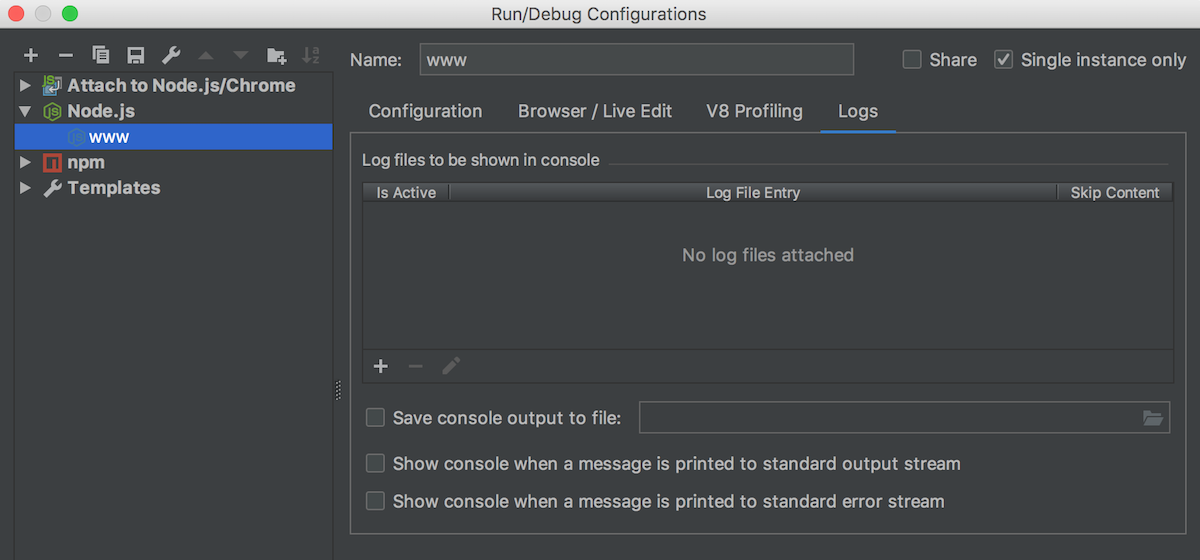
If you’re using a logging tool like morgan in your Node.js app, and the tool writes logs to a file, you can now see these logs on the Console tab in the Node.js Run tool window. To enable this, go to the new Logs tab in the Node.js run/debug configuration. While there, you can also enable saving the console output to a log file.
Built-in tools
Find unused code in the client-side app with Code Coverage reports
You can now find unused JavaScript (or TypeScript) as well as CSS code in your client-side app thanks to the new Code Coverage feature.
Run your app in the browser and then see the report in WebStorm showing how much code in every file and folder was used.
The great thing is that the coverage will be shown for your source files and not for the compiled code that was actually run in the browser (as long as the source maps are available).
Here’s how it works:
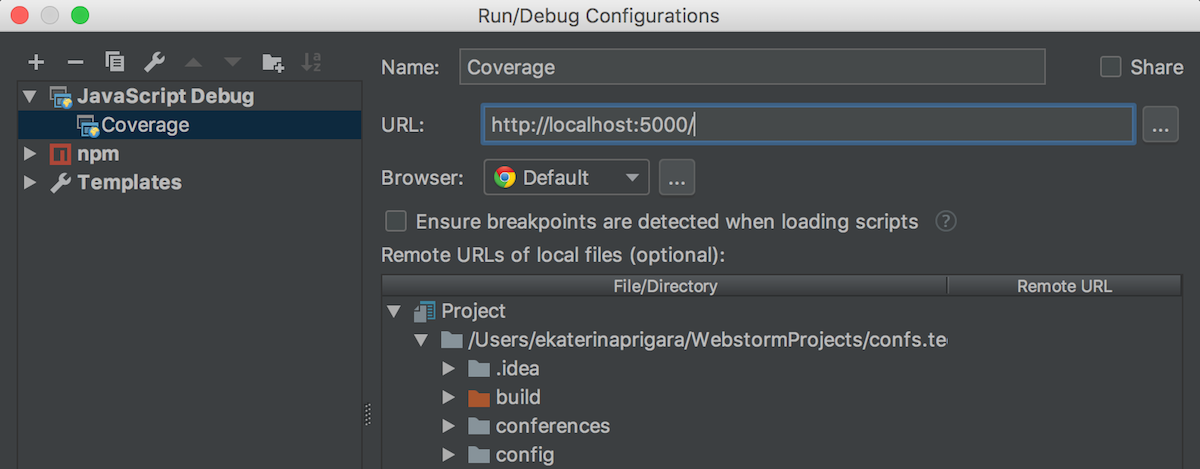
- Create a new JavaScript debug configuration by selecting Run – Edit configurations…
- Specify the URL your app is running on and save the configuration.
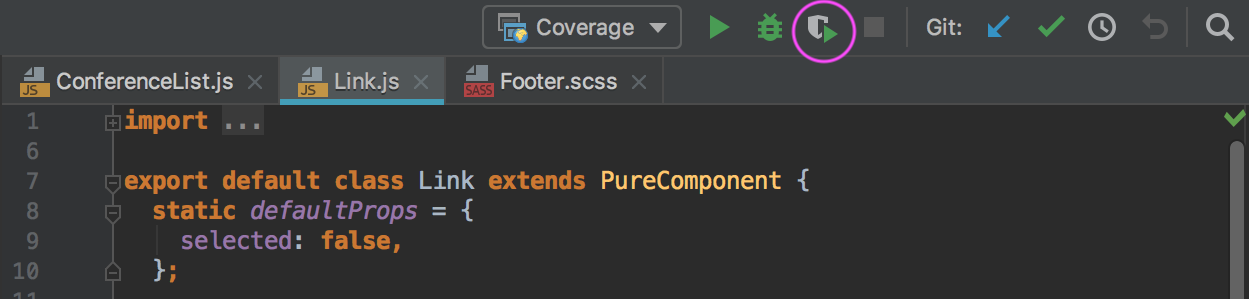
- Now click Run with Coverage.
- Once your app opens in Chrome, wait till the page is loaded if you want to know what code was executed during the page load, and then stop the configuration in the IDE. If you want to see the coverage report for some specific features of your app, use these features in the browser and then stop the configuration.
The coverage report will now open in the Coverage tool window: look at the Project view for info about the coverage of files and folders. Meanwhile, if you look at the left gutter in the editor, you will see green and red markers next to some lines. Green means that the line was executed, and red means it was not. And if you click on the market, you’ll see how many times this particular block of code was executed.
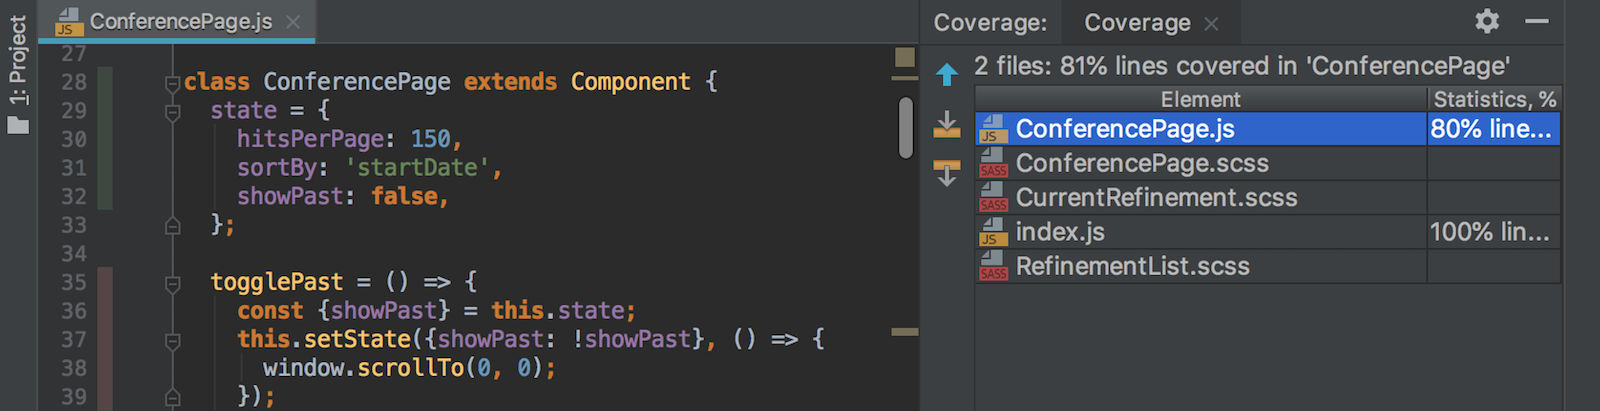
In the example above, we see that the togglePast method is marked with red because we haven’t clicked the link that shows the past events.
Global File Watchers
With File Watchers, you can run command-line tools like Prettier automatically when you change or save a file. Before, it was only possible to configure and use a file watcher in a specific project. If you wanted to use the same watcher in a different project, you had to repeat the whole configuration. But now you can create and store File Watchers on the IDE level, and easily enable them in different projects.
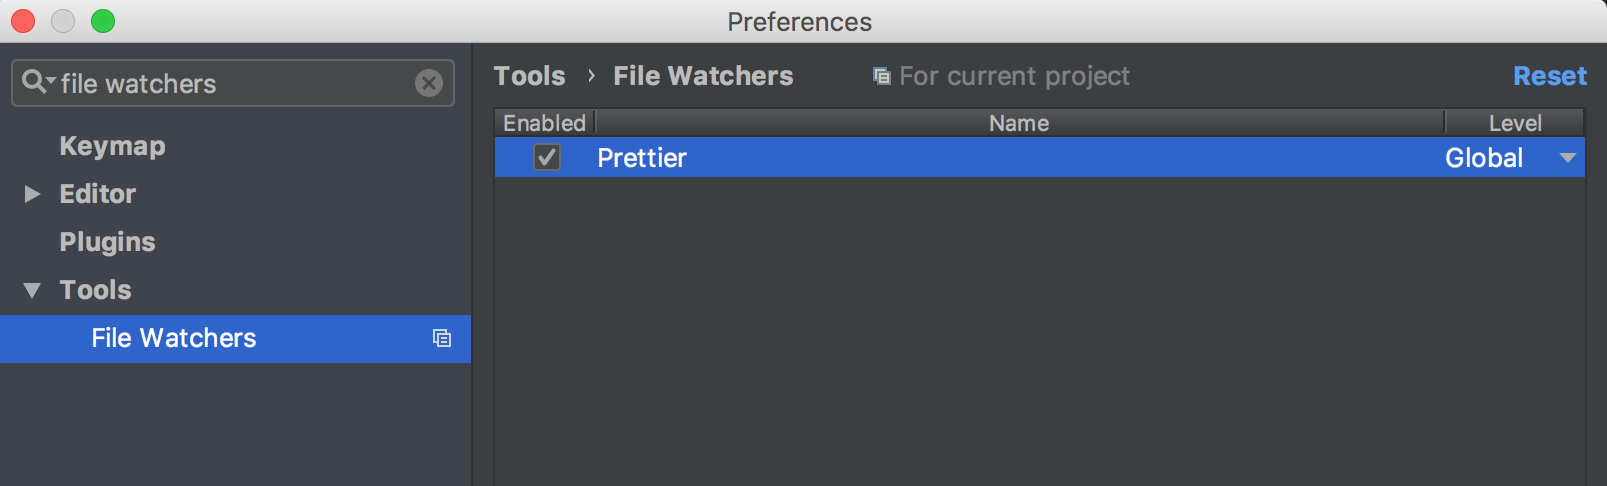
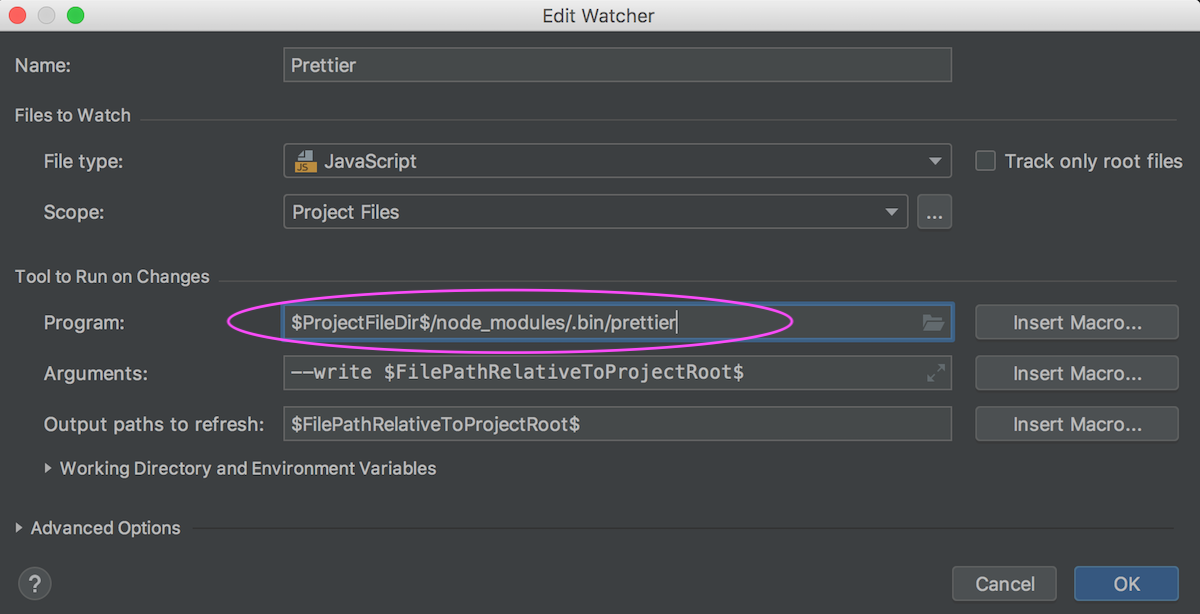
To create a global File Watcher, open the IDE Preferences (from the project or from the Welcome screen) and go to Tools | File Watchers, click the + button, and select Custom from the list. Now configure the File Watcher for the tool you want to use (for more information on how to do that, see our documentation).
Once you’ve saved the new File Watcher, you can decide if it’s going to be available only in the current project – select Project in the right column or for all projects – then select Global.
Note that the global File Watchers will be available in all projects, but disabled by default. If you want to use it, go to the project’s Preferences | Tools | File Watchers and select the check-box next to it.
Let’s create a new global File Watcher for Prettier following the steps described in the Prettier docs. What we want to change is the path to Prettier – for every project where we want to enable this File Watcher, we want to use Prettier installed in the project’s node_modules folder. To do that, we use a macro in the path: $ProjectFileDir$/node_modules/.bin/prettier.
Editor
New UI for inspection tooltip
Probably the most notable (and definitely the most visible) change in this week’s Early Preview build is the new inspection tooltip.
You see these tooltips when you hover over the warning or errors in the code. As you might know, for all the warnings WebStorm will offer quick fixes that you can see if you press Alt-Enter or click on the bulb icon.
And to make these quick fixes more discoverable, we now show the first available fix right next to the error description. You can then press Alt-Shift-Enter to apply the fix or Alt-Enter to see the usual pop up with all the available quick fixes and intentions.

JavaScript and TypeScript support
New intentions in JavaScript and TypeScript
We’ve added a bunch of new intentions that are available in the TypeScript and partially in JavaScript code. To use an intention, press Alt-Enter, select it in the list and press Enter.
Here’s what was added:
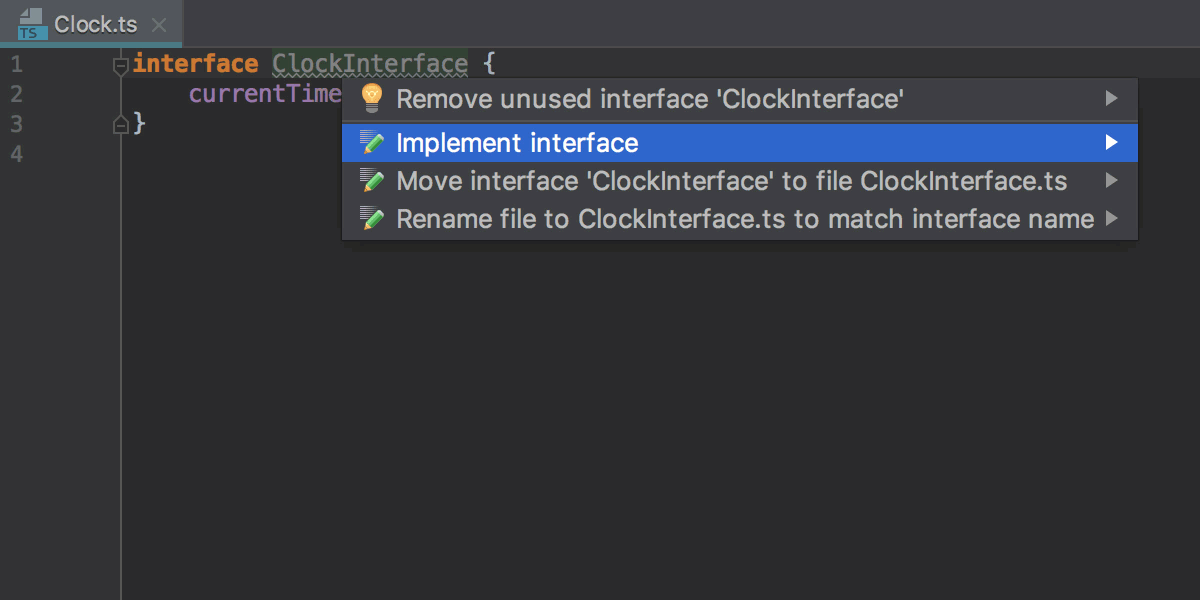
Implement interface and Create derived class
The Implement interface intention works for the TypeScript interfaces and creates a new class that implements this interface.
The Create derived class intention creates a new class in the JavaScript or TypeScript file that extends another class
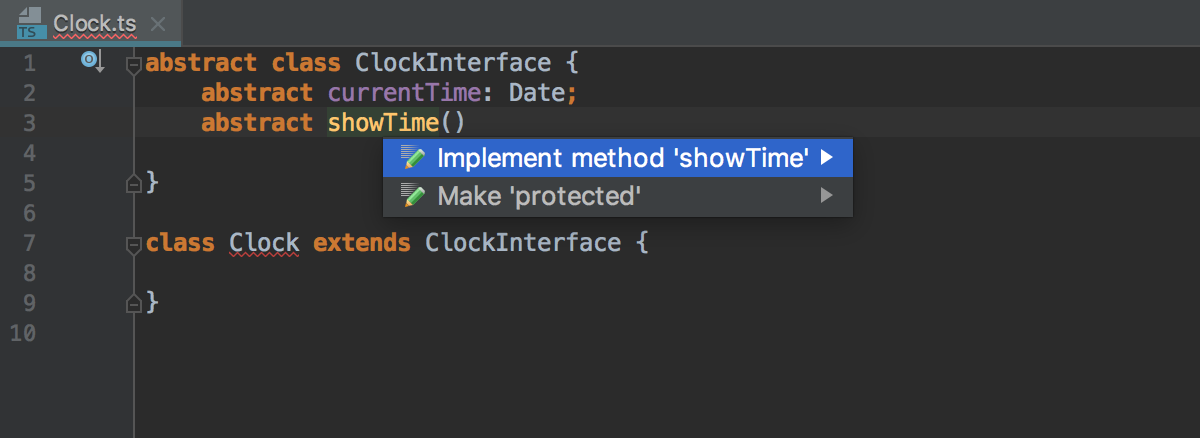
Implement interface or abstract class member
This TypeScript intention allows you to implement properties and members of an interface or an abstract class in classes that directly implement or extend them.
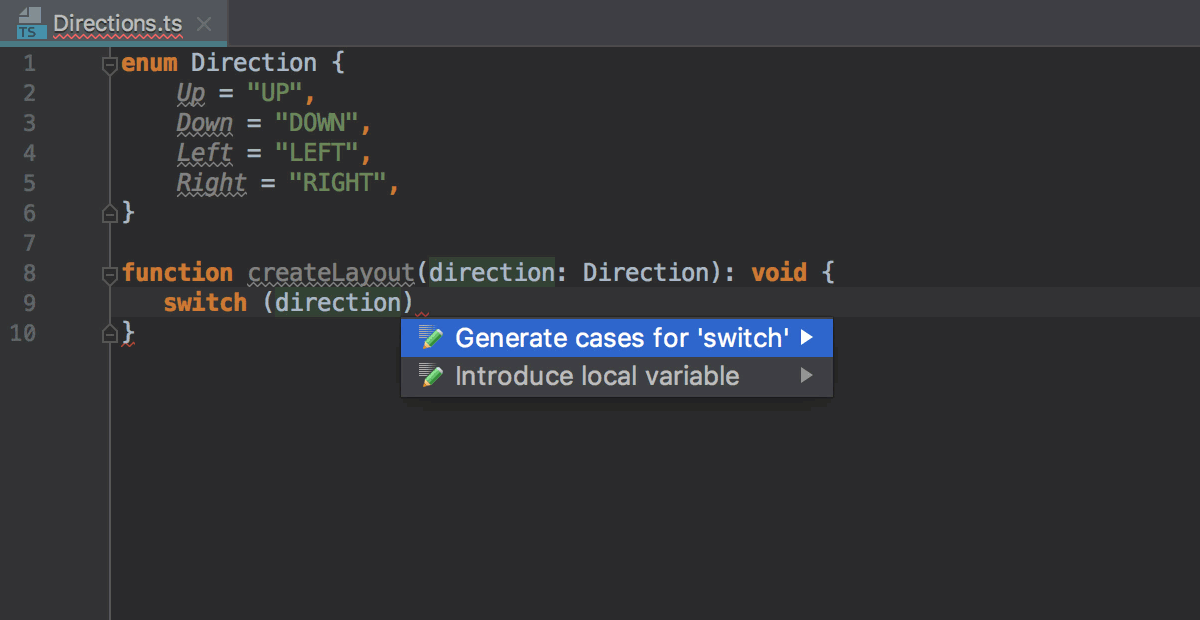
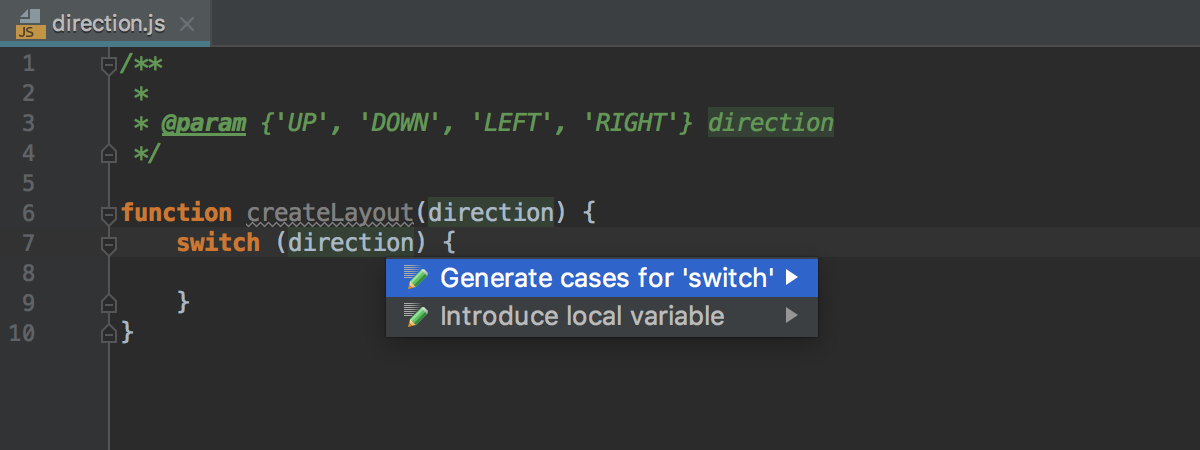
Generate cases for ‘switch’
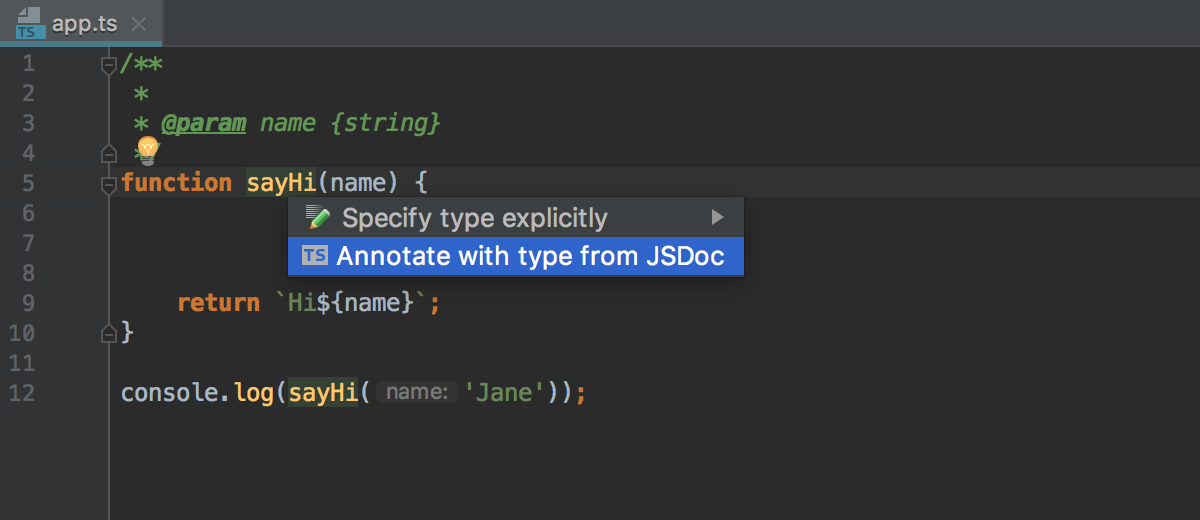
This intention helps to generate the switch block when a switch argument is an enum.
In JavaScript this intention can use the information from an argument provided in the JSDoc comment:
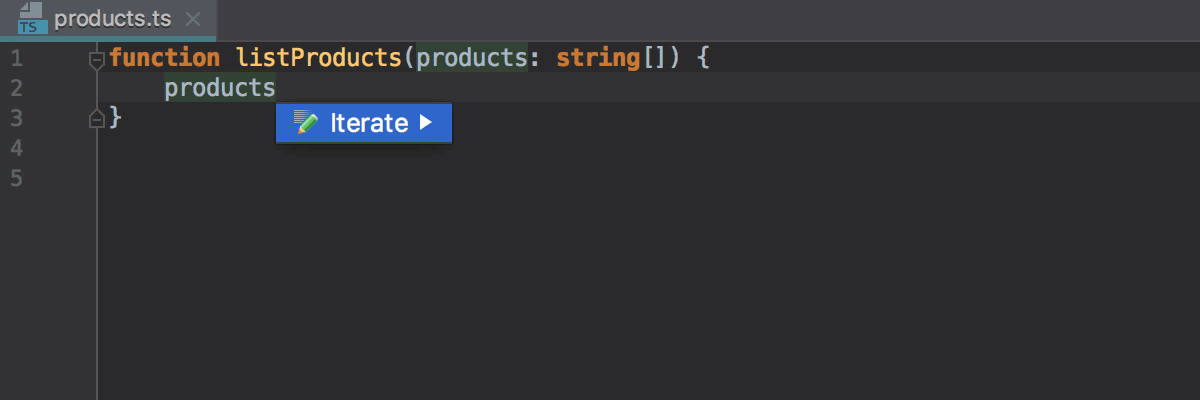
Iterate with ‘for..of’
This intention is available for an array or symbol that you can iterate over with for..of in the JavaScript and TypeScript files.
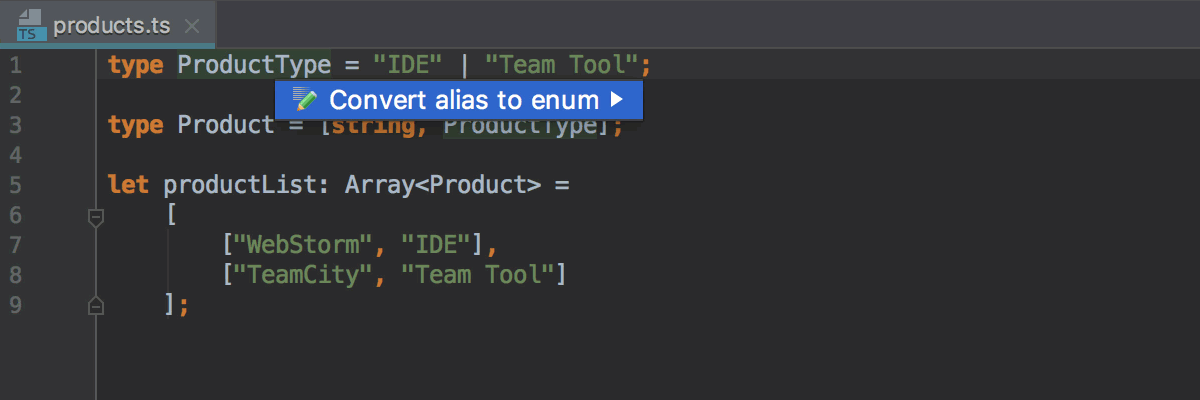
Convert type alias to enum
This intention can convert a type alias with string literals in it into an enum and is available only in TypeScript.
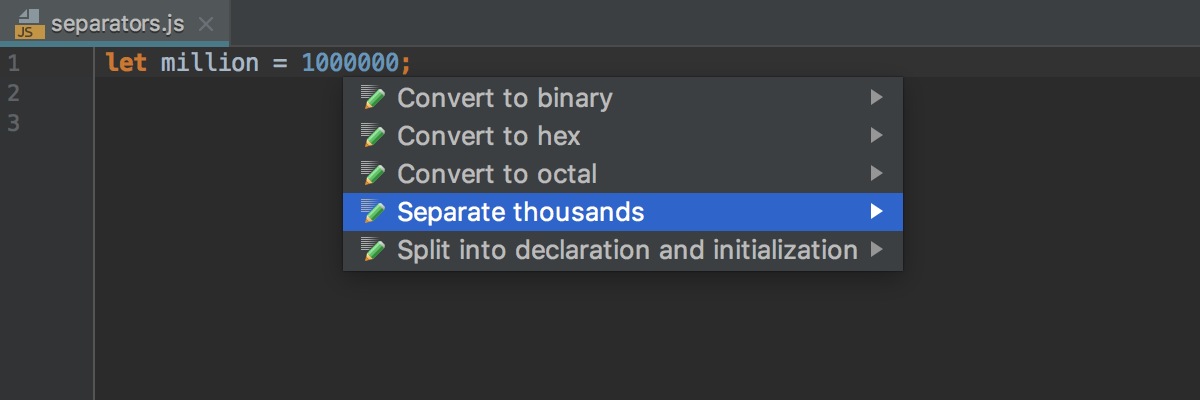
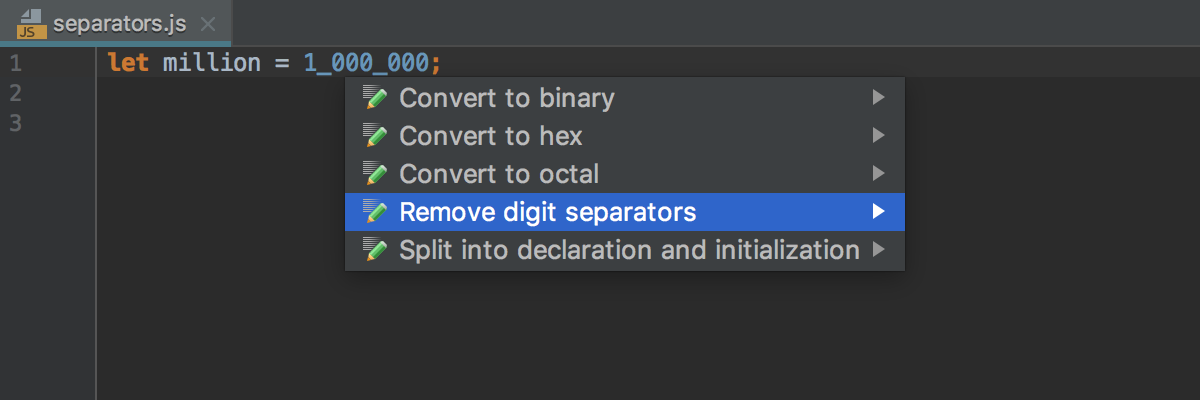
Add and remove digit separators
This intention uses the numeric separators feature of JavaScript (now it’s a Stage 3 proposal) which allows you to add underscores to the numeric values to improve their readability.
Custom templates for postfix completion
Postfix completion is a great feature for adding template code around an expression you’ve just typed. The available templates are listed in Preferences | Editor | General | Postfix Completion. They expand when you press Tab or when you select them in the code completion popup.

Now you can add your own templates for postfix completion!
Let’s see how we can create a template that will expand into a class for a new React component:
- In Preferences | Editor | General | Postfix Completion, click the + icon.
- Select the language where the template will work. Note that all JavaScript templates will also be available in TypeScript files.
- Select the key (abbreviation). We’ll use
rcomp - Specify the JavaScript language level. For our template, we want it to work only in JSX code.
- Now add the template code and add
$EXPR$in the places where the initial expression should appear. Add$END$where you want the cursor to be at the end:
class $EXPR$ extends Component {
  render() {
    return (
      <div>

      </div>
    );
  }
}

export default $EXPR$;
- Save the template. Now you can use it in the editor!

Support for TypeScript 2.9 and 3.0
WebStorm adds support for the following TypeScript 2.9 and 3.0 features:
- `import.meta` property
- import(…)-ing types
- Passing generics to tagged template calls
- Using number and symbol named properties with keyof and mapped types
- Tuples in rest parameters and spread expressions
- New unknown top type
- Named type arguments & partial type argument inference
TypeScript quick fixes from the language service
WebStorm now shows more quick fixes provided by the TypeScript language service. Now you can use not only the quick fixes for the reported errors, but also suggestions like this one:
Press Alt-Enter to see the available intentions provided by WebStorm, and those from the TypeScript language service.
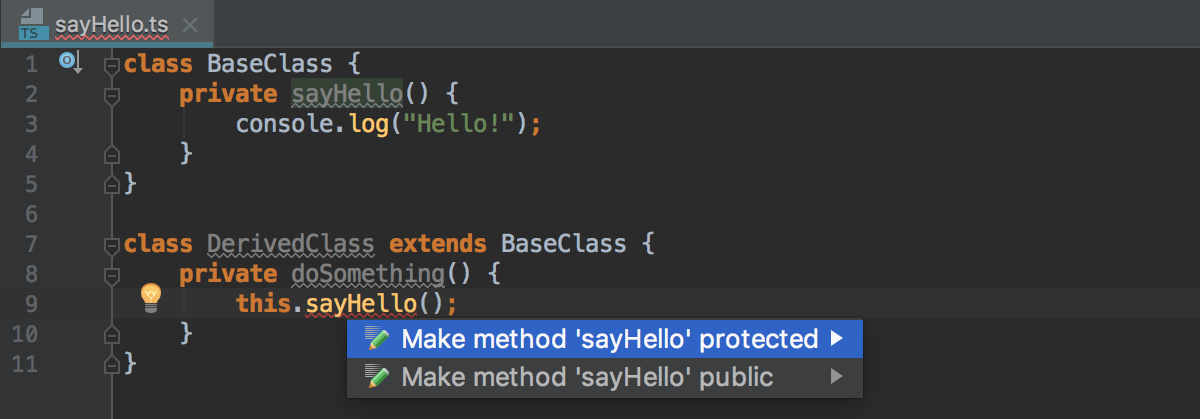
New quick-fix “Make method protected or public” in TypeScript
We’ve also added a new quick-fix that fixes the visibility of a method if it was inaccessible:
Use TypeScript Language Service for all projects with TypeScript files
Now WebStorm uses the TypeScript Language Service for any TypeScript file, even if the project doesn’t have a tsconfig.json file. WebStorm will then use the bundled TypeScript version and the default configuration.
You can disable this behavior if you uncheck the “Also for projects without tsconfig.json” option in Preferences | Languages & Frameworks | TypeScript.
JSON support
Support for JSON5
WebStorm 2018.2 now supports the JSON5 standard. By default, you can use the new syntax only in files with the .json5 extension, but you can extend it to all .json files. To do this, open Preferences | Editor | File types, find JSON5 in the list and add *.json to the registered pattern for it.

Copy JSON Pointer
Another useful improvement in this area is the new action that allows you to copy the JSON pointer, a path-like string for the selected object.

Improved support for JSON Schemas
For some time already, WebStorm has been able to validate JSON files and provide code completion in such files using JSON Schema, a special format for describing their structure and contents.
In WebStorm 2018.2, we have improved support for JSON Schema in many ways.
WebStorm can now automatically download and use schemas from the JSON Schema Store that hosts schema files for many popular configuration files.
As soon as you’ve opened a file whose name is associated with one of the available schemas (for example, composer.json), WebStorm will download and use this schema for it. You will see the name of the applied schema in the status bar.

If you have a custom name for a config file, you can manually select a required schema from the list on the status bar.
We have also updated the configuration of custom JSON Schemas that you can add to the IDE and use for specific files in your project. You can now specify the URL of the schema file. It’s available in Preferences | Languages and Frameworks | Schemas and DTDs | JSON Schema Mappings.
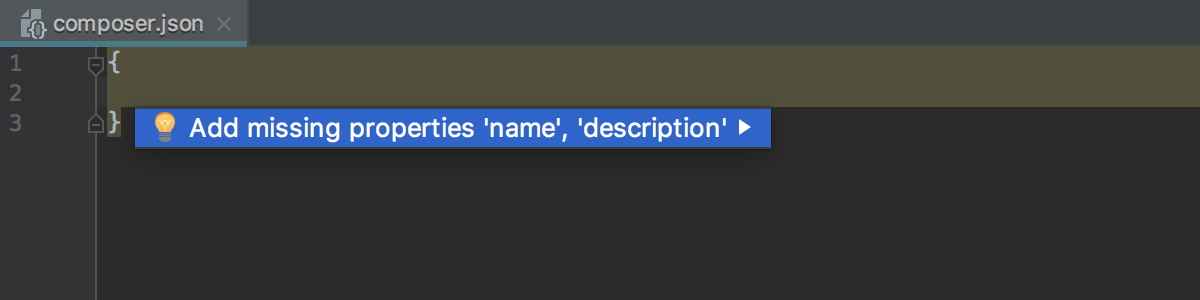
Add missing required properties in JSON files
As we’ve already mentioned in one of the earlier EAP updates, WebStorm can validate your JSON files using the JSON Schema. We’ve added a quick fix that allows you to add all the missing required properties to your JSON file.
Linters integration
Different highlighting for TSLint errors and warnings
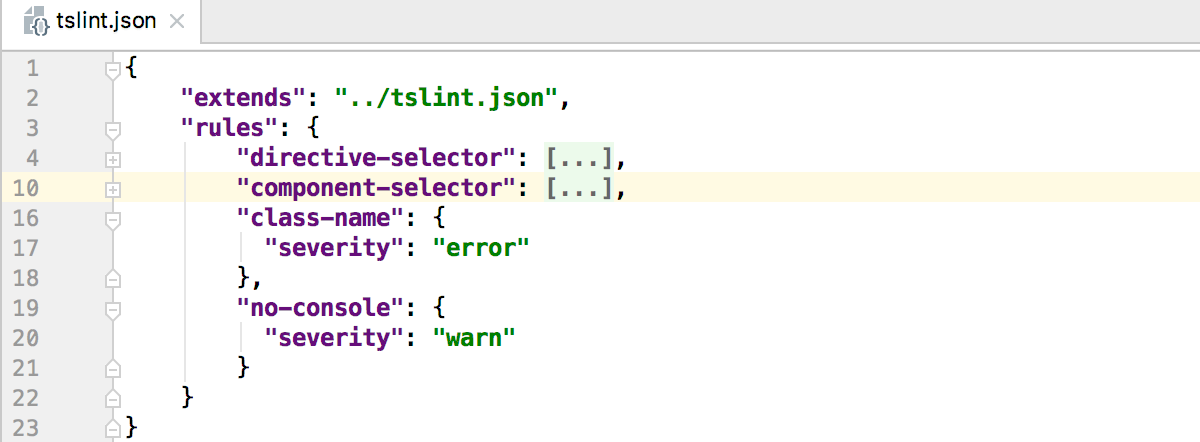
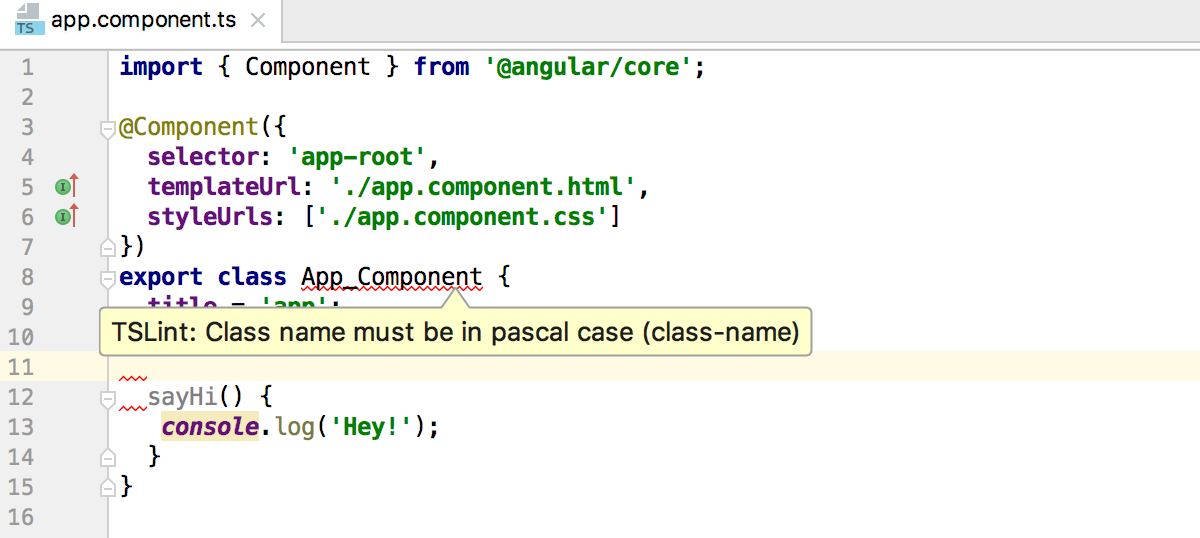
WebStorm now respects severity levels selected for rules enabled in the TSLint configuration file. By default, the errors will now be highlighted with a red squiggly line, while warnings will be marked with a yellow background.
Automatically apply code style rules from all types of ESLint and TSLint configuration files
For some time already, WebStorm has enabled you to apply the known code style rules specified in the ESLint and TSLint configuration files to the IDE JavaScript or TypeScript code style settings.
Now WebStorm can automatically import known rules from any configs when you open your project for the first time, as long as you have ESLint (or TSLint) installed. (This is because WebStorm needs to run ESLint itself to transform the config into JSON that the IDE understands.)
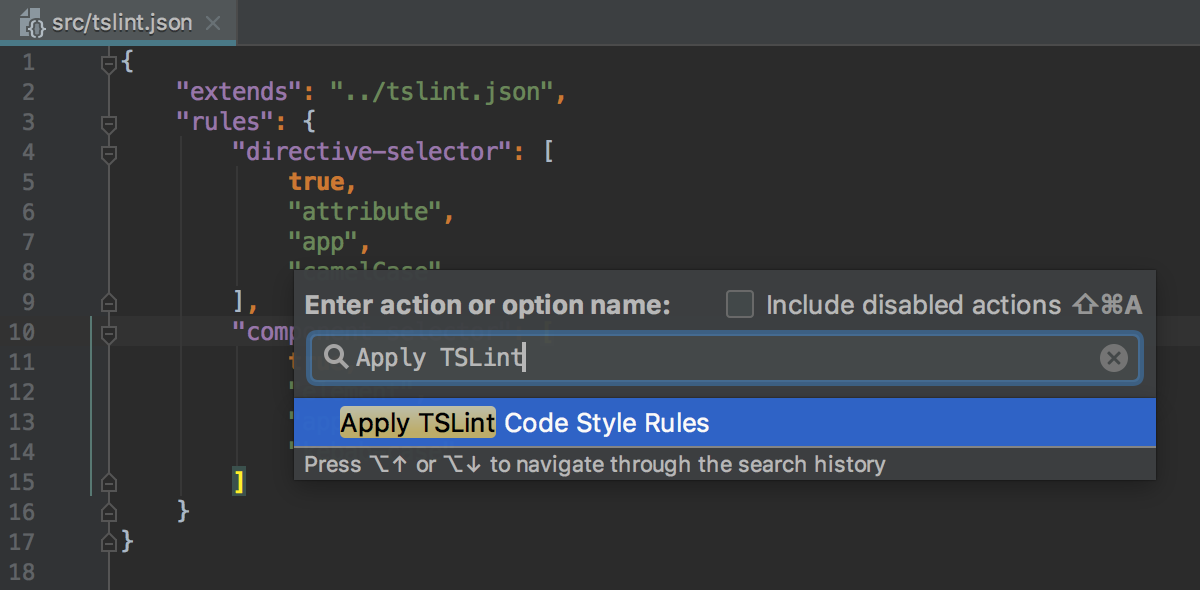
Before, WebStorm did this only for simpler configs written using JSON. For configs written in JavaScript or YAML or extending some preset, WebStorm required you to use the Apply ESLint Code Style Rules action. Now, you still need to use the action if you’ve updated your ESLint or TSLint configuration. It’s available via the Find Action popup or in the file’s context menu.
By the way, you can now also apply code style for the TSLint configurations that have the extends field. For example, if your tslint.json file extends the tslint-config-standard preset, WebStorm will automatically apply the rules related to the use of semicolons and defined in the preset to the TypeScript code style settings in the IDE.
Debugging
Breakpoint intentions
You can now simply press Alt-Enter on a line with a breakpoint and see the breakpoint-related actions in the list, along with all the other available intentions!

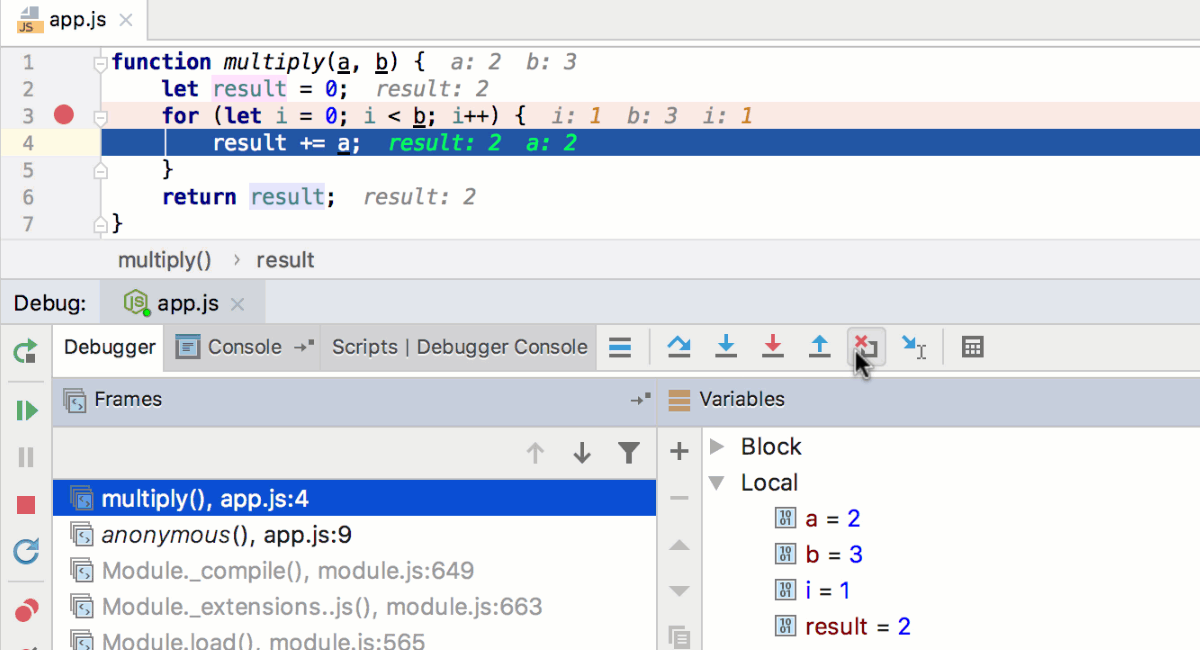
Drop frame in debugger
Now you can use the Drop frame action when debugging JavaScript and Node.js. This can be helpful to re-enter a function if you missed a critical spot you would like to see again.
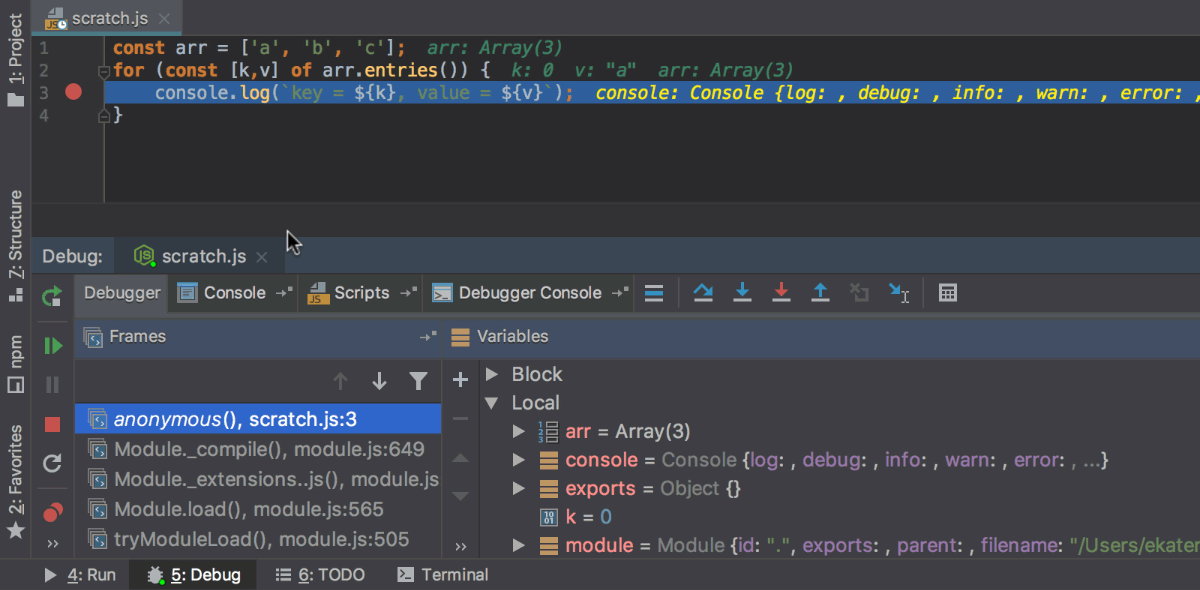
Debug scratch files
You can now debug JavaScript scratch files – temporary files that you can quickly create by using the Cmd-Shift-N shortcut on macOS or Ctrl+Shift+Alt+Insert on Windows and Linux.
Put the breakpoints anywhere in your file and then press Ctrl-Alt-D / Alt+Shift+F9 to start debugging it using the built-in Node.js debugger. Please keep in mind that your code will be run using node, which means it should not use any browser APIs or any syntax that is currently not supported in node.
Testing
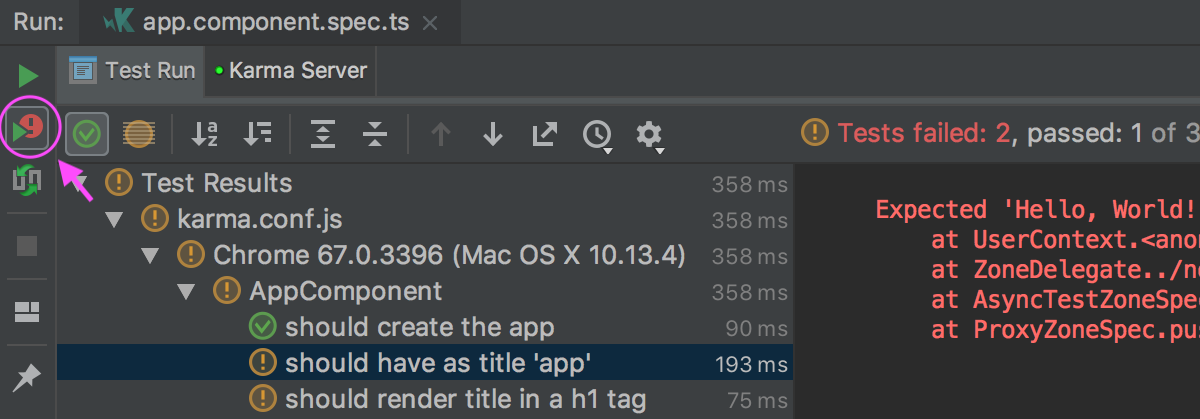
Rerun failed tests
There’s a new Rerun Failed Tests action available when you run tests with Karma, Jest, or Mocha in WebStorm. As the name suggests, it allows you to rerun only those tests that have failed, instead of running all tests after the fix.
Navigate to Jest snapshot
If you are doing snapshot testing with Jest, you will notice a new icon shown on the left editor gutter when your test file is opened. Use it to navigate to the related snapshot file. Or put the caret on toMatchSnapshot and use the Related Symbol action.

Diff view for Jest snapshots
If your Jest test has failed because of the mismatch in the snapshot, you can now see why using the familiar IDE side-by-side diff view. To open it, click on the link in the Run tests tool window.

Debugging Karma tests using Chrome Headless
Karma allows you to use Chrome Headless for running your tests (check out this great tutorial in the Chrome blog). With Karma, your tests are executed in a real browser environment but without the overhead created by running a full Chrome instance.
WebStorm now enables you to debug Karma tests in Chrome Headless (whereas previously you could only run them there).
To run and debug tests in Chrome Headless using Karma, add browsers: ['ChromeHeadless'] to the karma.conf.js file, or list it as a browser in WebStorm’s Karma configuration (see the screenshot below). For more info on setting up your project to use Chrome Headless, see this tutorial.

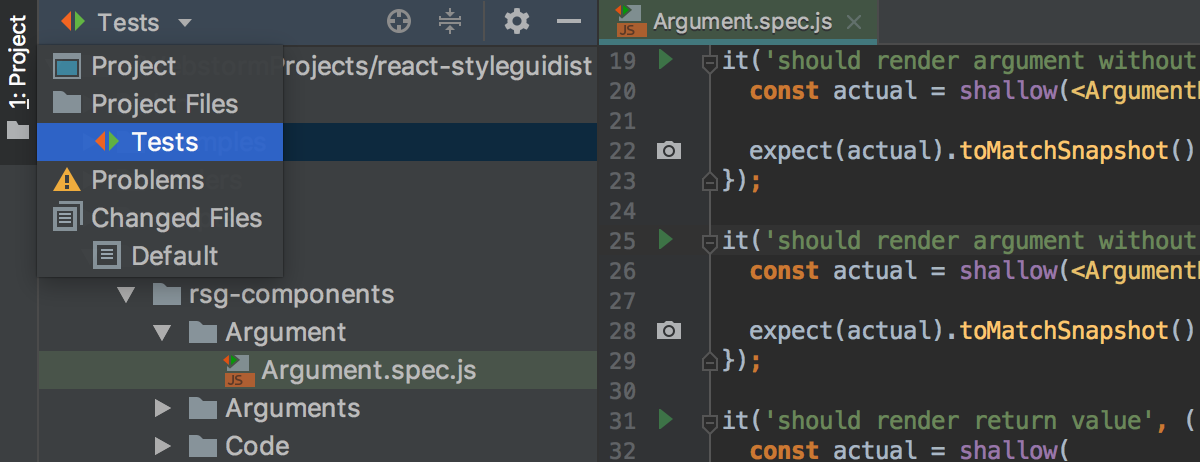
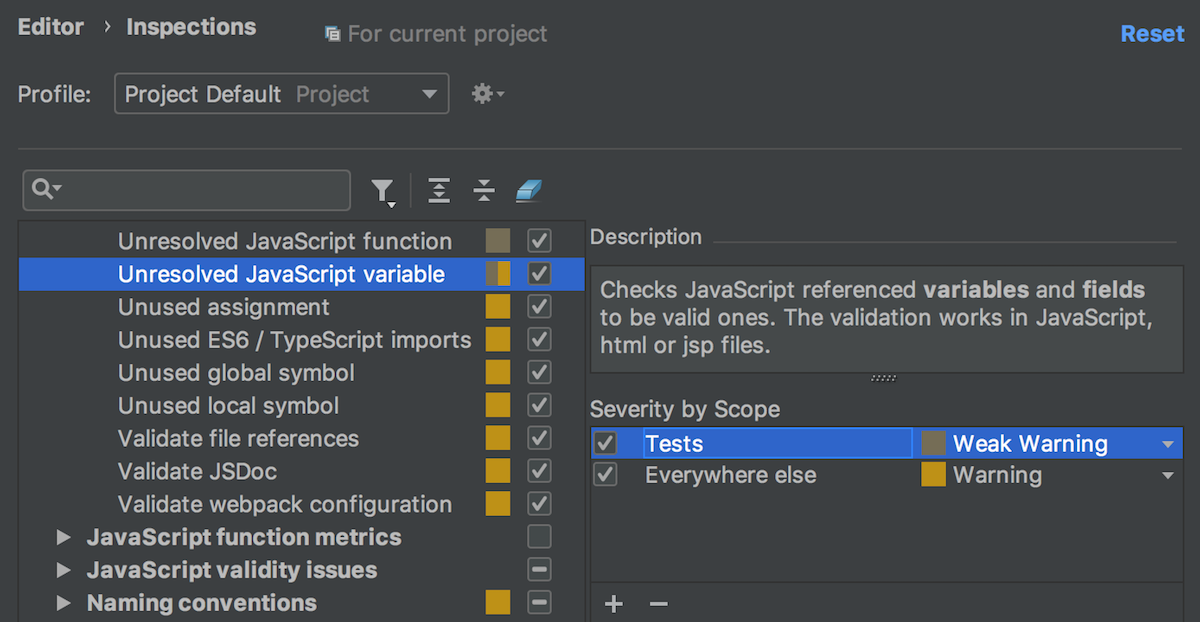
Test files in the Tests scope
Now, test files whose names follow common patterns like *.test.js or *.spec.js are now automatically added to the default Tests scope. You can select this scope in the Project view to see the test files available in the project. Or you can use it to configure the use and severity of inspections.
Version Control
Automatically register Git and Mercurial repos as VCS roots
If you open a folder that is part of a Git or Mercurial repository, WebStorm now automatically enables version control integration for it. So, no more “unregistered roots detected” notifications when you open a project.
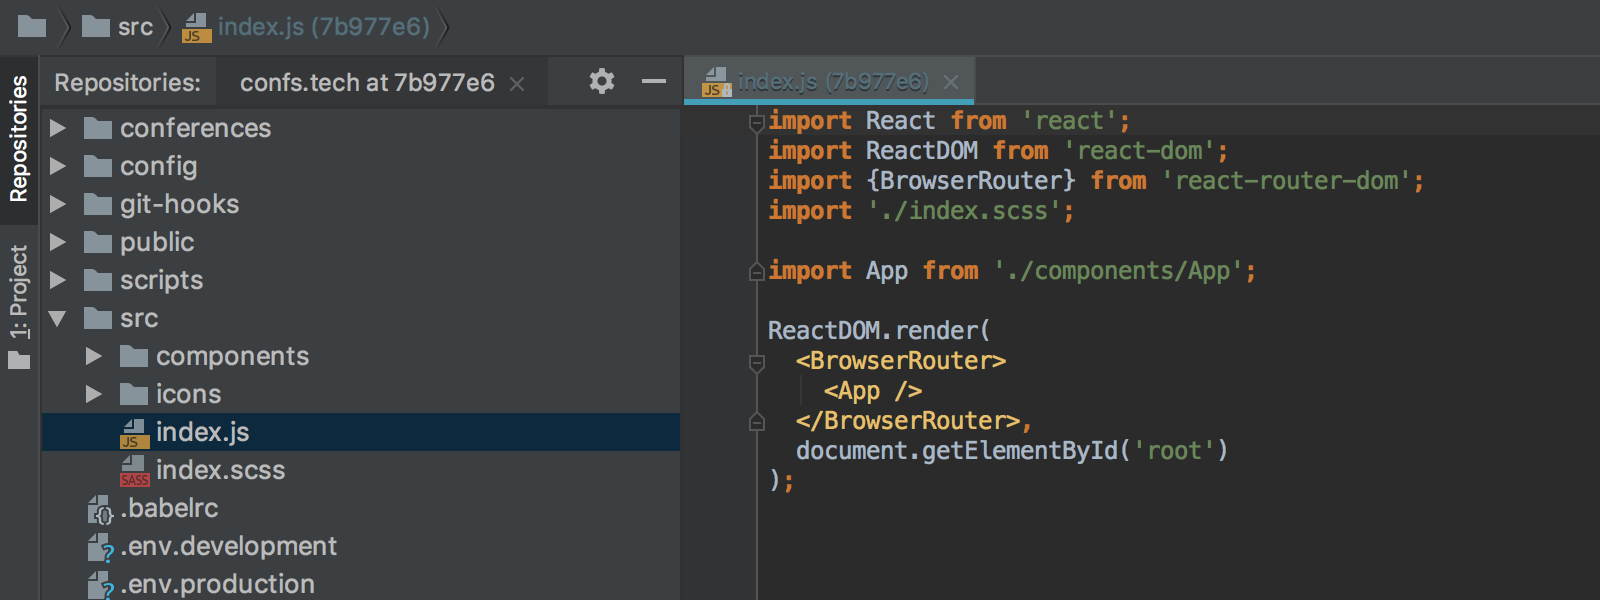
New Browse Repository at Revision action
With the new Browse Repository at Revision action, which is available from the context menu in the VCS Log or from the file history, you can now explore files in your project at any given revision without a checkout. From the special Repositories view, you can see the project structure and view the files in read-only mode.
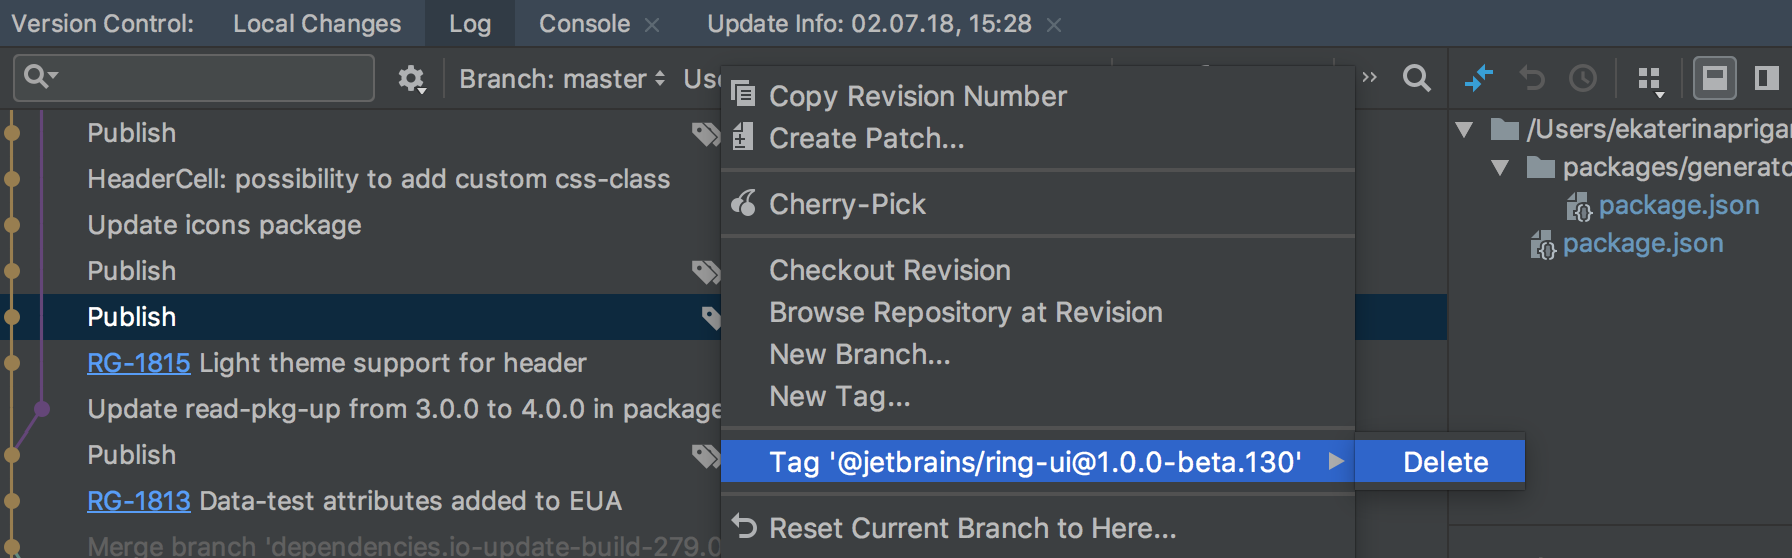
Delete a Git tag in Log
You can now remove Git tags from a commit right from the context menu of the Log tab.
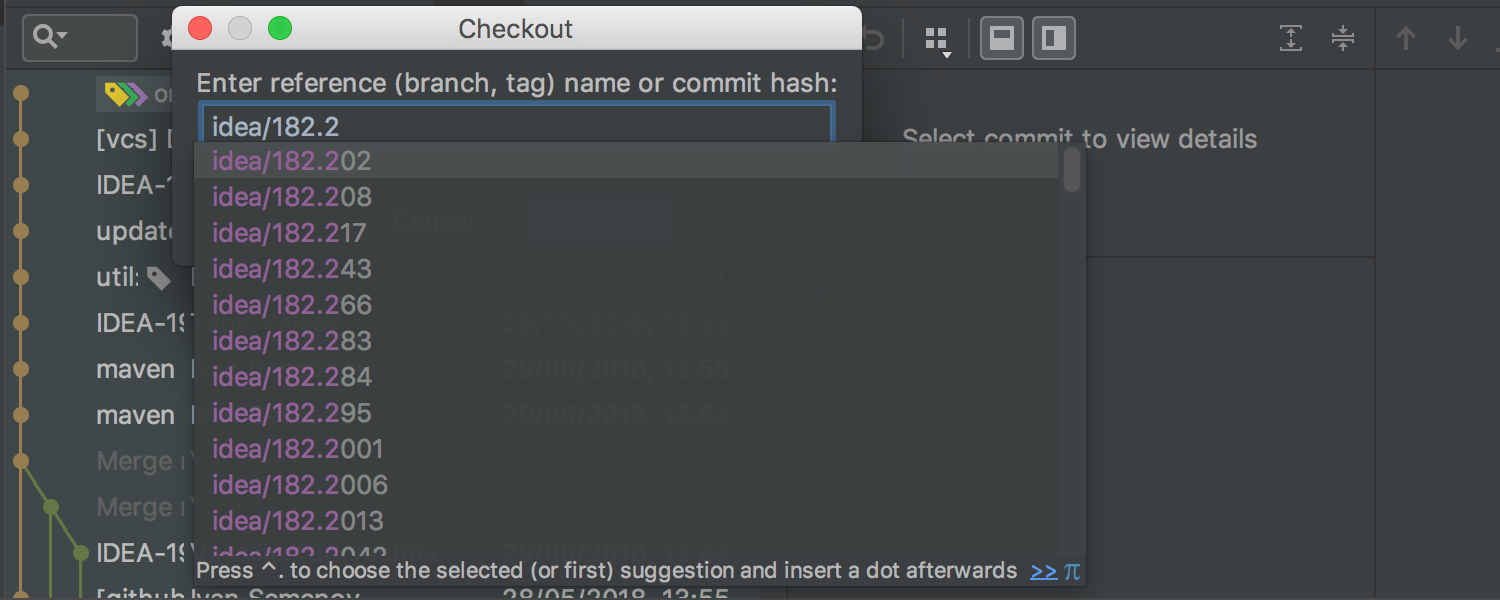
Completion for Git tags
WebStorm now autocompletes tags in the Checkout dialog.
Plugins for Perforce and CVS now need to be installed separately
If you want to use the integration with Perforce or CVS in WebStorm, you now need to install the corresponding plugin via Preferences | Plugins – Install JetBrains plugins. These plugins fully bring the functionality that was earlier available in WebStorm out-of-the-box.
Other IDE improvements
Touch Bar support
Last, but not least is the MacBook Touch Bar support.
Now you can run, build, and debug your project, along with committing changes or updating the project right from the Touch Bar. The Touch Bar shows the controls depending on the context or which modifier keys you press. We support the most popular contexts, and even better – the contexts can be customized! Read more in the IntelliJ IDEA’s blog.
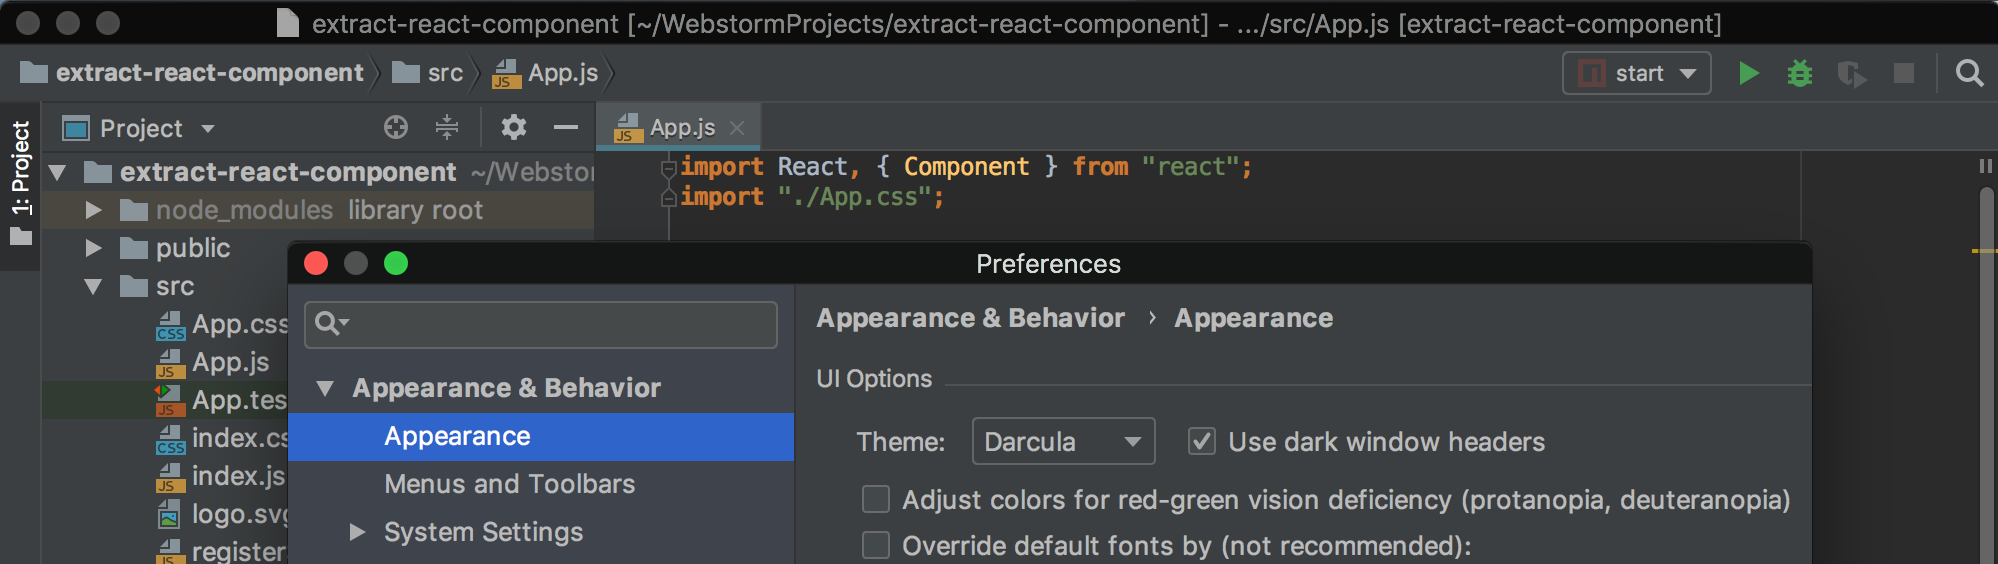
Dark window headers on macOS
If you like the dark theme and you use macOS, you can now make WebStorm ever darker with the dark window headers. To turn them on, go to Preferences | Appearance & Behavior | Appearance, select the new Use dark window headers option, and restart the IDE to apply the changes.
For the full list issues and bugs fixed in WebStorm 2018.2, please see the release notes.
WebStorm Team