.NET Tools
Essential productivity kit for .NET and game developers
What Is the Deal with Memory Difference Mode?
dotTrace 2.0 offers two different ways to profile memory. Each of them is useful for a particular type of profiling tasks, described below.
Dump Memory Mode
You can dump memory at any given time to see what’s in it. This is good for checking whether certain objects are allocated in memory if they are supposed to (or not supposed to), and whether they consume as little memory as they should.
Here’s how you do that:
- Start the application for profiling
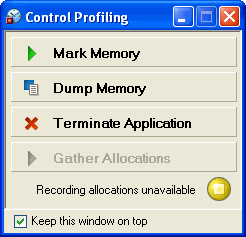
- At any time, click the Dump Memory button on the Control Profiling dialog to generate a snapshot:

Memory Difference Mode
This lets you check the difference between two application memory states. It’s a good way to profile a certain feature or action in your application. For example, you can have the application open a file and close it, and then see whether all objects associated with the opened file have been properly disposed of. For this, you need to mark the first point in time (“Point A”), let the application do something, then mark the second point (“Point B”). A memory snapshot generated in this way will contain all data related to the memory differences between Point A and Point B.
Here’s how you do that:
- Start the application for profiling
- At any time, click Mark Memory on the Control Profiling dialog to mark Point A
- In the profiled application, perform the action that takes you from Point A to Point B
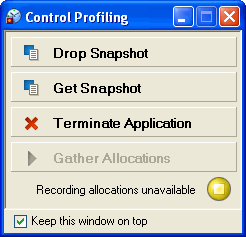
- Click Get Snapshot to mark Point B and generate a snapshot:

- If you want to return to regular profiling mode (no snapshot generation), click Drop Snapshot
In both of these modes, the profiled application continues to run after a snapshot is taken. You are free to combine profiling in the dump memory mode and the memory difference mode as your profiling needs require.


