Datalore
Collaborative data science platform for teams
New in Datalore Community and Pro: The Report Builder
The Datalore team is getting ready for the major release of Datalore Enterprise 2022.3 (the self-hosted version of Datalore). As always, Datalore Community and Professional users will get to see the new features first! We’ve been working on redesigning the reporting workflow and making Datalore notebooks and reports even more interactive.
In this blogpost we’ll give a short introduction to the new features and will share more details in upcoming newsletters!
What is the Report builder?
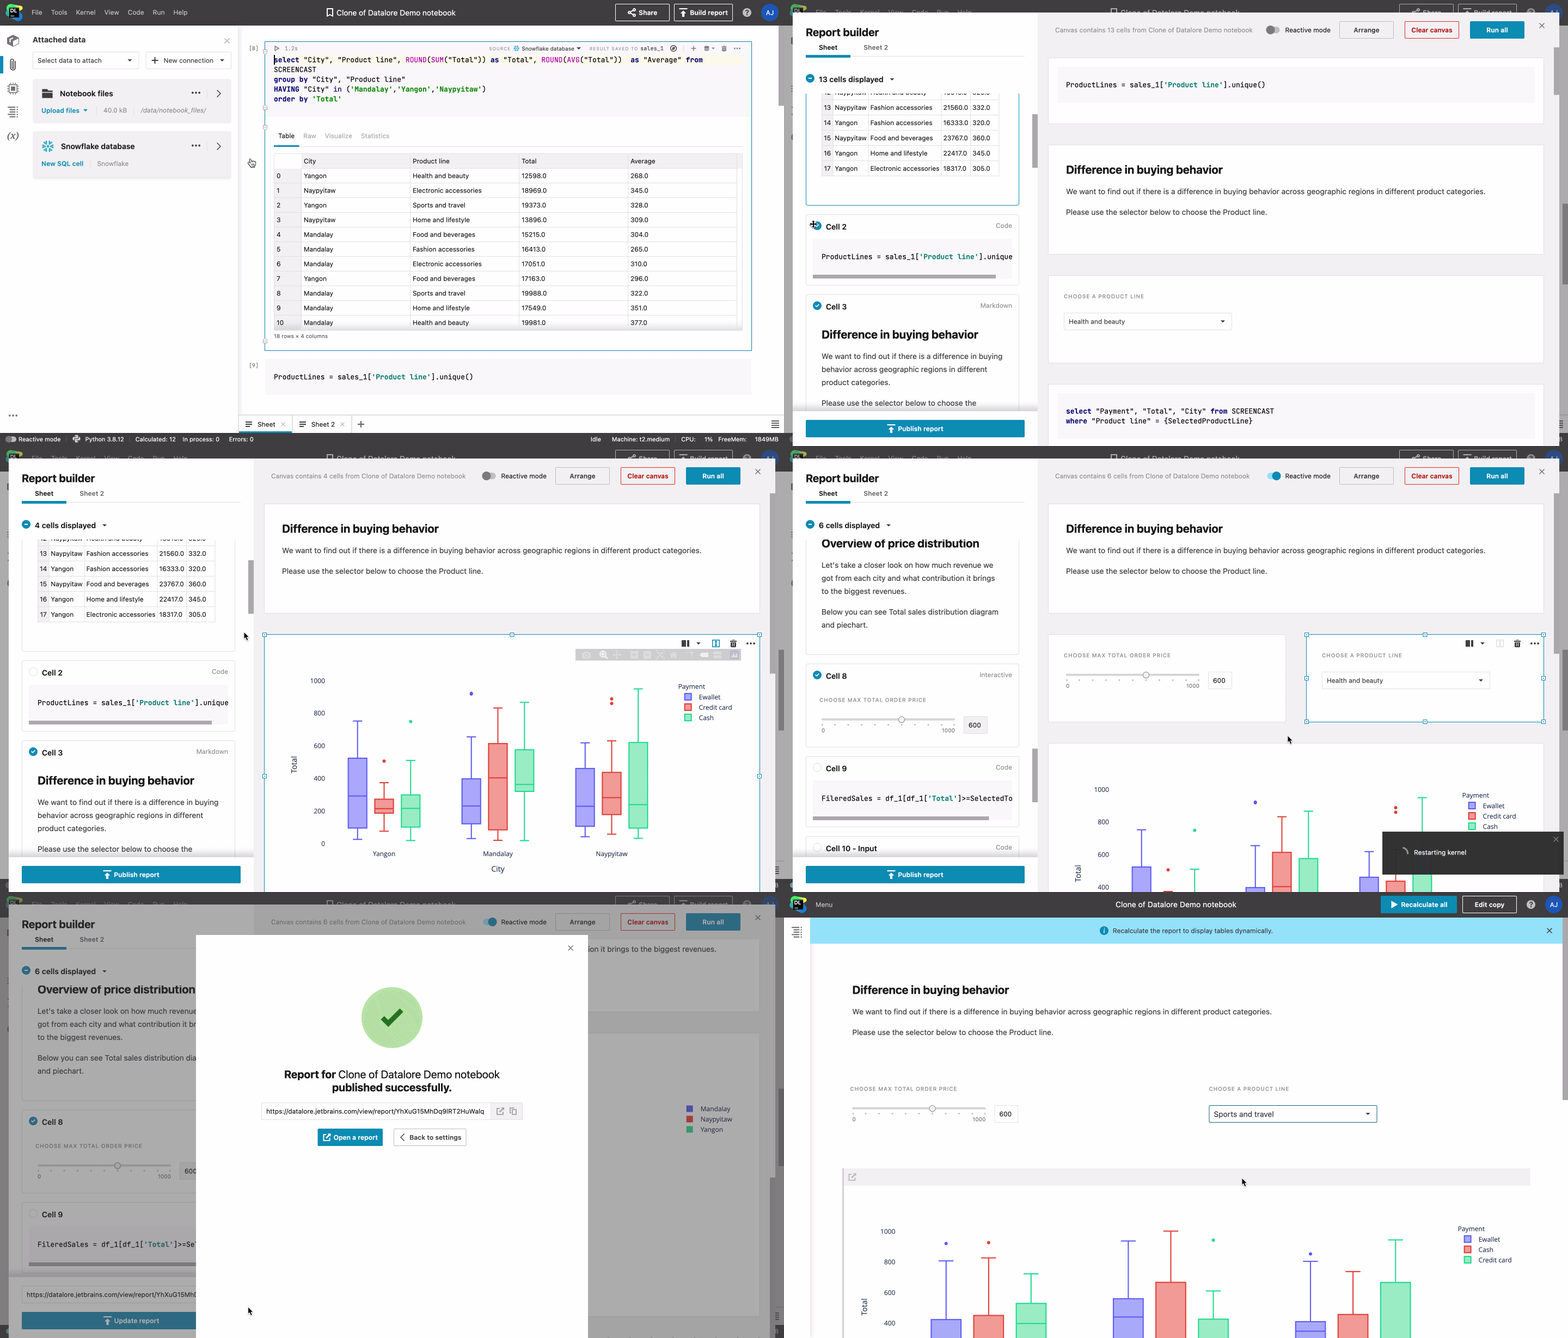
The Report builder is a flexible new way to turn your notebooks into beautiful data reports. You can arrange the cells on the canvas, change their size, and rerun your report to make sure that it works correctly before publishing it.

Here is a quick summary of what has changed:
| Before | Now | |
| Cell order | Linear only. | Arrange cells however you want on the canvas. |
| Cell visibility | Configured via cell visibility controls. | Drag and drop the cells you need, or choose from the list in the report builder. Cell visibility controls have now been deprecated. |
| Cell size | Same as in the notebook. | Customizable. |
| Preview of the report before publishing | Not available. | Available in the Report builder. |
| Table of contents | Available in Interactive reports only. | Available in both Static and Interactive reports. |
Important note: We’ve deprecated the Cell visibility controls, since the Report builder offers the same functionality through drag and drop and the use of selectors in the side panel. Your previously published reports shouldn’t be affected. If you notice any issues, please report them to datalore-support@jetbrains.com.
What do you think about the new way to build reports? Please try out the new features and share what you think in this thread. We’re also planning a webinar on tips and tricks for building reports in Datalore, so keep an eye on the announcements!
Happy analyzing!
The Datalore team
Subscribe to Datalore News and Updates


