.NET Tools
Essential productivity kit for .NET and game developers
Case Study – Why Consistent Profiling Pays Off
The compound effect is when small changes executed consistently over time lead to dramatic results. It can go both ways, either enhancing the positives or aggravating the problems.
Regular profiling, or lack thereof, is a good example of the compound effect. If you invest a little bit of time in making small but steady improvements in your application’s performance, they can lead to huge benefits over time. And vice versa, if you keep neglecting issues, they will compound, and sooner or later you’ll have a sluggish and unwieldy piece of software on your hands. More often than not, developers go the second way and end up spending lots of time and effort trying to fix serious performance problems. In this interview, Dylan Moonfire tells us how to avoid this and do things right from the get-go.
Hey Dylan! Could you say a few words about yourself and your background? What are the main activities you are mainly involved in at work?
I’ve been coding since about the ’80s, so it’s been almost 40 years. I’ve been in many fields like finance, telecommunications, and compliance. Now I work for one tax company focusing on unclaimed properties, which has compliance rules dealing with different jurisdictions. I’m the development lead, so I get to tell people that their code doesn’t match our standards. Usually, finding bugs takes less than two minutes because I’m a very detail-oriented person, so I just memorize most of the code, and I usually can say, “Yep, there’s a bug”.
Could you tell us the most memorable story of how you encountered performance or memory issues in your application? How did you find the problem, and what steps were taken to troubleshoot it?
In a previous product, we had a problem with Schedule D filing for the NAIC, which lists every obligation for the year. We were dealing with a huge customer, so it would take two and a half hours to open the form, causing the whole system to lock up. Some parts of the code were trying to load all 2.5 million policies in the memory to write it out to a WinForms grid. For some reason, it was choking. To investigate the roots of the problem, we used profilers and a ton of printf statements, but then dotMemory finally told me where I had too many objects. So it helped me to isolate the problem. I ended up doing profiling and optimizations in about three and a half months, where I just looked at the results, tried to analyze them, had been coding over the whole week, and then on Friday kicked off a new profiling run over the entire weekend. It did require a fair amount of rework. The problem occurred because a third party came in and tried to fix another bug, slurping everything in, and then they coated on top of it for five years. And so it was backing out the code, and I removed 42,000 lines of code and reduced the startup time to 15 minutes. That was a very fun time.
Another story is when I was in production taking 12 GBs of RAM. I grabbed a profiler and found that we had billions of copies of all these letter combinations. That was when I convinced my bosses I was allowed to do profiling every once in a while. That started me being able to create tickets all the time on things that could be a problem later. Sometimes the tool gives me more information I didn’t have before, or the code is settled enough that I can now see the next biggest hurdle. And so profiling is about slow, incremental changes over time to make everyone’s life easier.
Why weren’t the problems detected during testing?
It is challenging to create large-scale tests. A thousand records is one thing, but if it takes an hour to import one million properties, process them, and then exhaustively test everything, that can be overwhelming. Plus, this customer was magnitudes larger than previous ones, so “it’s annoying but works” quickly became “it is unusable”.
Is profiling an integral part of your development process? Was it always like that?
It is mine. I’m going to say it comfortably started in about 2000, or at least that’s when it became an integral part of my development process. That was when I started getting some really big projects where problems were discovered too late. That happened several times, so I began to think, “I don’t want to deal with it in the future. So I have to deal with it ahead of time.” Finally, I carved out about 10% of my workweek just making life easier for everyone.
I agree with Larry Wall’s philosophy that there are three virtues of a developer, a good programmer. Those are the three basic traits: laziness, meaning you want the computer to do all the work; impatience, meaning you want it as fast as possible; and hubris, meaning you don’t want your co-workers to mock you when they read your code. Impatience cuts in a lot, too, which is especially why I use the profiler. I’ve got some processes down from 2.5 hours to seven minutes. But even seven minutes feels like forever.
So every once in a while, I throw a profiler around and see if there’s something I can do to improve the code. Just because I hate waiting. Whenever I noticed that an app seems to be using a little bit more memory, I tried to grab a memory dump before it became something serious, preemptively. I have created a lot of tickets for “This will cause a problem when we get bigger” because, at that point, it becomes an issue that is usually too late to fix. I cope with two fixes in the morning when you have to solve something and don’t have much time to do it before the workday starts.
Why did you decide to adopt dotMemory at your company? What are the key benefits you get from using it?
Actually, I got familiar with dotMemory through ReSharper Ultimate [currently dotUltimate]. Initially, my profiling experience started with SciTech and ANTS profilers, but as dotMemory got better, I started to use them a lot more.
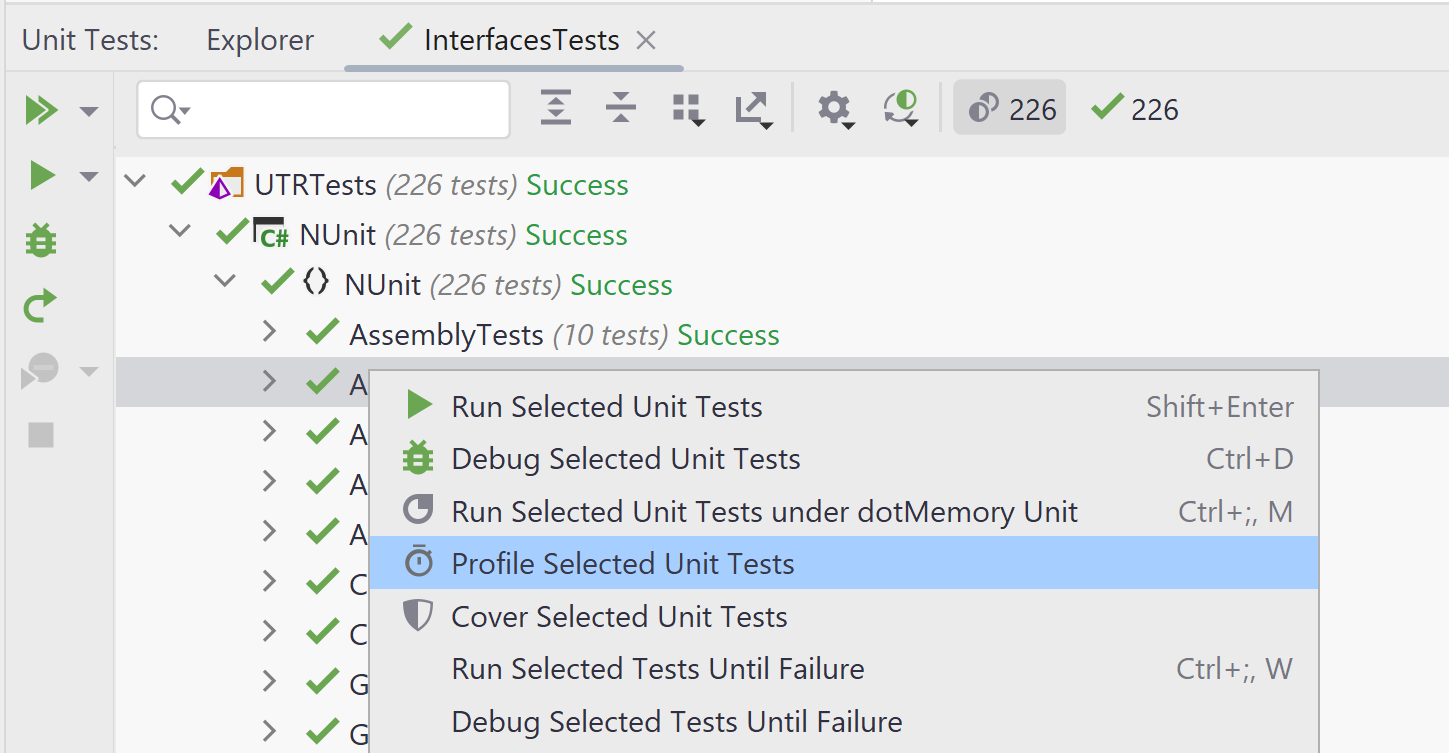
As for the advantages, then I like being able to run it off for the unit tests. I really appreciate ReSharper’s and Rider’s unit test managers and how they tighten into the profiler. If I can isolate a problem, I run the profiler against the tests, let it run overnight, and then look at it and see if I see things that jump out as being wrong. That’s all part of the preemptive telling me if we will be having problems. So there’s always room for improvement.

How did you handle issues before adopting profilers? What was missing, challenging, or problematic in your previous approach?
Before the memory profilers, I had been using WinDbg and SOS, but it took an incredible amount of time to get through that one to remember all the commands. WinDebug was an excruciating period of my life then. So basically, I used to leverage timestamps and printf statements and then write a Perl program to tell me where everything was. It was time-consuming, but that’s where I started my primary job functions.
Well, fortunately, profiling is much easier now. In your opinion, how often should developers use profiling tools if they want to build high-quality software?
As soon as you throw some code at the screen! I start to use profiling right about the time when things are beginning to work correctly in terms of functionality. Correctness and performance are usually the first things we follow because you have to do a lot of stupid or hacky code to make it work. I rate performance pretty high because you’re going to be building on top of it if you want to make sure that your core stuff is good, but also realize it’s going to change. So that goes back to the need to do it incrementally. So carve out just a little bit of time, about 10% in my case, and make life easier. I just make it part of our iterative cycle.
Why did you finally decide to find some time and start profiling regularly? Does this tactic work well?
I think a lot of that came with the idea of compound interest. As you know, like retirement, you put a small amount of money over time consistently, which eventually leads up to the point where you have something significant. The same thing with profiling: even a tiny segment of time to look at performance, if you do it consistently and persistently over time, translates into big improvements across the board thanks to the compound effect. So I don’t aim for huge, massive improvements at once. They’re excellent when we get on. Most of the time, it looks like I shave 2% here, 5% here, again 2% here, but it adds up when you do it year after year, iteration after iteration.
Do you remember your experience of getting started with a profiler? Has anything changed since then?
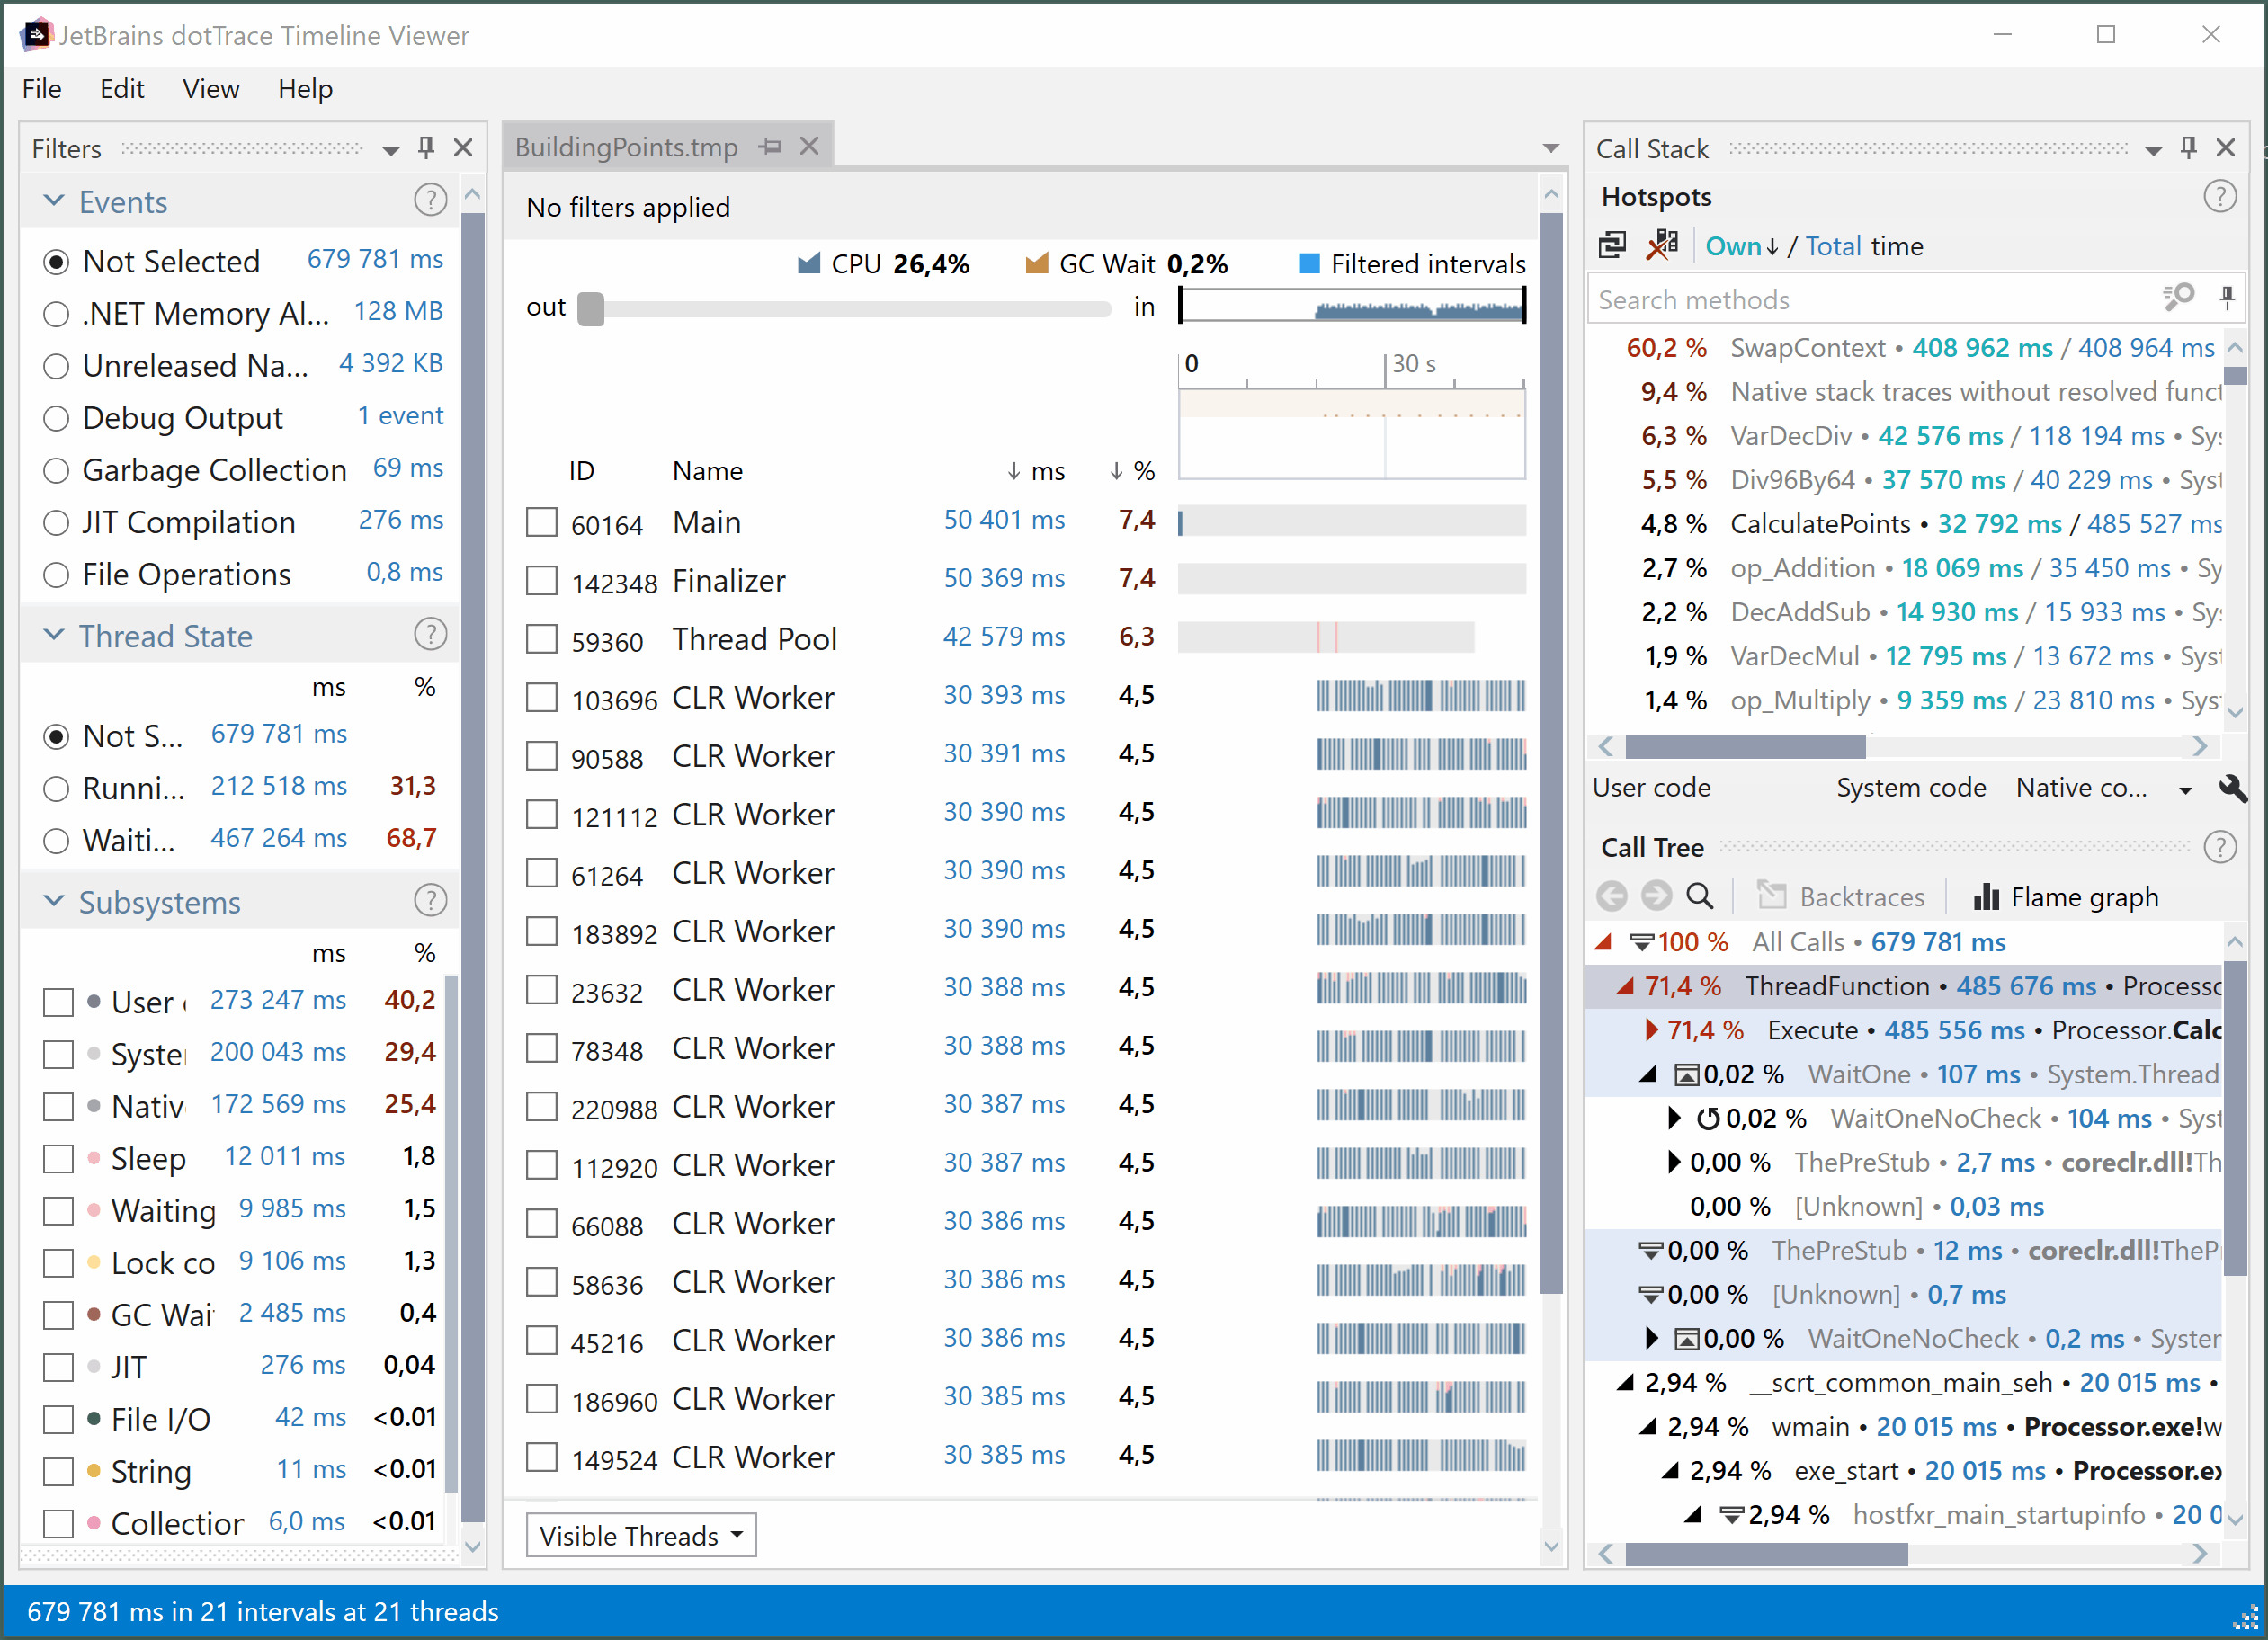
It was 2009-ish. I should say I wasn’t too happy with the profilers at that time. It wasn’t until, I would say, about five years ago that it switched over to the point where I became really happy with dotTrace. About four years ago, I got pleased with dotMemory, getting the information I wanted. A lot of it is navigating through data. For example, I had a lot of trouble finding hotspots and then figuring out where the slowdowns were. So it’s slow-measured incremental improvements that, at a point, finally hit critical mass. And I’m like “I’m happy now”. Since then, I have started using dotTrace and dotMemory as my go-to tools.

Would you like to share some non-obvious tips and tricks with others?
We have special performance tests for running big data. We’re dealing with massive amounts of data, millions of records, but developers’ test data is only 200 to 1,000 records. So we have a dedicated QA site and setups for massive data, which we can run performance stuff on, to hunt issues down. We can look at it and see where it’s wrong. Then you can run the profiler and look at it for the more significant issues. So I highly recommend having similar stuff for stress testing. It’s pretty useful.
We’d like to thank Dylan for taking part in this Q&A session.
Do you also optimize applications with dotMemory? We invite you to share your experiences with us. If you’re interested in an interview, please let us know by leaving a comment below or contacting us directly.


