

Big Data Tools
A data engineering plugin
View the Current State of Variables in Zeppelin Notebooks

Do you remember a long time ago when we introduced a feature in the Big Data Tools plugin called ZTools that allows you to view the current state of variables in a Zeppelin notebook? Do you remember that we made significant changes to ZTools implementation almost a year ago?
It’s our tradition to make big announcements about this part of Big Data Tools yearly, and today we’re announcing multiple exciting changes. If you’d rather just check them out yourself, here is the link to the plugin:
New name
Most importantly, this feature is now called “State Viewer”. We decided to change the name because State Viewer can implement variable viewing for other notebooks too, not just for Zeppelin. There were a few other names being considered, and the choice wasn’t easy.
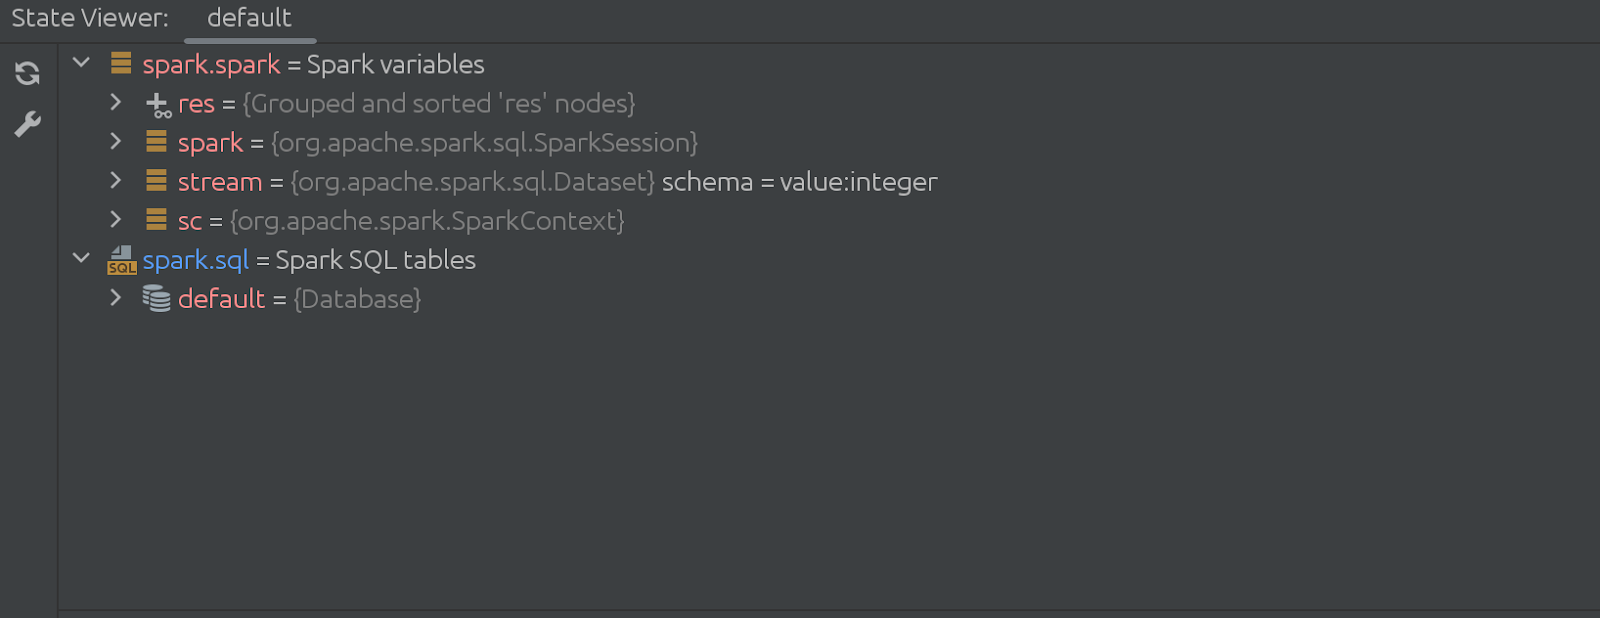
Here is how it looks:
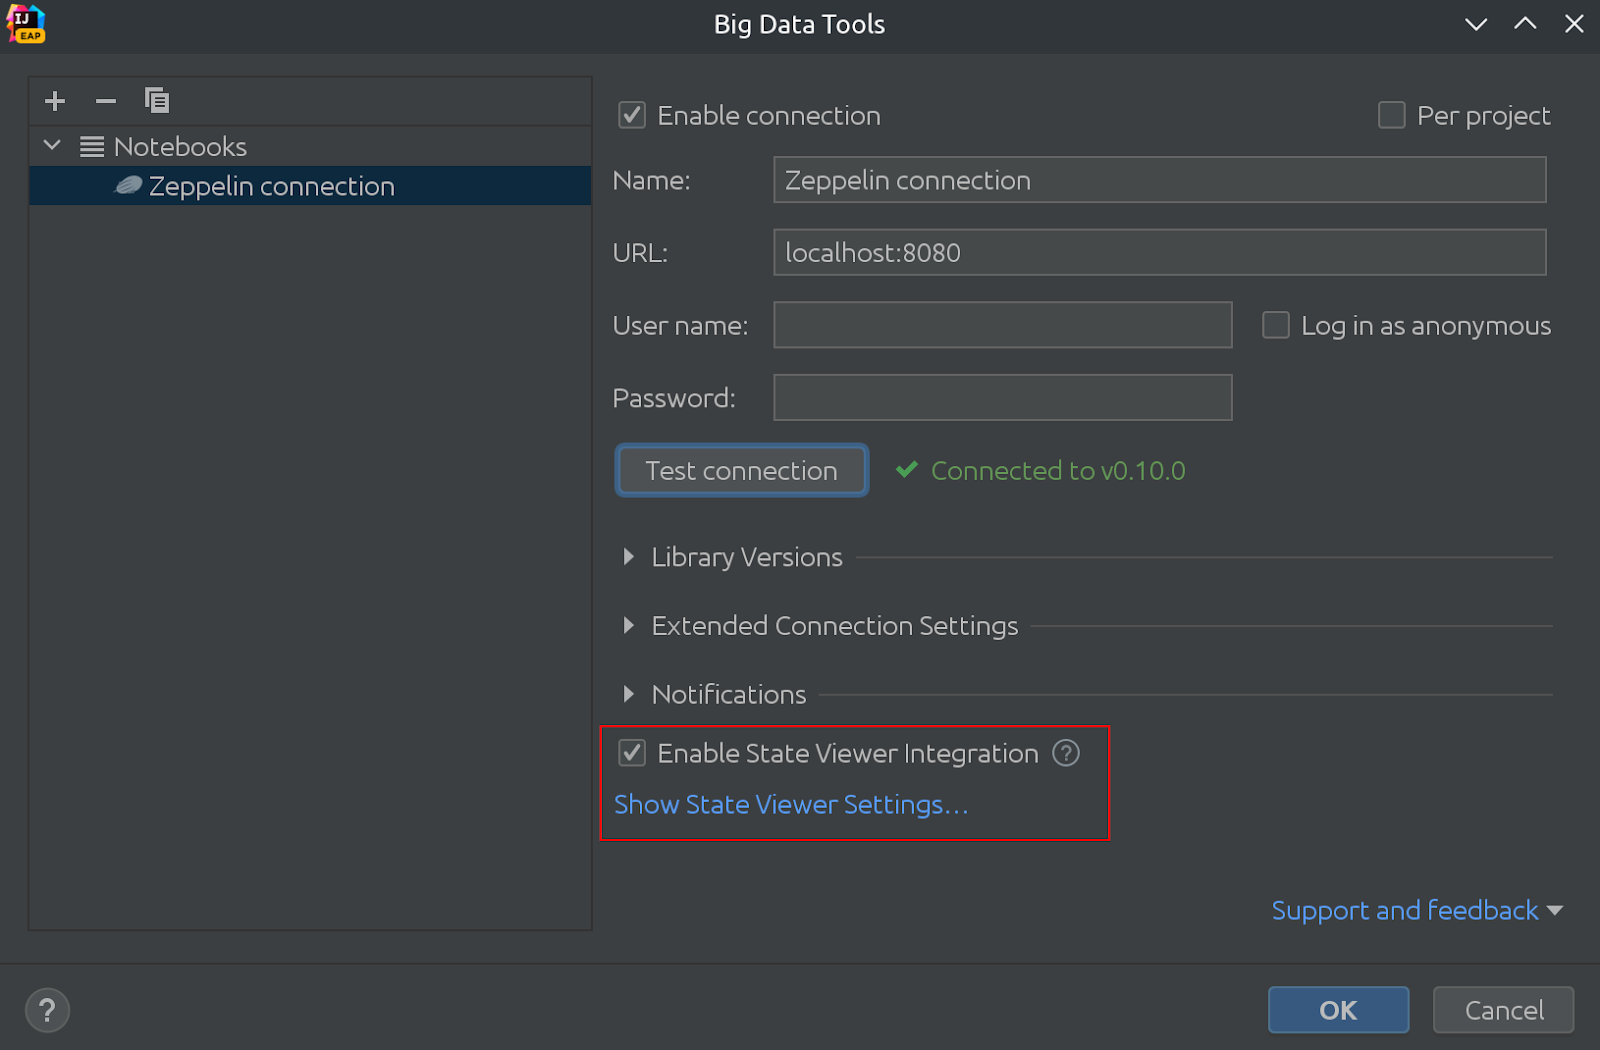
In the same picture, you can see that the State Viewer is now enabled by default!
Thick server to thick client
The first significant change we made was the move from a “thin client” to a “thin server” model. This means that the IDE doesn’t need to install anything into Zeppelin’s interpreter. In turn, this is beneficial when you do not fully control the Zeppelin instance.
How does it work? Well, these changes are evolutionary rather than revolutionary. Previously, State Viewer used background cell execution only to call a method from a library we installed into the Zeppelin interpreter. Now the plugin acts differently, executing the data gathering logic from Zeppelin and sending it to the State Viewer window.
The code of the hidden (disappearing) cell is quite impressive too. It starts like this:
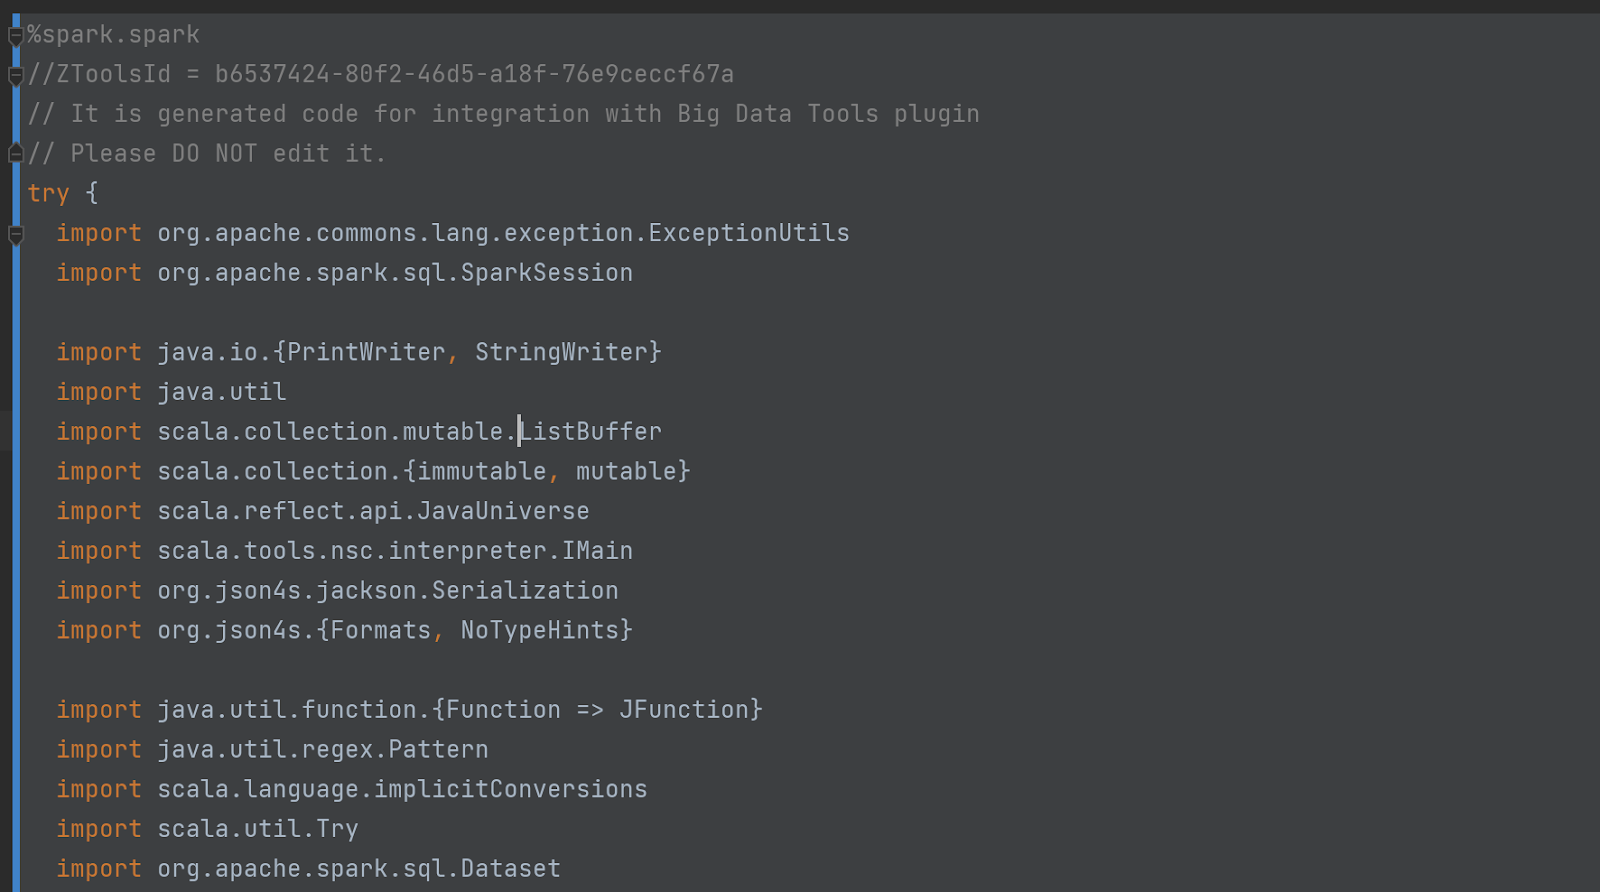
Don’t take our word for it – check out the code yourself! To do so, enable “Debug mode” in the settings:
This leads us to the following significant change: the State viewer settings have been revamped.
State viewer settings
The fully expanded view of State Viewer settings looks like this:
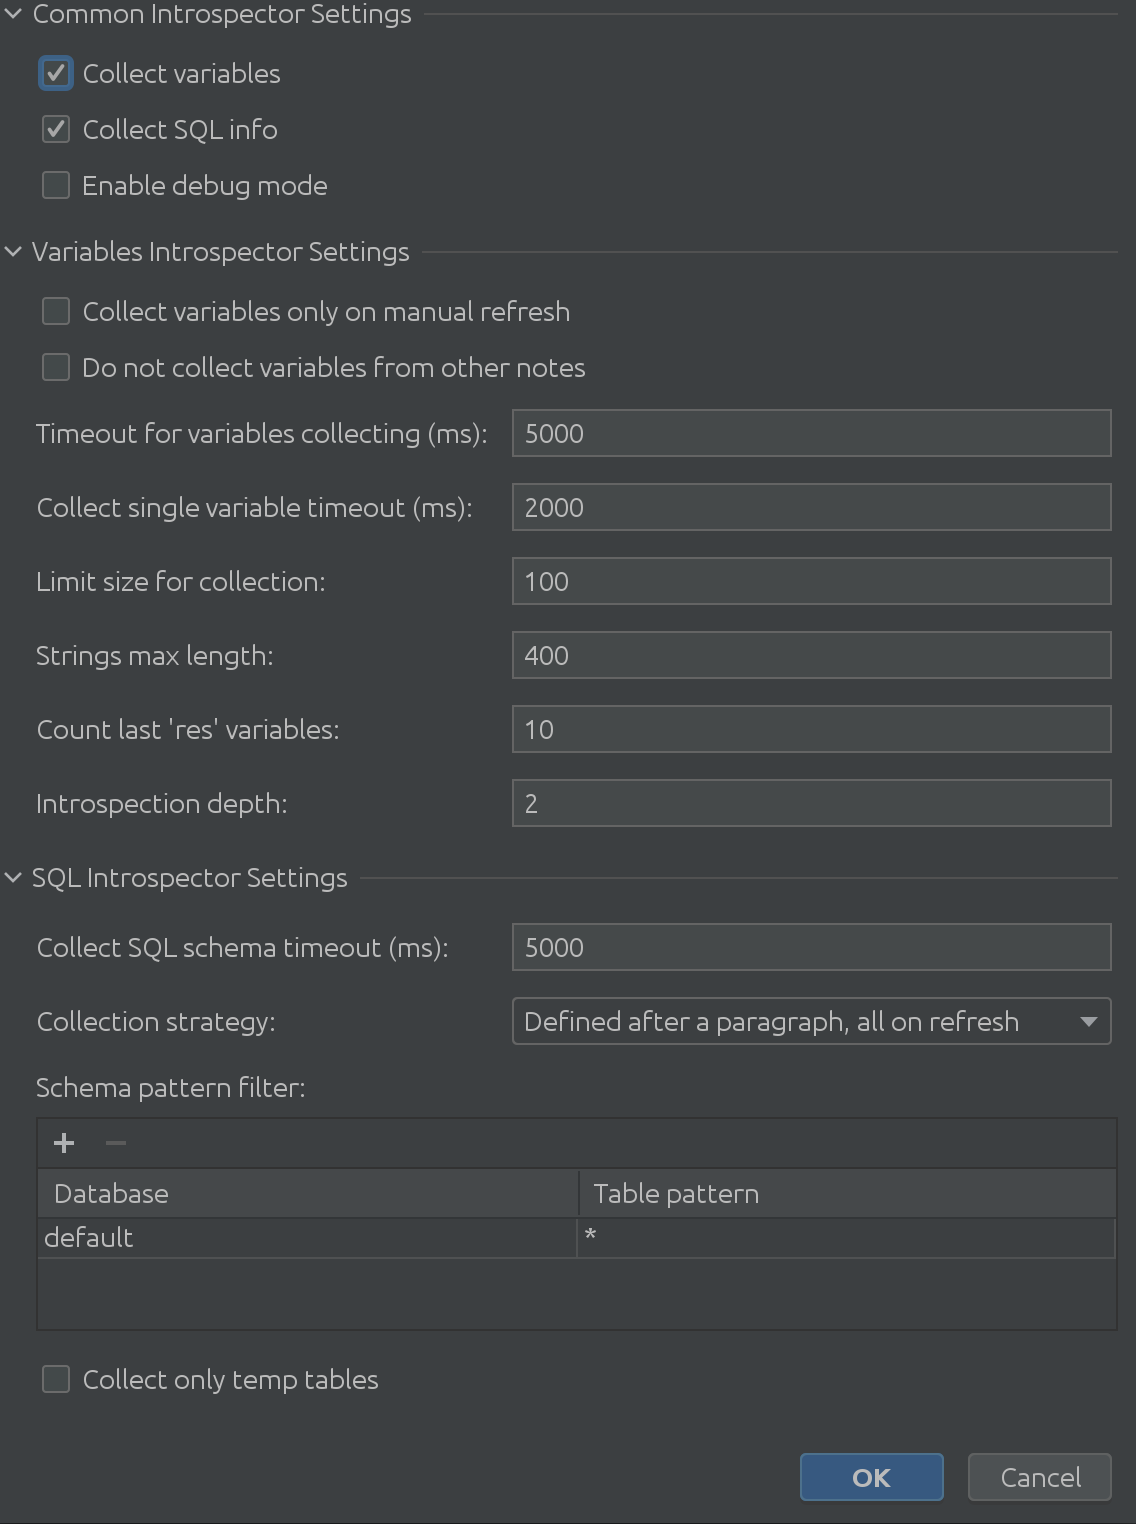
It’s absolutely massive, right?
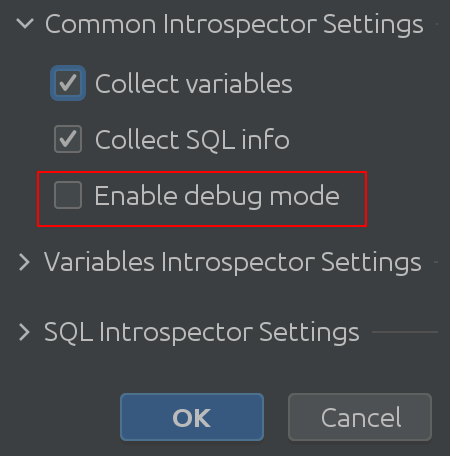
As we can see in the previous screenshot, it consists of 3 main parts:
1. Common Interpreter Settings
2. Variable Introspector settings
3. SQL Introspector settings
Hopefully the name “Common Interpreter Settings” is self-explanatory. You can enable or disable the collection of info about variables from Spark SQL, and it allows you to enable debug mode. Admittedly this is most useful for us, the plugin developers, but you can use it to get a deeper understanding of the plugin’s inner workings.Variable Introspector Settings
Valuable feedback from our customers has given us an understanding of exciting corner cases when introspecting variables. Variable Introspector Settings addresses all of the potential issues you might encounter. Need to introspect longer texts? Increase the limit of the String size. Now it takes more time to extract them all? Increase the timeout while waiting for Zeppelin to answer. Have to work with deeply nested structures? You can fine-tune the maximum dig depth.
SQL Introspector settings
We didn’t even realize how useful SQL Introspector would be for some of our customers needed to find out how complex usage scenarios can be across lots of schemas and tables, which led us to the next exciting solution:
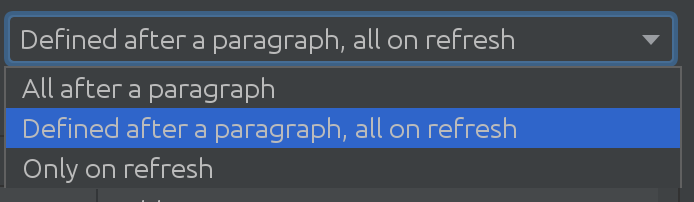
Depending on the size of your Spark database, you can use different strategies when you need to pull changes from the Spark database. Sometimes databases are so extensive that we will decide not to pull changes automatically at all.
All of these changes led us to switch on State Viewer by default in this release.
We also learned that when our customers work with Spark, they work with more than just the default catalog. Sometimes, the “default” catalog is absolutely massive, and they need to filter data from it somehow. That’s why we introduced the following filter in the SQL Introspector:
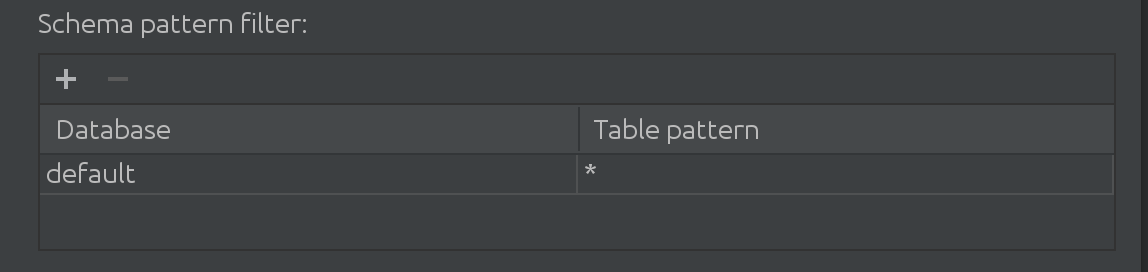
Here you can filter and add more catalogs to look for data for autocompletion, as well as limit the subset of queried tables inside a catalog.
If you use AWS Glue or Hive Metastore, you might also find this checkbox useful:

Your company’s Glue is likely to be incredibly large, and you only need the data you put there during your session.
State Viewer is now enabled by default
We’ve introduced many improvements since our last blog post on this feature. We are very grateful to our customers for their ongoing support and continuous feedback – it was possible to implement many changes because of them! We are now confident that Big Data Tools is stable and flexible enough for our general audience to be able to use it continuously for these reasons:
1. It no longer requires changes in Zeppelin.
2. It allows you to fine-tune variable introspection to your use case.
3. It allows you to tune SQL introspection according to the context and complexity of your tasks.
4. The mechanics of hidden cells have been improved.
5. We have a method for our users to check and deeply understand the plugin’s functionality. took an extra step to allow our customers to “check up on us” and make sure we’re doing only what we say we’re doing, and no more.
If you’re interested in trying Big Data Tools, you can easily find the plugin here.


