Data Science Survey 2018 Results By Numbers

Data Analysis, Machine Learning, and AI are rapidly growing in popularity and drawing more and more attention in tech news. How does the data science world look today and how is this industry sector evolving? What types of activities are data scientists primarily involved in? What programming languages and tools are in use? To answer these and many other important questions, last spring JetBrains conducted a Data Science Survey collecting responses from over 1,600 data scientists living in the US, Europe, Japan, and China.
We are super-excited to share with you some of our incredible findings, along with the raw survey data which you can use to draw your own conclusions!
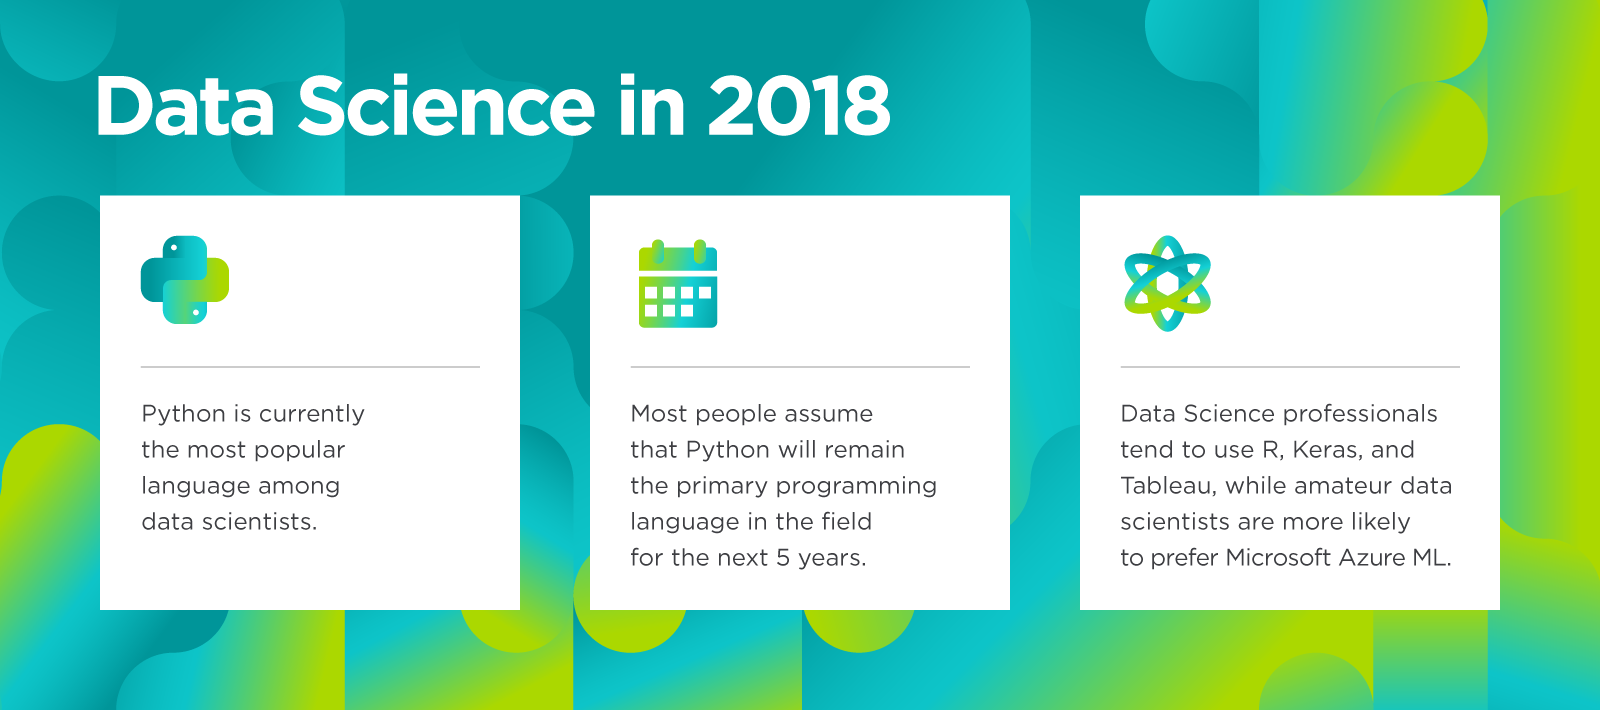
Did you know that Python is now the most popular language among data analysts and engineers? How about that most people assume that Python will remain the primary programming language for data science for the next 5 years? Learn more about these and other insights in the survey infographic:
View the results of Data Science Survey 2018
Key Takeaways
- Data processing, data visualization, and basic statistics are the top three activities that data scientists are involved in.
- Python is the main programming language for data analysis with most users not willing to migrate to other languages.
- Most of the respondents believe that Python will remain top for the next 5 years.
7% of respondents identified as not professional data scientists want to adopt Kotlin in the nearest future. - Apache Spark, Apache Hadoop, and Apache Hive are the top three big data tools.
- Jupyter Notebook is the top code editing tool for people involved in data science, followed by PyCharm and RStudio.
- Nearly 80% of those using deep learning libraries use TensorFlow.
- 78% of respondents use their local machines to perform computations.
- AWS is the most popular cloud service provider among data scientists.
- 81% of data scientists analyze data for non-IT industries.
- Get more insights from the full report.
Methodology
We distributed the survey via targeted ads on Facebook, LinkedIn, and Twitter. We filtered out those replying “I’m not involved in data analysis” with the first questions. In the US, Japan, and China, we collected 400 complete and valid sets of responses from each country, and we used quotas to get another 400 responses from European countries.
Important Note: Some inevitable bias may be present since the survey was organized and promoted by JetBrains and some JetBrains users might have been more willing to participate.
Want to dig into the raw survey data to draw your own conclusions?
We couldn’t include all the potential findings in the report without it becoming bloated. If you have any specific questions that are unanswered, send them to us and we’ll dig into the data for you for an answer. Or if you want to delve into the data yourself, we’re also sharing the raw survey data, which anyone can use to arrive at their own conclusions and additional findings. PDF version of the infographic is also available if you’d like to print it out or read it as a file.
We hope the survey findings will help all of us better understand the current state of the Data Science community, see the big picture, and get answers to some of our burning questions. We’d be very interested to learn about your findings! Please share them on Twitter or other social media, mentioning @jetbrains with the #datasciencesurvey hashtag. We’re also extremely open to any suggestions and feedback related to this survey so we can run an even better one next time.
Finally, we would like to just say a huge thanks to the participants of the survey!
JetBrains
The Drive to Develop
Subscribe to JetBrains Blog updates